

How Prometheus stores scraped metrics
Prometheus writes samples into a local TSDB organized as a sequence of time-bounded blocks (by default, ≈2-hour blocks). These blocks and associated files live on the server filesystem unless you change the storage path. Change the TSDB directory with--storage.tsdb.path:
chunks— compressed series samples for that block’s time range.index— index files mapping metric names and label values to series.meta.json— metadata for the block.chunks_head— in-memory head block currently being appended to before compaction.wal— write-ahead log used for crash recovery.
Do not rely on remote network filesystems (NFS/SMB) for the TSDB directory. Prometheus expects fast, POSIX-like local disk access to avoid corruption and performance issues. Use remote write to external long-term stores instead.
Retention and sizing (configuration flags)
Prometheus supports retention limits by time and by size. You can set either or both — when a retention limit is hit, Prometheus deletes the oldest completed blocks.
Examples:
Capacity planning
Estimate required disk with a simple formula: required_disk ≈ retention_time × ingested_samples_per_second × bytes_per_sample Guidance:bytes_per_samplevaries based on cardinality, scrape intervals, label counts, and compression. Measure it from a test Prometheus instance or use TSDB metrics.- Use TSDB-related metrics exposed at
/metricsto refine your estimate.
Use observed metrics to compute bytes/sample and multiply by expected sample ingestion rate and retention window to get a more accurate disk sizing estimate.
Limitations of single-node local storage
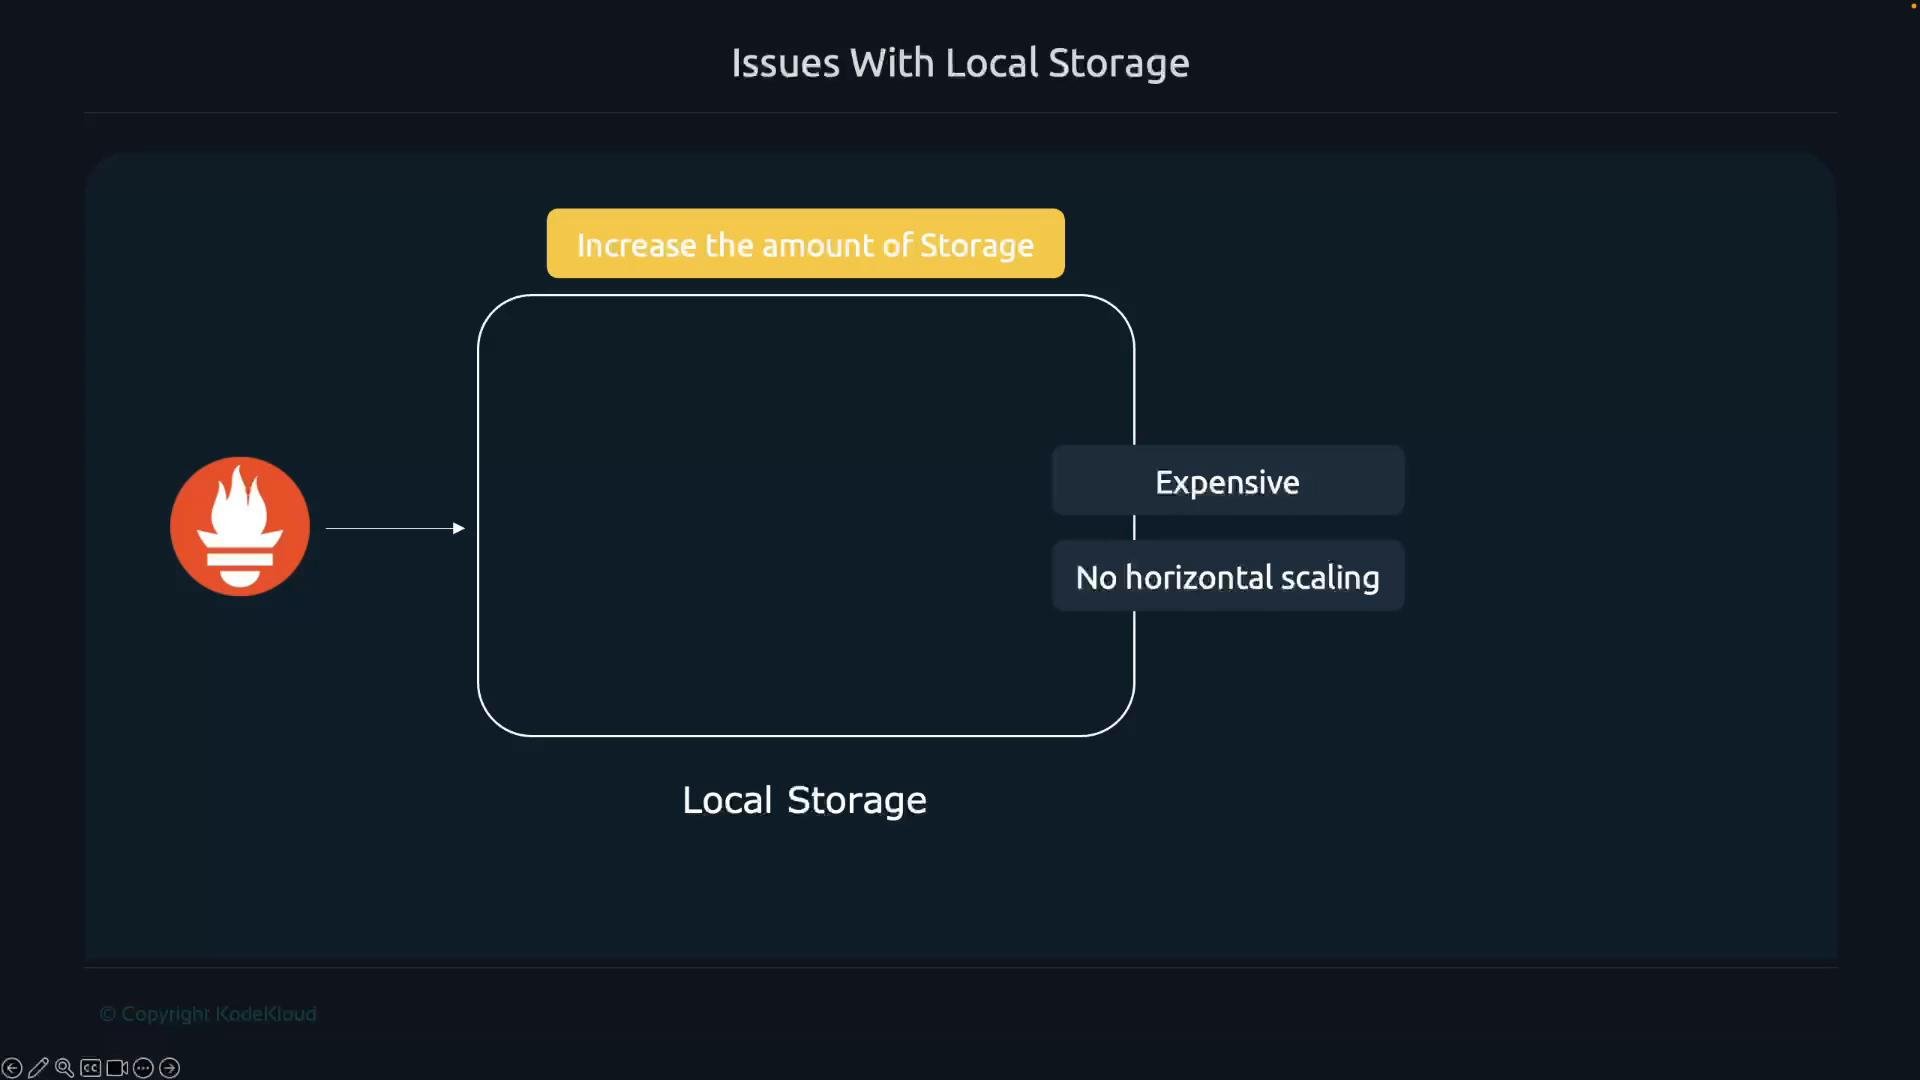
Running Prometheus with local TSDB is simple but has trade-offs:- Cost: attached block storage (large disks/instances) can be expensive at scale.
- Single-node design: Prometheus writes to a single local path and does not provide built-in horizontal sharding for the TSDB.
- Operational risk: a single Prometheus instance with local storage is a single point of failure for writable metrics.
Remote write / remote read — extending Prometheus for long-term storage
Prometheus exposes two APIs to integrate external storage:- remote_write: streams scraped samples to an external storage endpoint for long-term retention.
- remote_read: queries data from a remote store as if it were local.
write_relabel_configs to drop, keep, or rewrite labels before sending data to remote storage. This reduces storage costs and controls cardinality sent to the long-term store.
Third-party long-term stores
Several projects provide scalable long-term storage by accepting Prometheus remote_write and storing compressed blocks in object storage:- Thanos — adds a global query layer and writes/retrieves blocks from object stores (e.g., S3).
- Grafana Mimir — scalable, multi-tenant long-term storage compatible with Prometheus remote APIs.
- accept
remote_writefrom Prometheus, - persist data into object storage (S3, GCS, Azure Blob),
- provide a query federation/query layer that supports PromQL across short- and long-term data.
For exam and operations: remember Prometheus supports
remote_write and remote_read. Tools like Thanos and Grafana Mimir are widely used to provide long-term storage, typically backed by object storage (e.g., S3).Links and references
- Prometheus configuration: https://prometheus.io/docs/prometheus/latest/configuration/configuration/
- Thanos: https://thanos.io/
- Grafana Mimir: https://grafana.com/oss/mimir/
- Object storage: AWS S3 (https://aws.amazon.com/s3/), Google Cloud Storage (https://cloud.google.com/storage), Azure Blob (https://azure.microsoft.com/en-us/services/storage/blobs/)