In this video we’re going to be learning about how we can scale Prometheus, as well as implement high availability. So let’s say that we have a Prometheus server, and this Prometheus server is configured to monitor several devices. Now over time, you’re going to see that you’re going to start adding more jobs, and your Prometheus server is going to be configured to scrape more and more devices. And eventually, even though Prometheus is designed to scale, it’s going to eventually hit a limit, where once you have enough devices to monitor
The image illustrates a diagram titled "Scaling Prometheus" showing a network of servers connected to a central Prometheus logo, indicating a limit.
and scrape configured, it’s eventually going to overwhelm Prometheus. And so you’ll see that Prometheus will start to have a little bit of trouble maintaining and collecting all of these metrics. And on top of that, as you configure more and more jobs for your Prometheus server, every time you make changes, you have to restart your Prometheus server. And you may not think that this is that big of a deal, but keep in mind, every time you restart your Prometheus server, if you want to see current metrics, you might see slightly outdated
The image illustrates a diagram of scaling Prometheus, featuring a central Prometheus icon connected to multiple server icons, indicating distributed data collection.
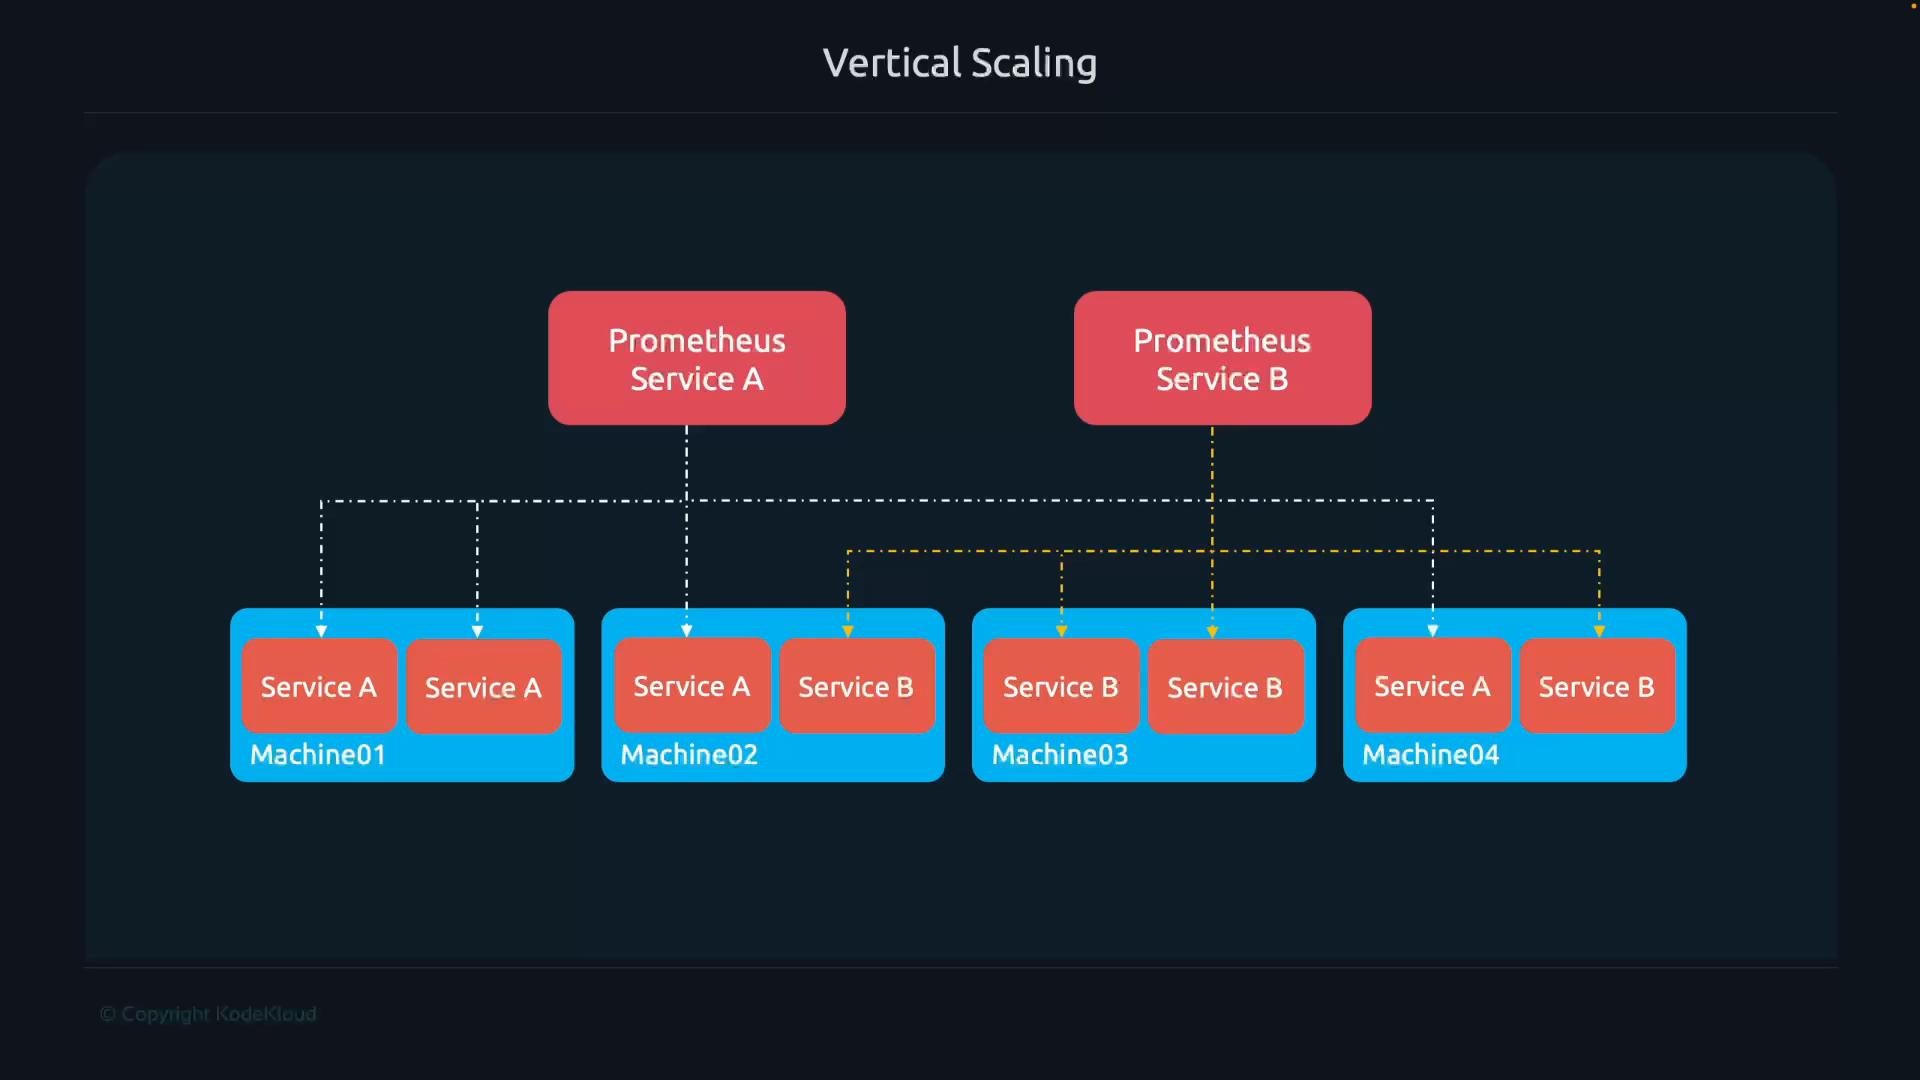
metrics because you have to wait for the next scrape interval to collect the most recent data. And so if you’re constantly restarting your Prometheus server because you’re adding new devices, it may become a little bit slow to use that Prometheus server because you’re always waiting for it to collect the next batch of metrics, because you had to restart it. And so what’s the solution to this? How do we actually scale up Prometheus so that we can monitor more devices? Well, I think it’s a pretty simple and obvious solution, which is, what if we use multiple Prometheus servers? And so that way, each Prometheus server gets its own set of devices that it collects metrics from, and it helps us avoid hitting any scalability issues. We won’t have to worry about overwhelming our Prometheus server because each Prometheus server only gets a subset of your different applications and devices that it needs to monitor. Now, when it comes to scaling Prometheus, we have two different options. We have vertical scaling and horizontal scaling. So let’s start off by going over vertical scaling. And so in this case, you’re going to have two Prometheus servers, or you can have more than two, but we’ll just keep this example as simple as possible. So we’ve got two Prometheus servers, and the idea behind vertical scaling is that one Prometheus server is responsible for managing one set of applications, services, or devices, and then another Prometheus server is responsible for
The image is a diagram of vertical scaling, showing Prometheus services A and B running on multiple machines, each with different configurations of services A and B.
monitoring a different set of services or applications. And so if your team has, you know, if your organization has multiple different applications that they want to monitor, you might have one Prometheus manage, you know, Prometheus A manage a couple of those services, and then Prometheus B manage a couple of the other services. So they’re all monitoring different applications, different devices, different servers. So with vertical scaling, we get a couple of benefits. One is it makes cardinality considerations more visible to the service owners, because you’re going to have, you know, maybe each team within your company manages the Prometheus server that monitors their own application. So they have to be a little bit more careful on how they set up the different labels and the cardinality of them, so that they don’t overwhelm their own Prometheus server, because they own it, right? They are the team that owns it because that Prometheus server monitors just their application. Teams will feel both empowered and accountable for monitoring their specific services because they own that Prometheus instance. And it can enable more experimentation for rules and dashboards without the
The image discusses benefits of vertical scaling, highlighting improved visibility for service owners, team empowerment and accountability, and enhanced experimentation capabilities.
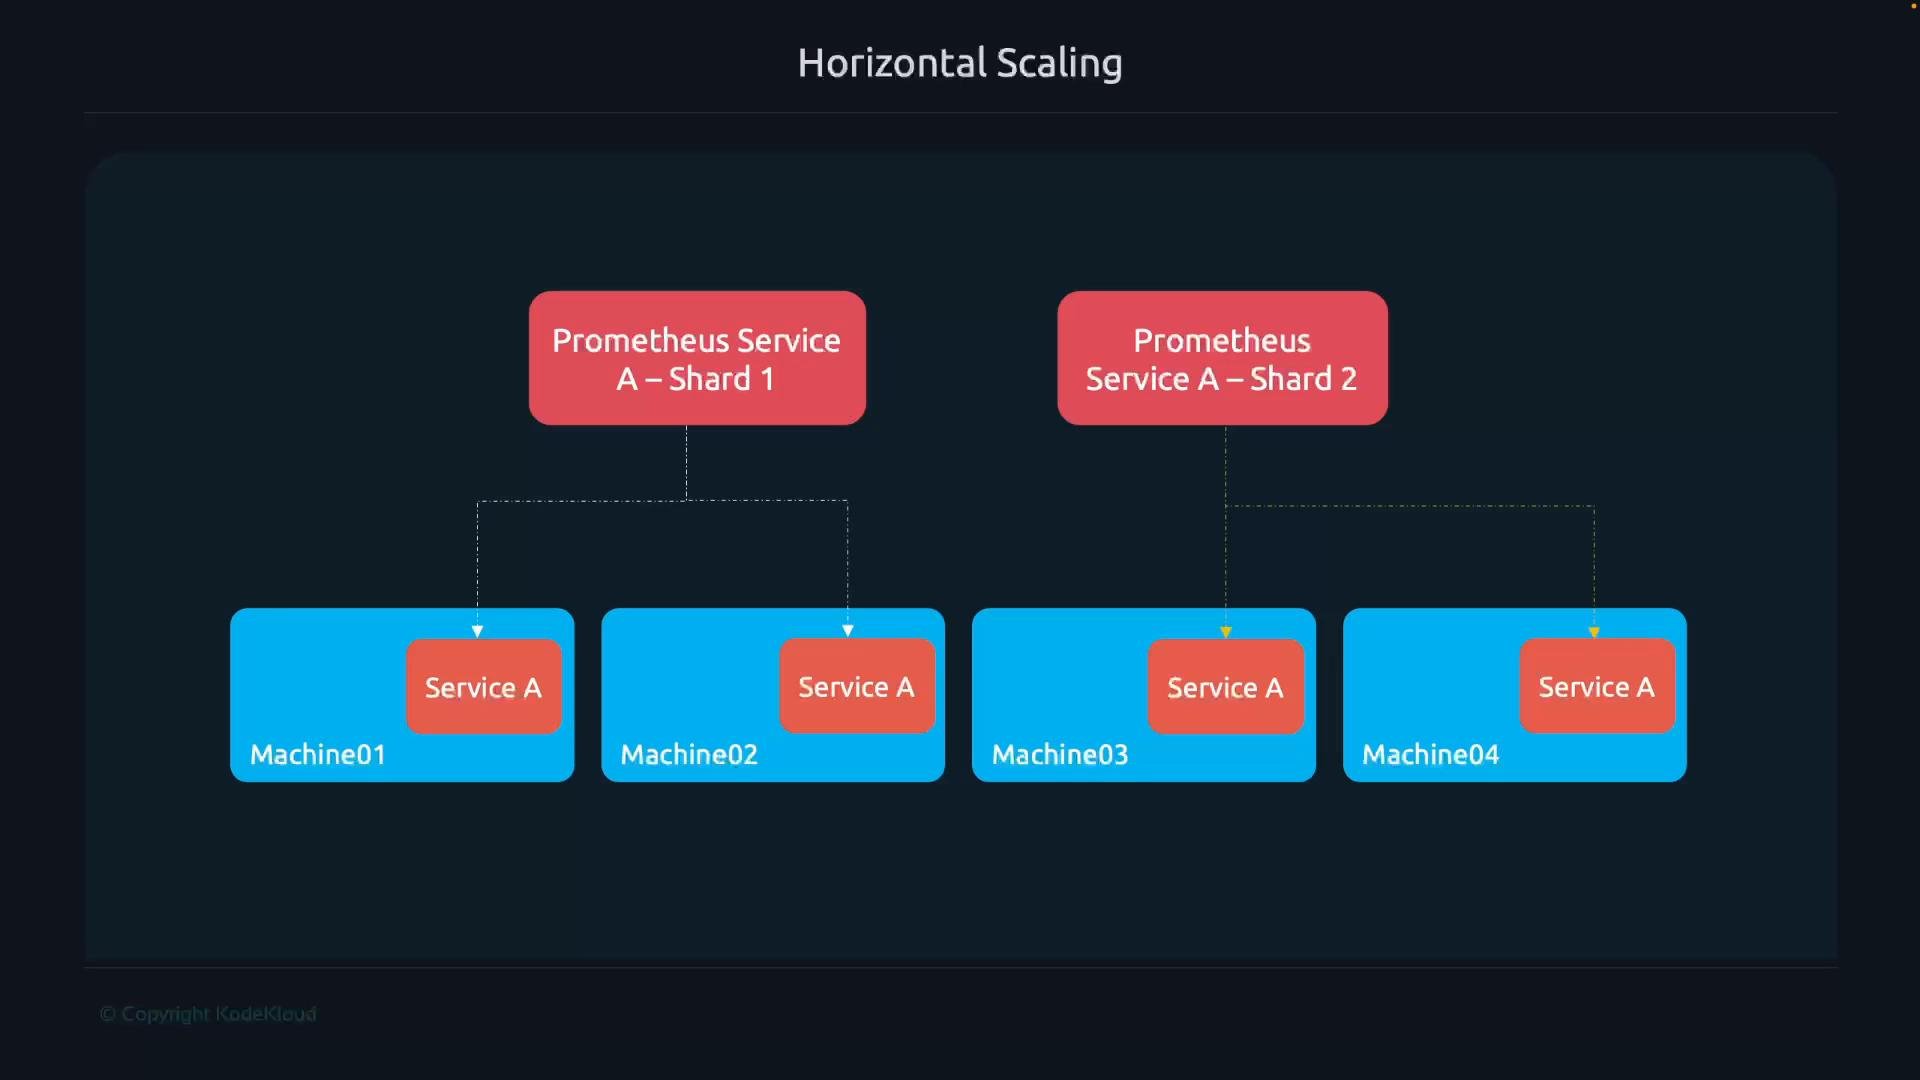
fear of impacting other teams, because you can have a Prometheus server for each of the different teams within your organization. So you can kind of customize it however you want for your team without worrying about it potentially breaking things for another team. So now let’s take a look at horizontal scaling. So in this case, we’ve got one service called service A running on a couple of different machines. And what you’re going to do with horizontal scaling is that for one scrape job, right, we have a scrape job for service A, we’re going to split that scrape job across multiple Prometheus servers. So we’ve got server one, server two, and we’re going to perform what’s called sharding. So the Prometheus server one will cover, you know, in this case, half of the service A instances, and the second Prometheus instance will cover the other half. So the main difference that I want to highlight is that vertical
The image illustrates a horizontal scaling system with Prometheus service shards distributing "Service A" across four machines.
scaling is they’re going to cover different services, different applications. Horizontal scaling is if you have a very large number of instances for one scrape job, you know, Prometheus might struggle with that. So you spread that one scrape job across multiple Prometheus servers. Okay, so let’s see how to configure horizontal sharding. And I want to give you an example of how to perform the horizontal scaling, because vertical scaling is easy. It’s just a different scrape job for each Prometheus server. Whereas for horizontal scaling, we have to split one scrape job. So I’m going to show you guys how to do that. So here on Prometheus server one, we’re going to have our scrape job called node.
And what you have to do is, you perform this, you add this configuration. So you do relabel configs. And the first action is you’re going to match on the address.
So we want to get all of the different targets based off of their address. And we’re going to perform a hash mod. So it’s going to perform a hash on each one, and then it’s going to perform a modulus operation. And we’d set the modulus value to be the number of Prometheus instances. So if you want to spread the job across five Prometheus servers, you would set the modulus to five. And then we take the value that we get returned from performing the modulus on the hash mod, and we add it to a temporary label called underscore underscore temp underscore underscore hash mod. And then we say we want to keep any metrics that have a label with __temp__hashmod set to a value of zero. So when you perform the modulus operation and you set it to two, it’s going to start counting from zero. So it’s going to give you either a value of zero or one. So when we say we want to keep the ones that have a value of zero, that means we’re going to keep half of them. And then on the other Prometheus server, it’s the same exact configuration. But we set the regex value to be one. So Prometheus one is going to keep half the metrics, which is going to have a value of zero, and the other half is going to have a value of one. So that’s why we do that. If you had five Prometheus servers, then you would do zero through four. And you’re going to see that after you do that, it’s going
to split all of your targets. You’re going to have roughly, and it may not be exactly fifty percent, but you’re going to have ideally close to fifty percent on Prometheus one and the other fifty percent on Prometheus two.
And one thing I want to highlight is all of your targets should be configured on all of your Prometheus servers. So if you have one hundred targets, you don’t configure fifty on
one and then fifty on another. You configure all one hundred on both of them. And then this relabel config will make sure that it only keeps the metrics that it needs. Now, when it comes to assisting with Prometheus and helping it scale up, if you’re finding that your Prometheus server is getting a little slow or it’s having a hard time keeping up, one of the things that you can do, if this is an option for your
organization, is you can modify the scrape interval for your jobs. So instead of scraping it every fifteen seconds, maybe do one minute. You know, if you don’t have to scrape as often, then you don’t have to worry about your Prometheus server getting overwhelmed because it doesn’t have to scrape all those metrics as frequently as possible. So that’s one option that you have at your disposal to help your Prometheus server scale up. If you don’t want to perform vertical scaling or horizontal scaling, if you want to just keep it as one Prometheus server, this is one option that you have. Now another option that you have to kind of help prevent your
Prometheus server from getting overwhelmed is to add a sample limit. Now this is almost like a security mechanism because it sets a limit to the number of time series that can be returned by a single scrape. And so if the limit is exceeded, the scrape is going to be considered a failure. So in this case, we set it to ten thousand.
So if we have a little scrape job and we receive over ten thousand metrics, just, you know, potentially due to a misconfiguration or something like that, that causes us to receive too many metrics, then
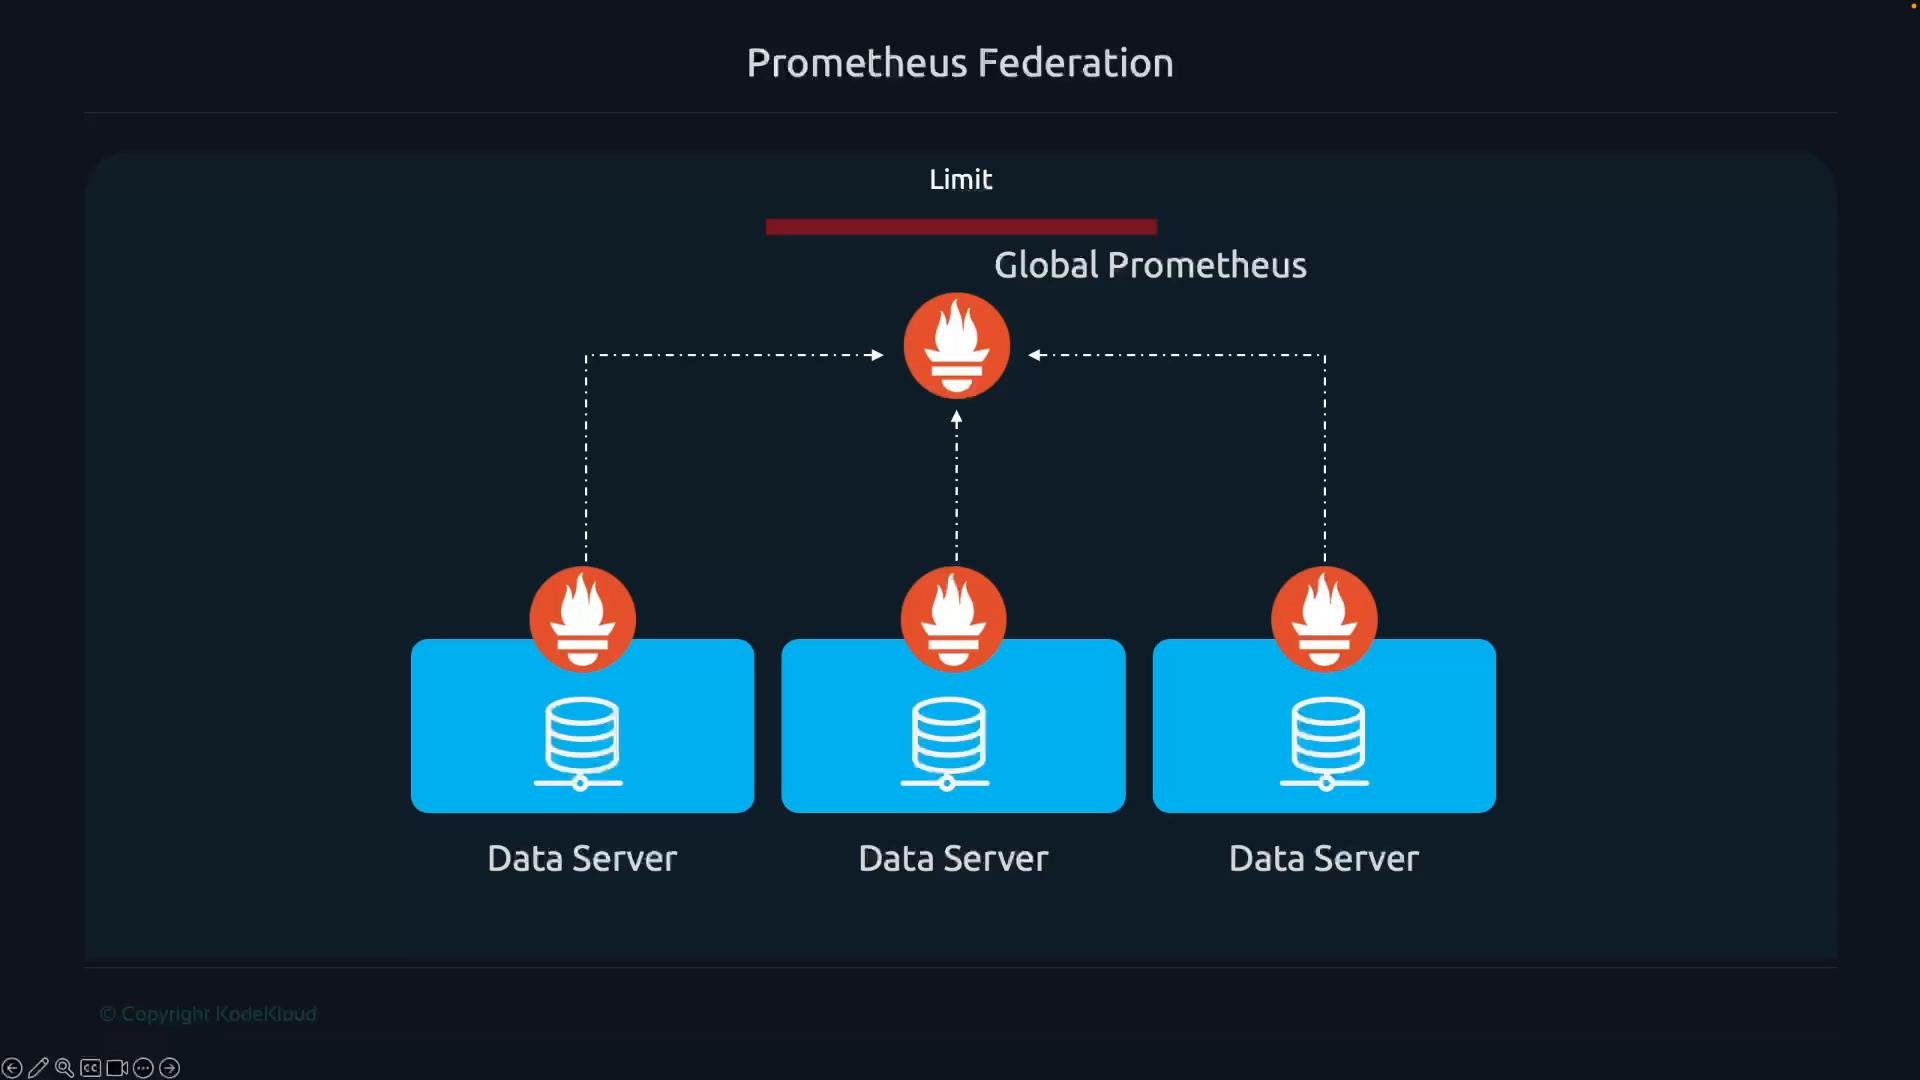
we will just drop it, just so that we can avoid our Prometheus server from getting overloaded. So now let’s move on to a feature called federation. So let’s say that we have three datacenters. Now, a common deployment option when it comes to Prometheus is, you would deploy a Prometheus server for each data center. And this would be a form of horizontal scaling because, you know, they’re going to be scraping different things. The first Prometheus server will handle data center one, the second one will handle data center two, and the third one will handle data center three. So you can break up all of those instances for each datacenter and spread them out to three different Prometheus servers. The problem with this is that you as the user, if you want to get some metrics, if you want to get metrics from datacenter one, you’d have to go and connect to that Prometheus server. If you want to get metrics from datacenter 2, you’re going to have to connect to that one. And if you want to get metrics from datacenter three, you’re going to have to connect to that Prometheus server. So you have to be able to connect to all three Prometheus servers. And we as human beings don’t really want to do that. We don’t want to have to go and connect to different devices to get information. And on top of that, we don’t actually have a way to see data across all of our data centers in one single place because each Prometheus server manages its own data center. And ideally, as human beings, we want to have a single pane of glass. I want to be able to connect to one application or one web browser and be able to see everything across all of my data centers. It’s going to simplify my life and make it a lot easier to monitor our infrastructure. And so what we can do with Prometheus is we can actually deploy a fourth Prometheus server, and we’ll call this the global Prometheus server. And that Prometheus server will aggregate metrics from the three individual Prometheus servers that we assigned to each data center. And then we, as the infrastructure team, or the monitoring team, or the DevOps team, we can then connect to the global Prometheus server to get information about all of our data centers in one single location. So, how do we configure a global Prometheus server to collect metrics from other Prometheus servers? Well, it’s actually pretty simple. So, we configure another job. And here, under the targets, this is going to be our individual Prometheus servers, so the ones for each data center. So you just put the IP addresses and then the port that Prometheus is running on, whose default is nine zero nine zero. And then the metrics path, it’s going to, you know, each Prometheus
server will expose the metrics it’s collected on a path called slash federate. So we want to tell it to scrape that specific path. And then we have to tell the global Prometheus server which metrics do we want. So you do params, then you do match, and then you have to match on some specific label. So in this case, this will collect every single metric with a label of job equals node.
You could specify whichever metrics you want. In general, you don’t want to collect all the metrics, you want to collect a very specific subset that you’re interested in. And then finally, we have to set the honor labels to true,
which is going to prevent the global Prometheus server from overriding the original labels. We want to keep the original labels. So we keep honor labels, set that to true. So now we’ve got the federation configured. And so Prometheus, the global Prometheus server, will now be able to collect all of the metrics. But there’s just one problem. If all of the metrics that were collected by the individual Prometheus servers get sent to the global Prometheus server, well, that ultimately defeats the purpose of us performing that vertical scaling, right? We separated each data center out with their own Prometheus server so that we didn’t overwhelm them. But then if we take all the metrics from each Prometheus server and then send it to one individual Prometheus server, it’s going to overwhelm that. So we don’t ever want to just send all of our metrics to the global Prometheus server, because we’re going to overwhelm it. And it would defeat the purpose of having multiple Prometheus servers, because we want to limit the amount of metrics each one has to handle. So instead, what we should ideally want to do is, instead of sending regular instance-level metrics, right, so metrics for each individual target, what
we want to do is we want to actually only send aggregate metrics. So you’re going to set up some kind of recording rule to collect some sort of aggregate metric. In this case, we’ve got two of them here with the CPU usage for a specific job and the entire data center. And then we also have the memory available across our entire data center. So these are like big-picture aggregate information about an entire data center
that would be interesting for us to know. And we would configure this on both of the Prometheus servers. And then what we would do is, on our global Prometheus server, we would tell it that instead of collecting all the metrics for the node job, which would overwhelm our Prometheus server, we want to actually collect just those aggregate metrics that we configured. And this is going to limit the metrics that get
sent to the global Prometheus server. Because ultimately, we only care about big picture things in the global Prometheus server. We want to see high-level metrics. And we don’t want to overwhelm the global Prometheus server with instance-level, target-level metrics.
Right. And so now we’re just sending aggregate metrics. And that should allow our global Prometheus server to not be overwhelmed. But there is still one last problem. When we send these aggregate metrics, they’re going to have some sort of label associated with them. It may not be job equals node, but they’re all going to have the exact same labels. And so if you have two Prometheus servers sending the same metric with the same exact labels, what’s going to happen is one of them is going to get dropped because the global Prometheus server is going to think that it’s a duplicate metric. So we need a way to make these metrics unique so that
The image illustrates a Prometheus Federation setup, showing a Global Prometheus collecting aggregate metrics from two separate nodes with the job label "node."
we can know that one is for data center one and the other is for data center two. How do we do that? Well, we’re going to, essentially, for all the metrics coming from datacenter one, we’re going to add a label called datacenter equals d c one. And then for datacenter two, we’re going to add a label that says datacenter equals DC2. And so since they have this extra label, it’s going to make sure that the metrics are unique between the two data centers.
And so the global Prometheus server will keep both of them. How do we do that? Very simple. We just add this config where we do relabel underscore configs, set the target label to data center, and then set replacement, which is going to set the value to be D C one. And then the same thing goes for Prometheus two, but we just set that to be DC two.
And then in the recording rules, we want to make sure that we add data center here when we do the group by, so that it’s going to add those metrics there as well.
And so then on our global Prometheus server, we can search for these metrics and filter based off of whether it’s DC one we want, or if we want DC two, we could just say DC two, and we’ll be able to filter down based off a specific data center.
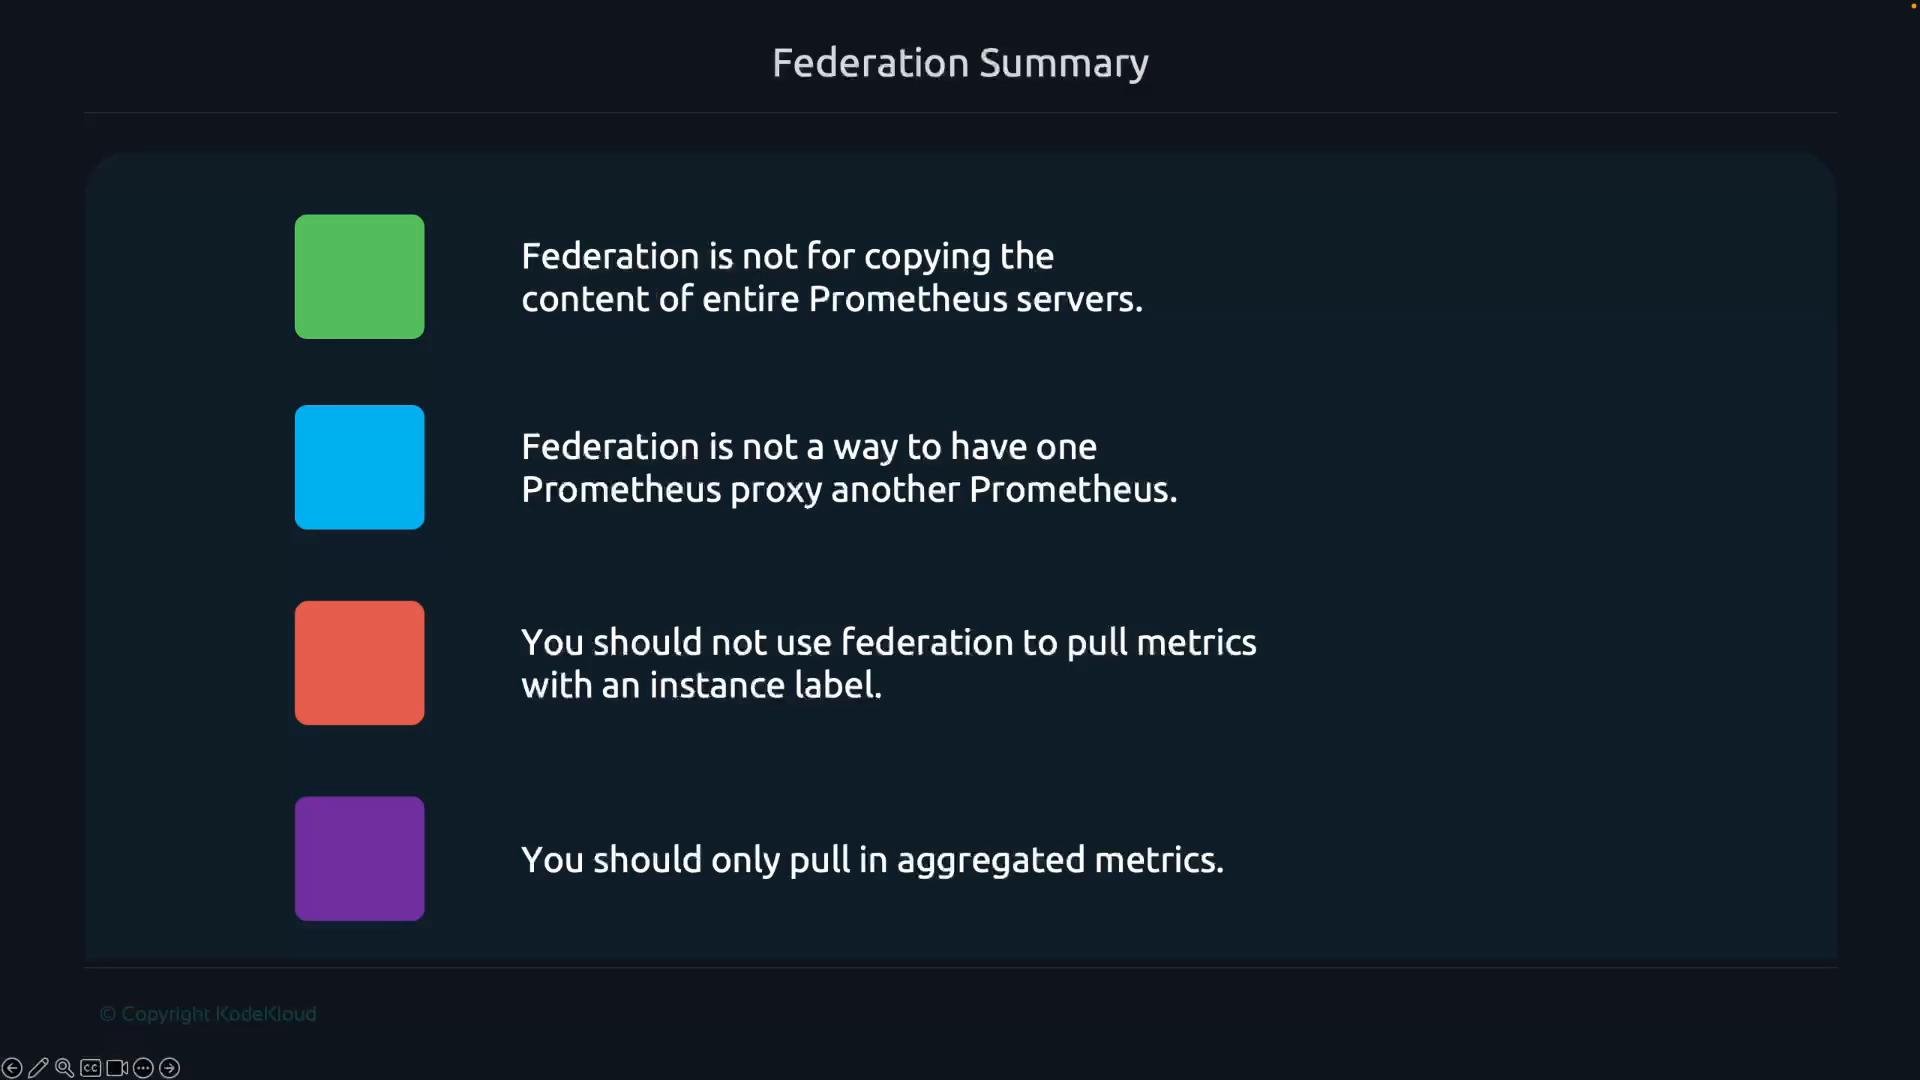
And so with federation, I want to highlight that federation is not for copying the contents of an entire Prometheus server. So in your global Prometheus server, you do not want to copy all of the metrics. And more importantly, federation is not a way to have one Prometheus server proxy to another Prometheus server. That is not the purpose of it. And you should not use federation to pull metrics with an instance label. If you’re pulling any metrics with an instance label, you’re doing it wrong. You need to be focusing on big picture aggregate metrics and not metrics for a specific application or a specific server.
The image contains a "Federation Summary" with key guidelines on using federation with Prometheus, including restrictions on copying entire server contents, proxying, pulling metrics with instance labels, and focusing on aggregated metrics.
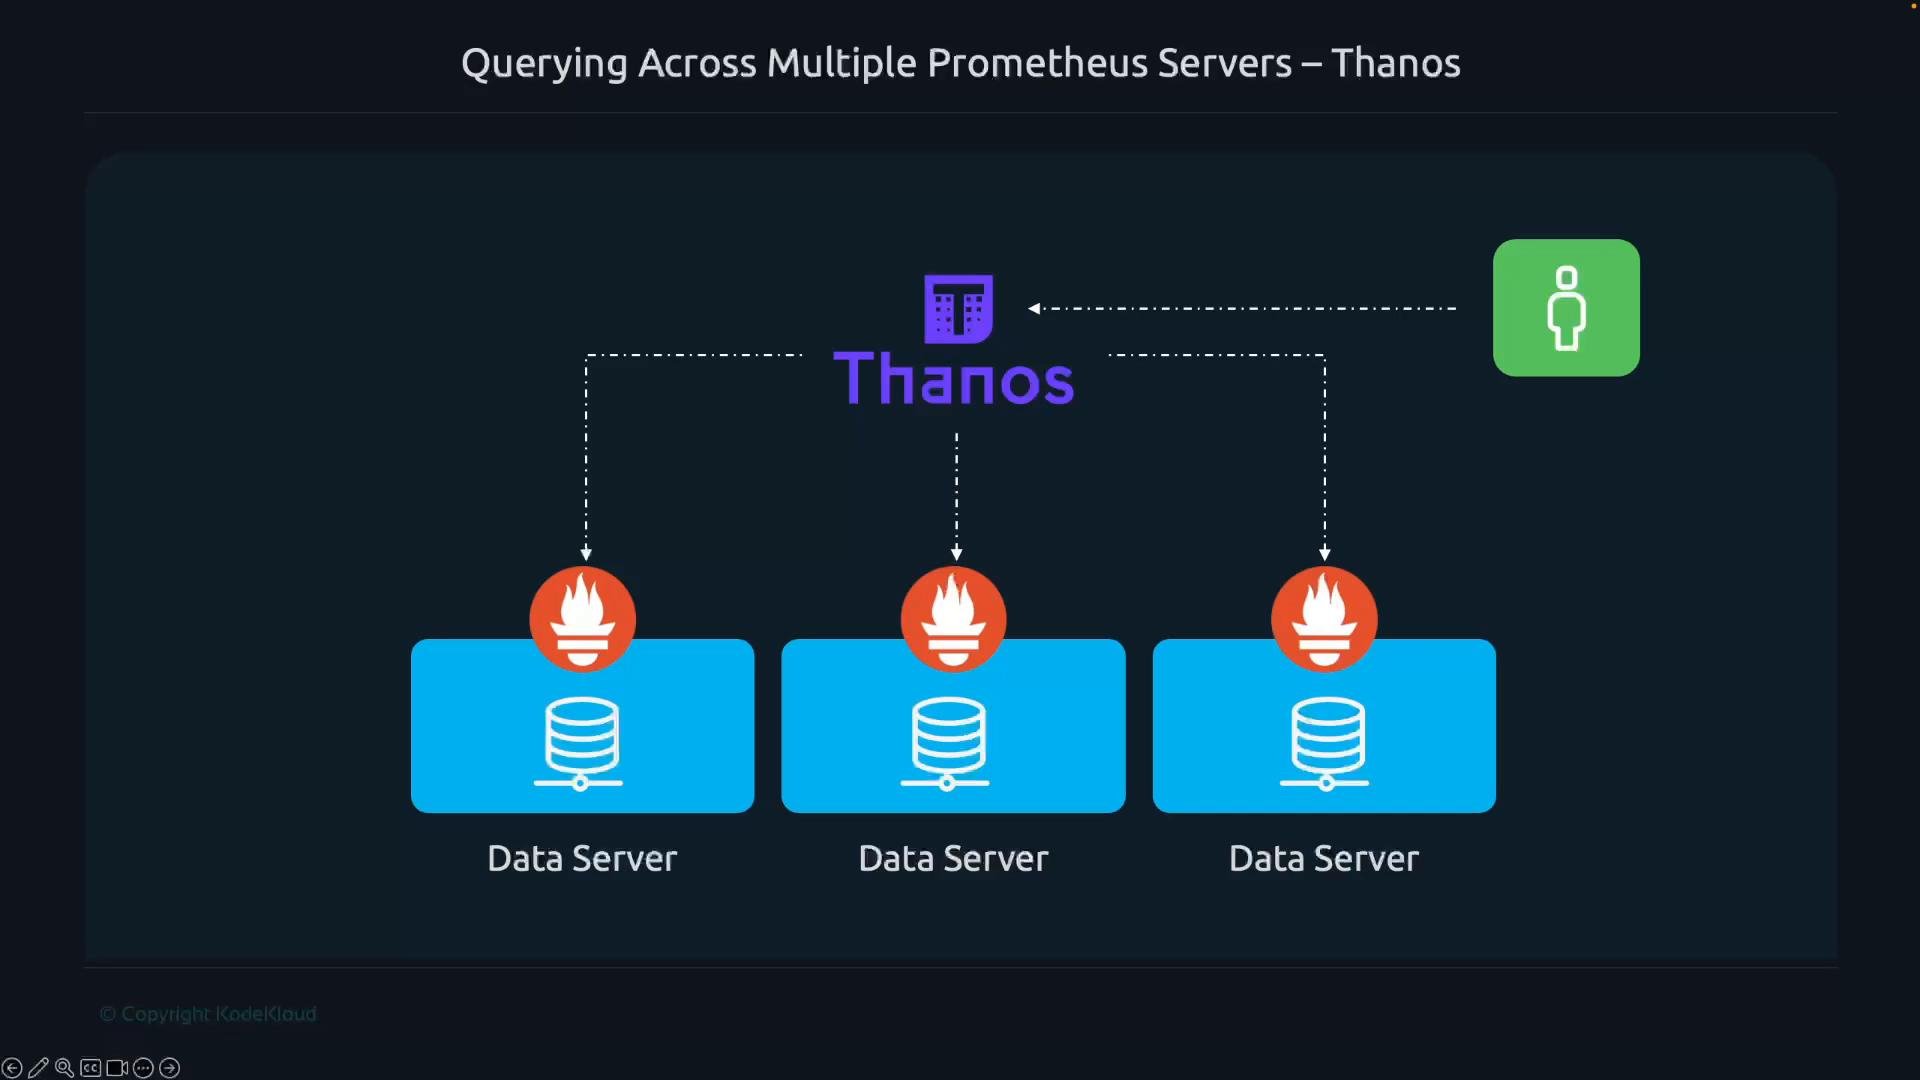
You want big picture metrics. Now, if you do want a single pane of glass where you can monitor and take a look at metrics from multiple Prometheus servers, and you don’t want to use federation because you don’t want to focus on, you know, aggregate metrics or things like that, you can also utilize something like Thanos. So Thanos has this ability where you can send a query to Thanos, and Thanos can then basically spread that query out to multiple Prometheus servers and then kind of aggregate it for you so that you can see everything all in one single location. And so that is one option that you have. And we kind of already covered Thanos a little bit about when we were going over how long-term storage
The image depicts a diagram showing how Thanos queries across multiple Prometheus data servers. It illustrates Thanos interfacing between the servers and a user.
works and how it’s a solution.

Watch Video