

Core Prometheus server components
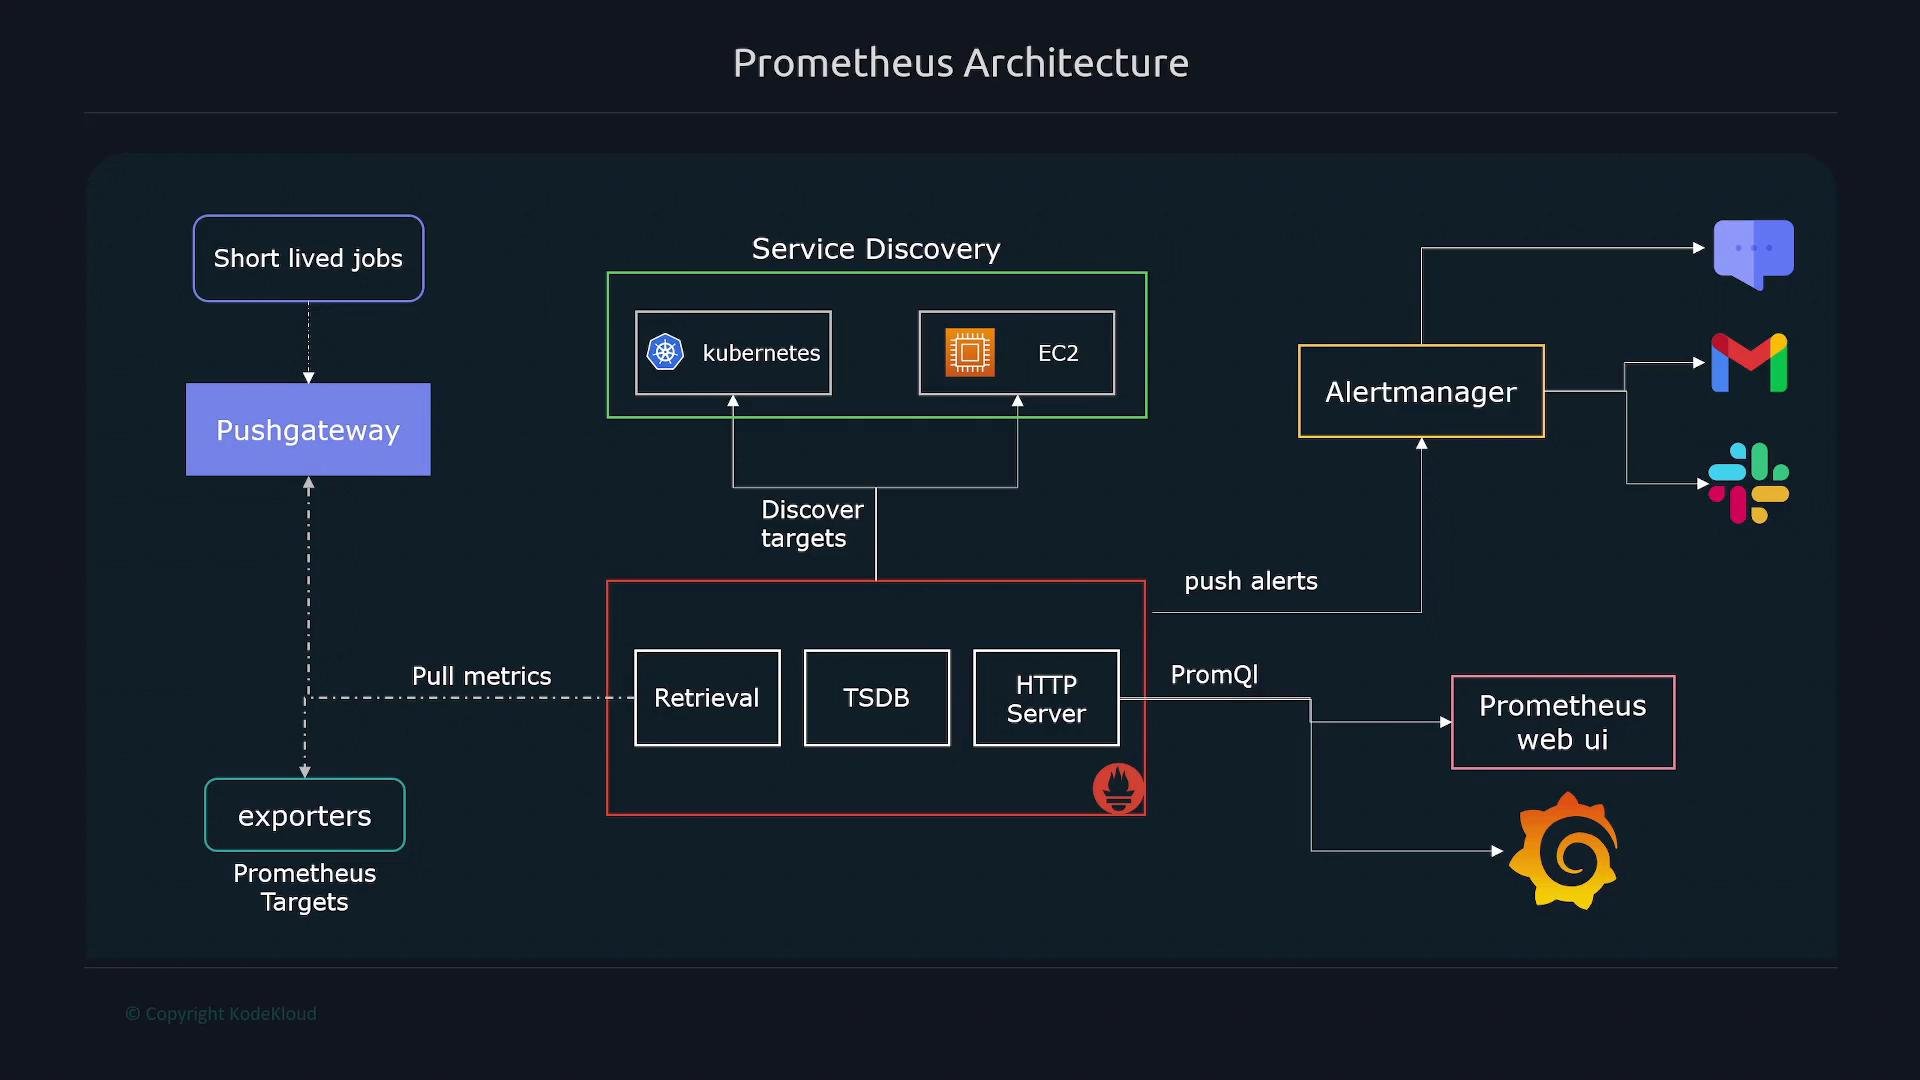
The main Prometheus server consists of three internal components:- Data retrieval worker: scrapes metrics from targets by making HTTP requests (commonly to the
/metricsendpoint). - Time Series Database (TSDB): stores collected metrics as time series.
- HTTP server: exposes APIs to query stored metrics using PromQL and to serve data to visualization tools.
How Prometheus collects metrics
Prometheus collects metrics by scraping configured targets. Each scrape is an HTTP GET to a target endpoint — the default path is/metrics, but you can configure a different path per target in prometheus.yml.
Example scrape_config (YAML):
Prometheus executes PromQL queries against the TSDB via its HTTP API and built-in web UI. For dashboards and long-term visualization, Grafana is commonly used to query Prometheus. See the Prometheus HTTP API docs for query examples: https://prometheus.io/docs/prometheus/latest/querying/api/
Exporters
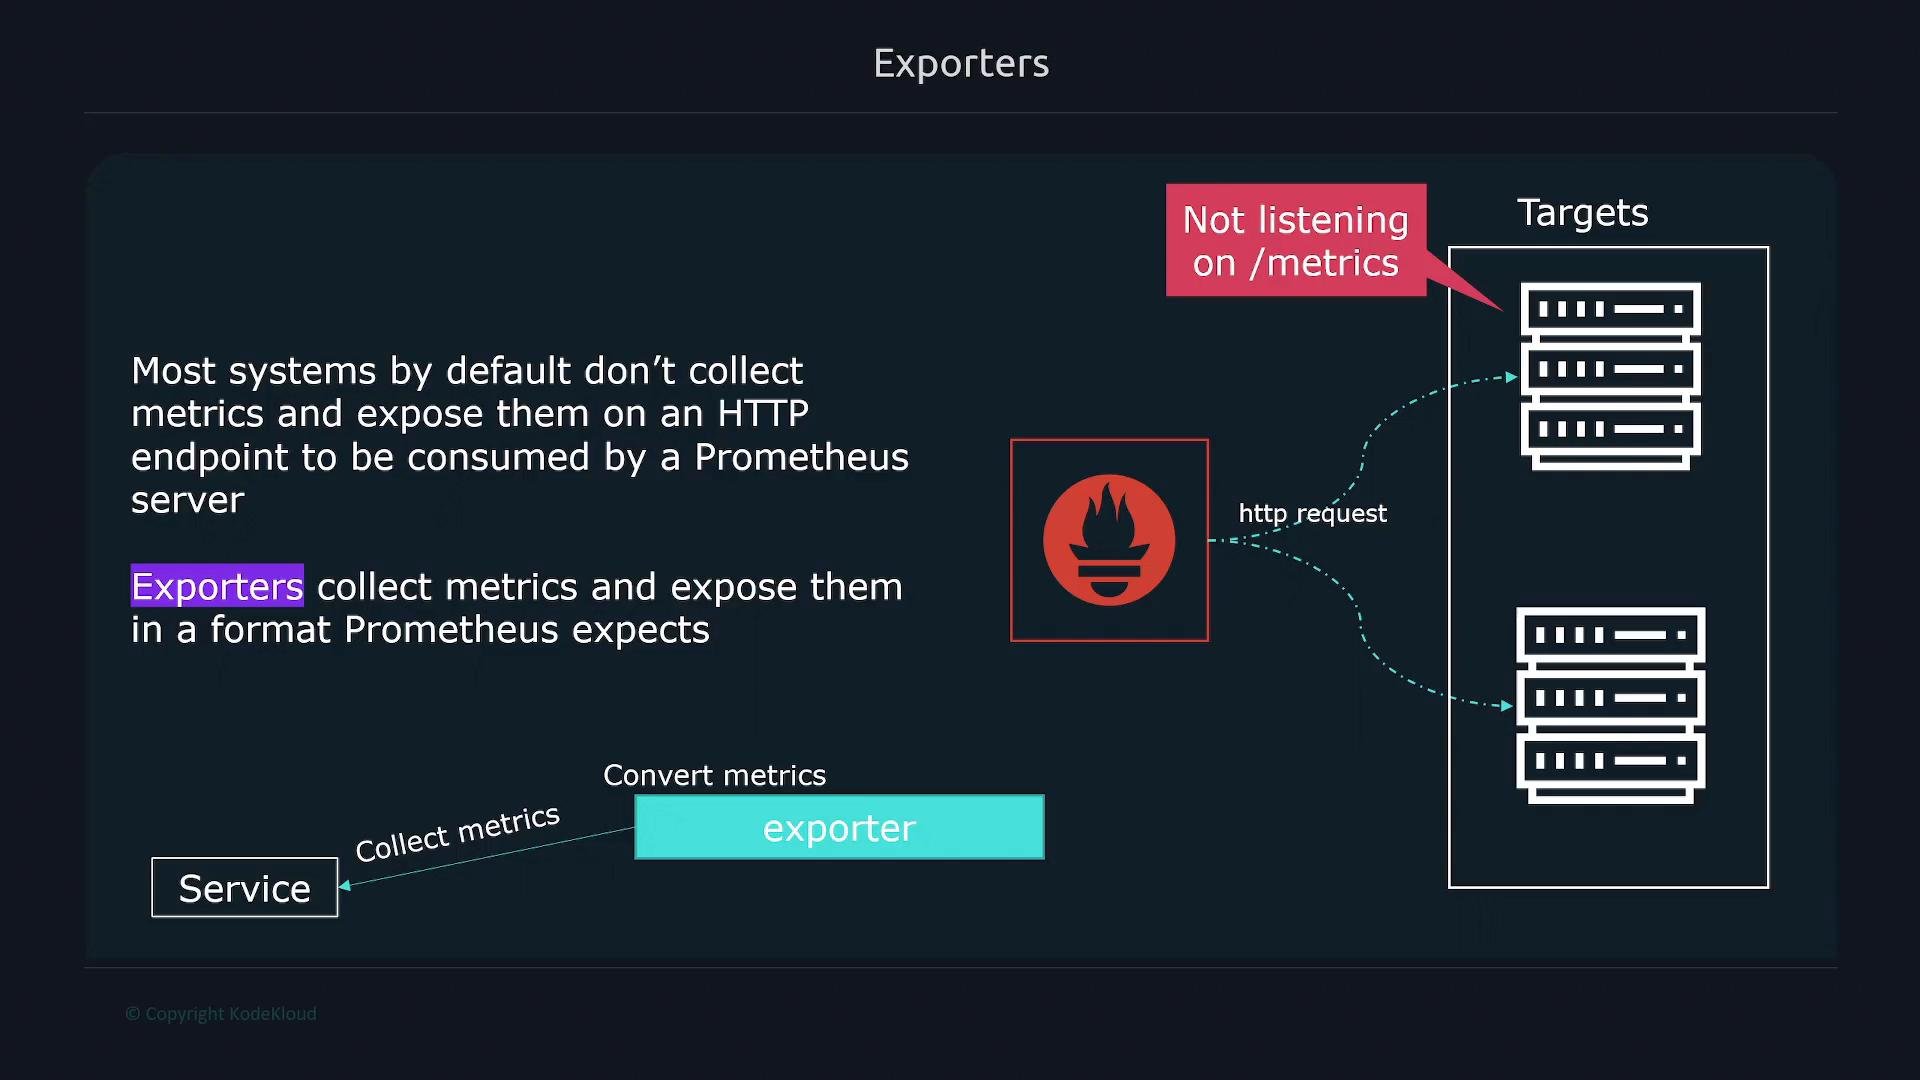
Exporters translate system, service, or application data into the Prometheus exposition format and expose it on an HTTP endpoint for Prometheus to scrape. Many systems do not natively expose metrics, so exporters act as adapters.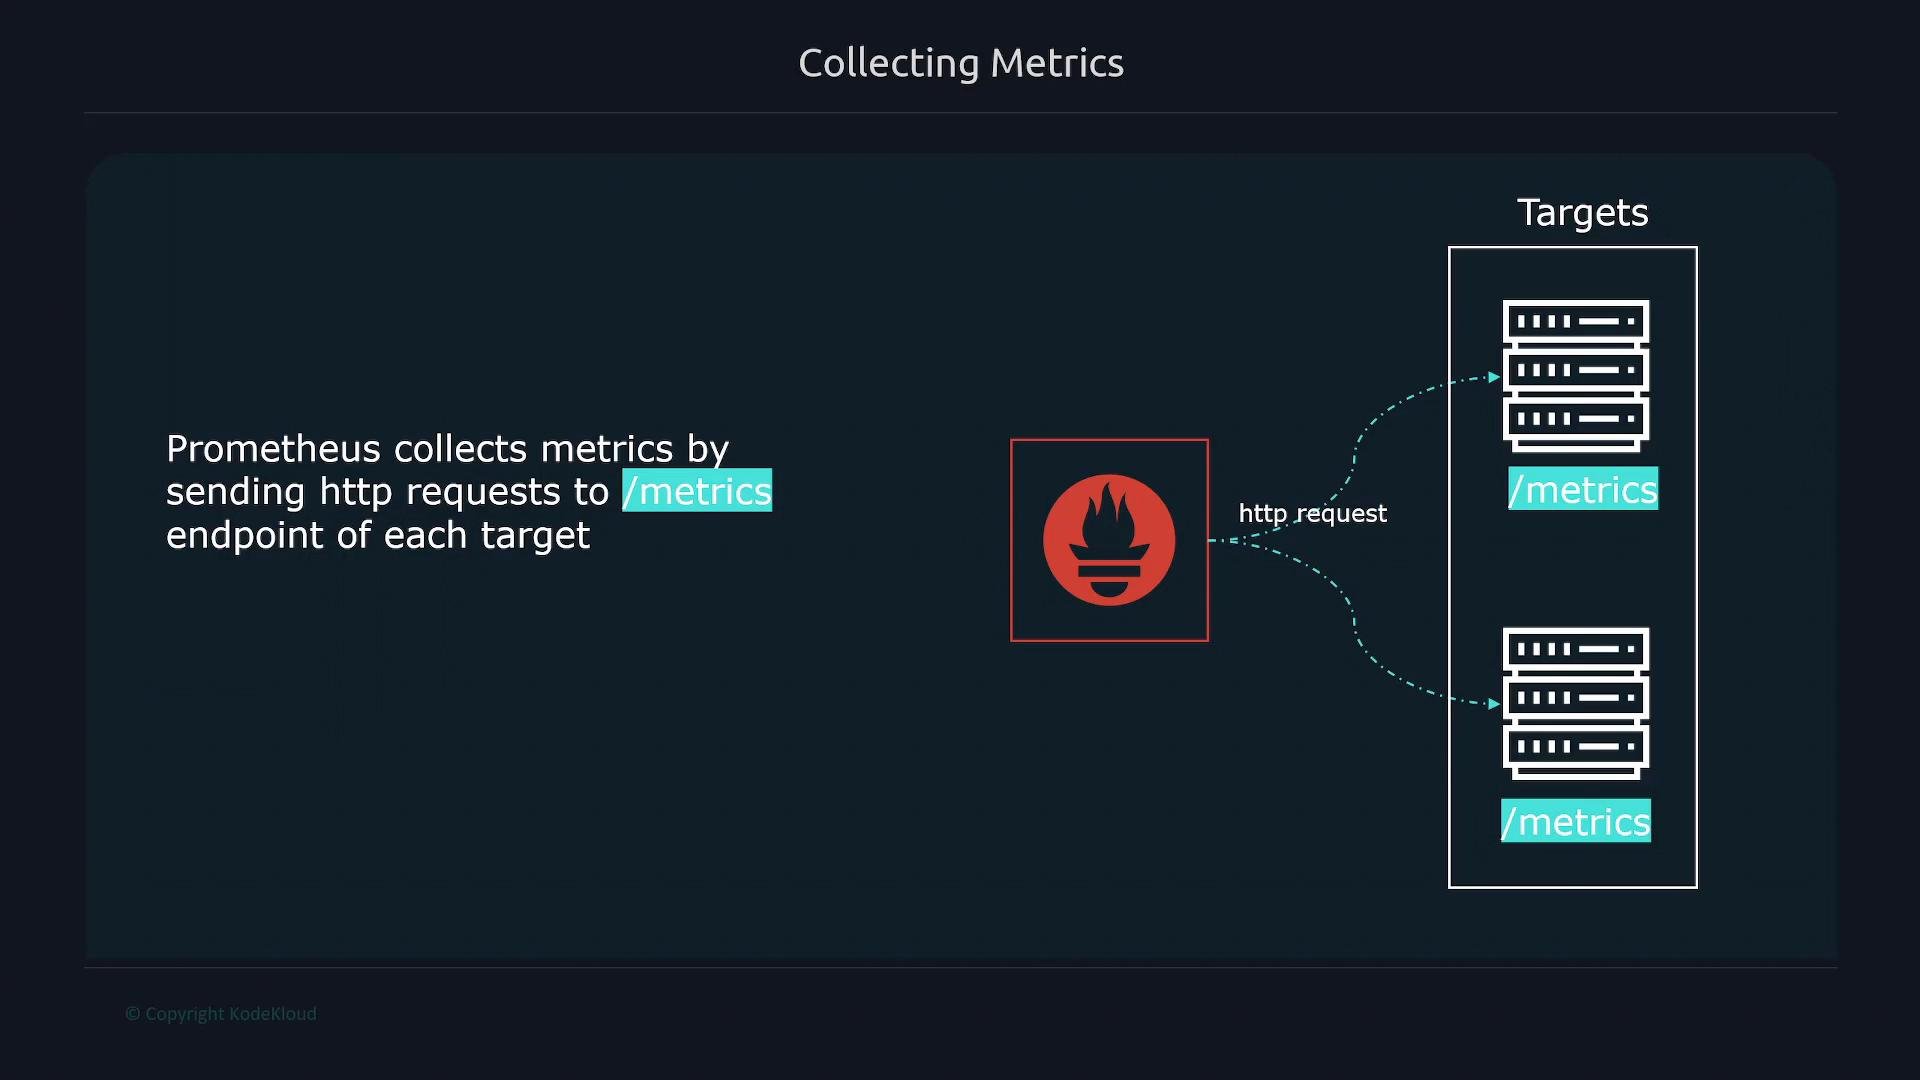
- Exporter collects metrics from the target system (OS, database, or application).
- It exposes metrics on an HTTP endpoint using the Prometheus exposition format.
- Prometheus scrapes the exporter endpoint and writes the results into the TSDB.
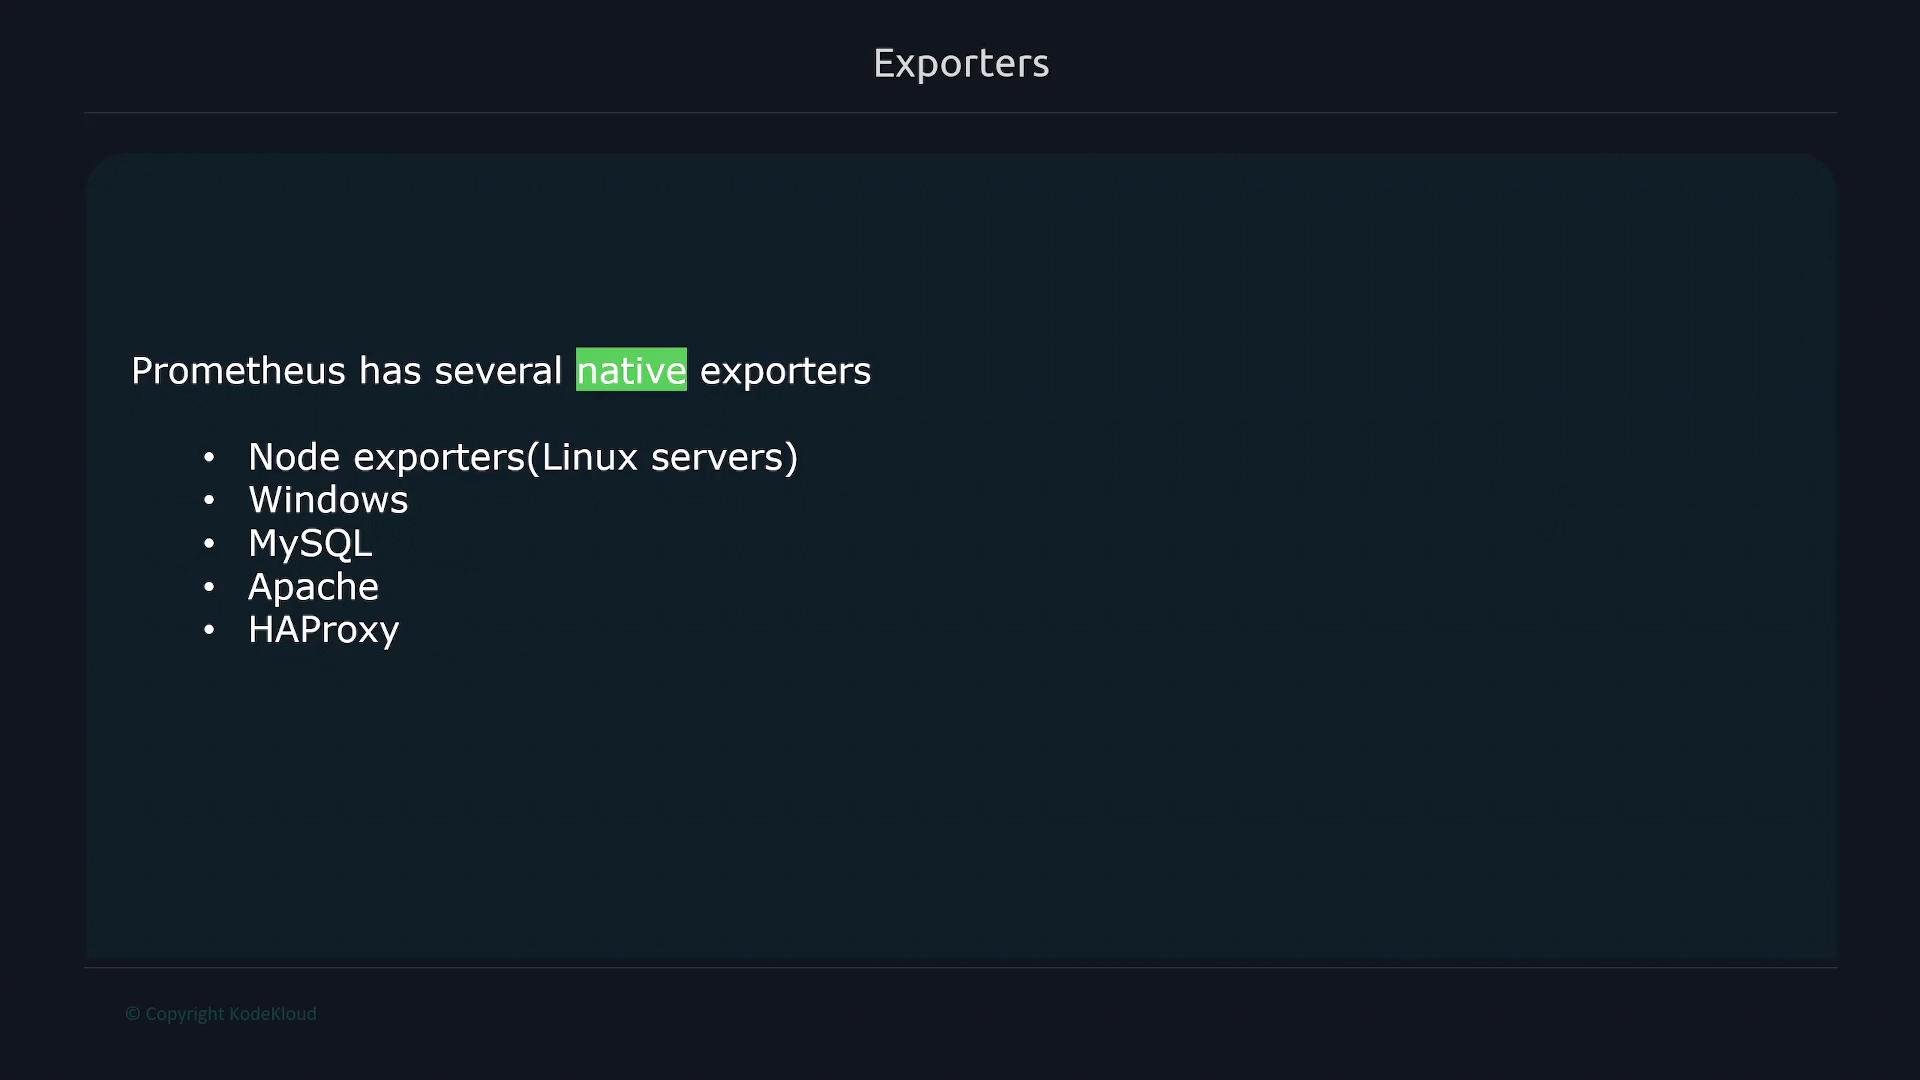
- Node Exporter — Linux system metrics
- Windows exporter — Windows system metrics
- MySQL exporter — MySQL server metrics
- Apache exporter — Apache HTTP Server metrics
- HAProxy exporter — HAProxy metrics
Client libraries
Instrument your applications with Prometheus client libraries to expose custom metrics (error counts, request latency, job durations, etc.). Prometheus provides libraries for multiple languages: Go, Java, Python, Ruby, Rust, and more.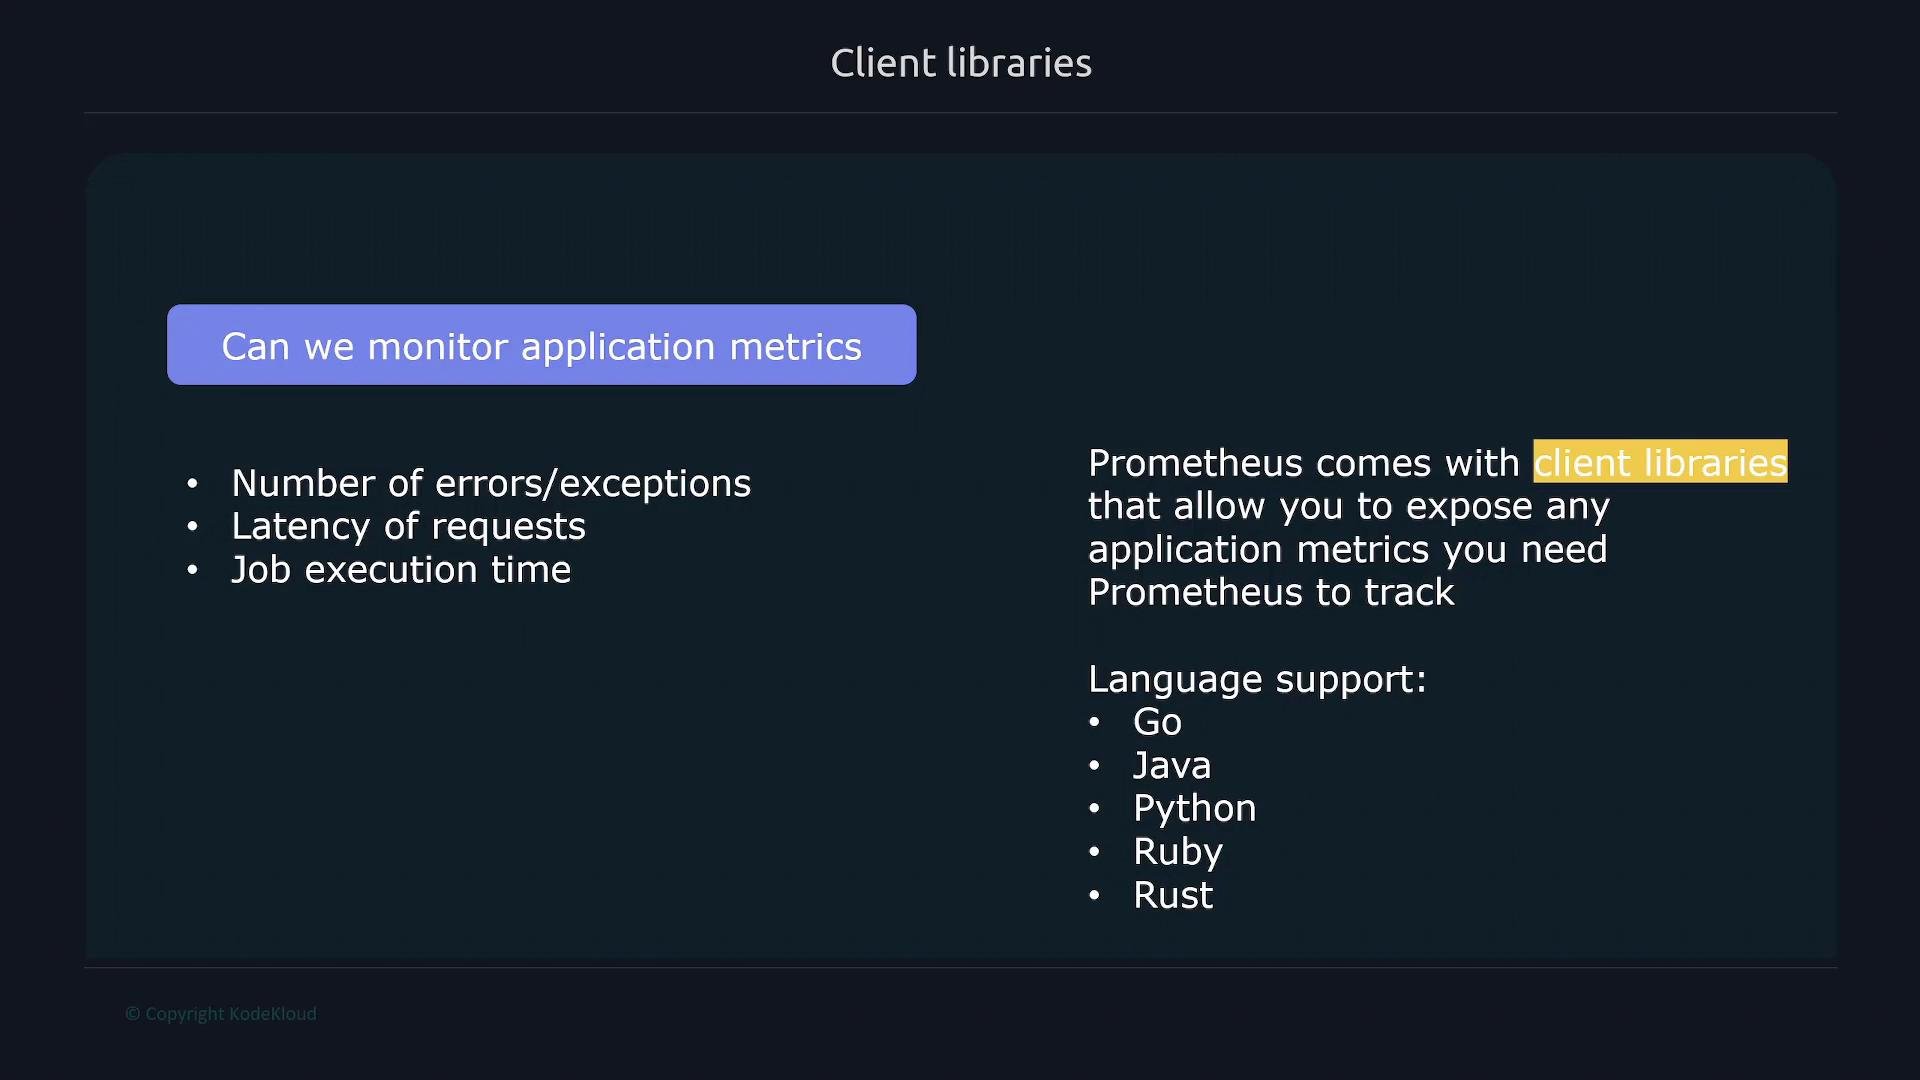
Pull vs. push model
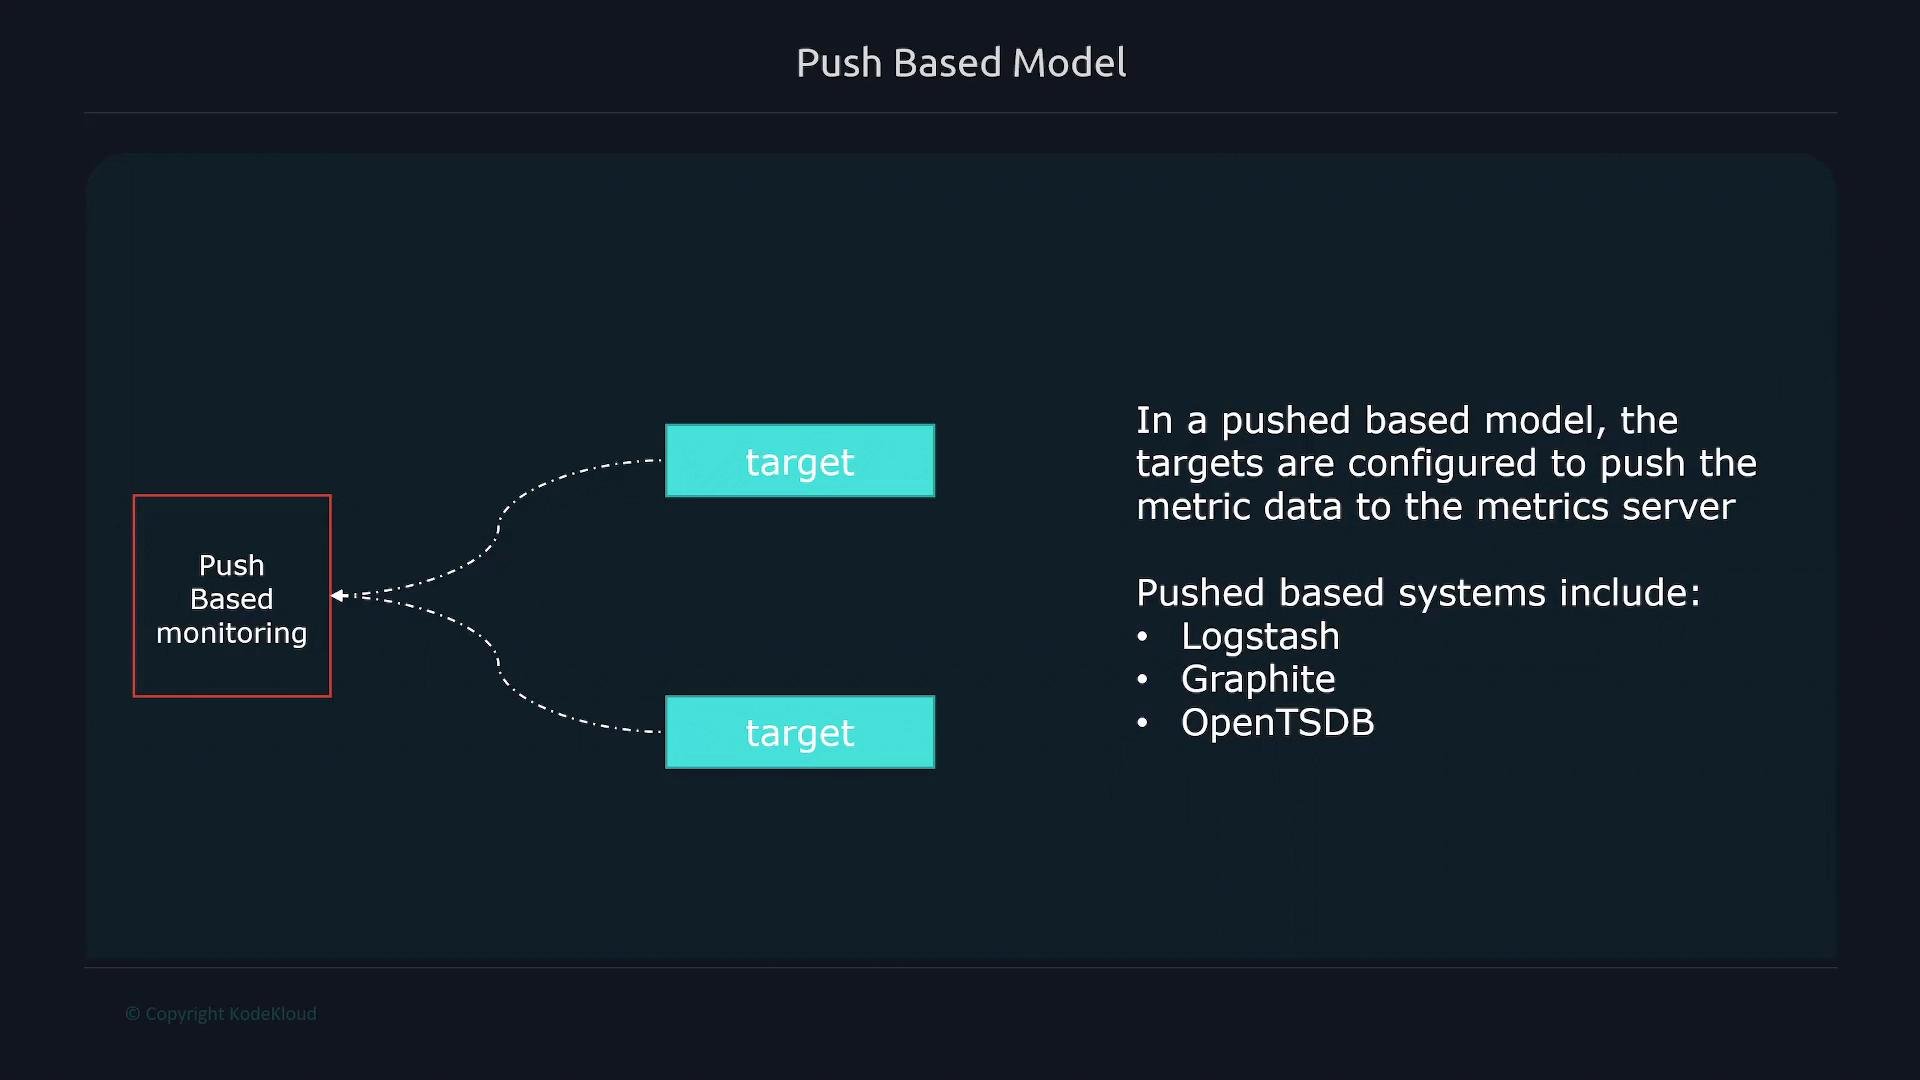
Prometheus uses a pull-based model: it actively scrapes a list of known targets. This has several operational advantages, but there are scenarios where pushing metrics is more appropriate.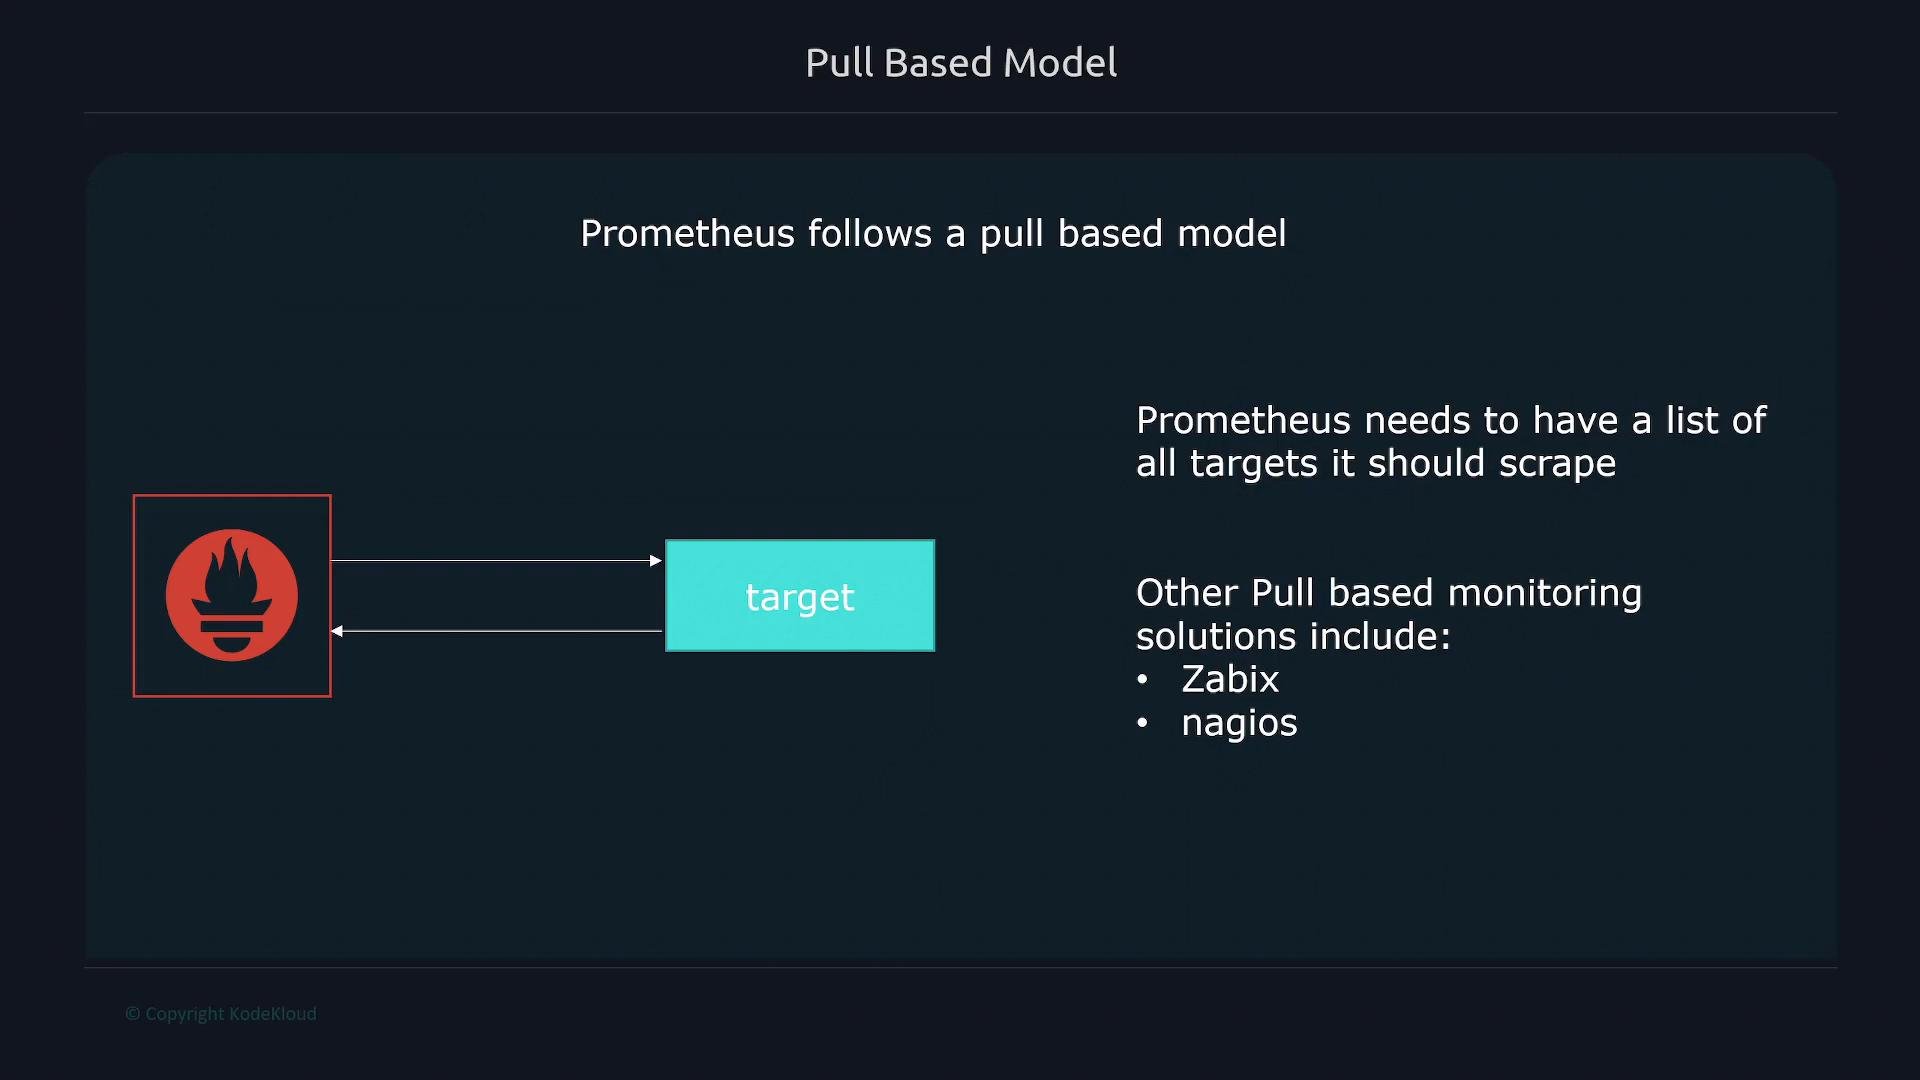
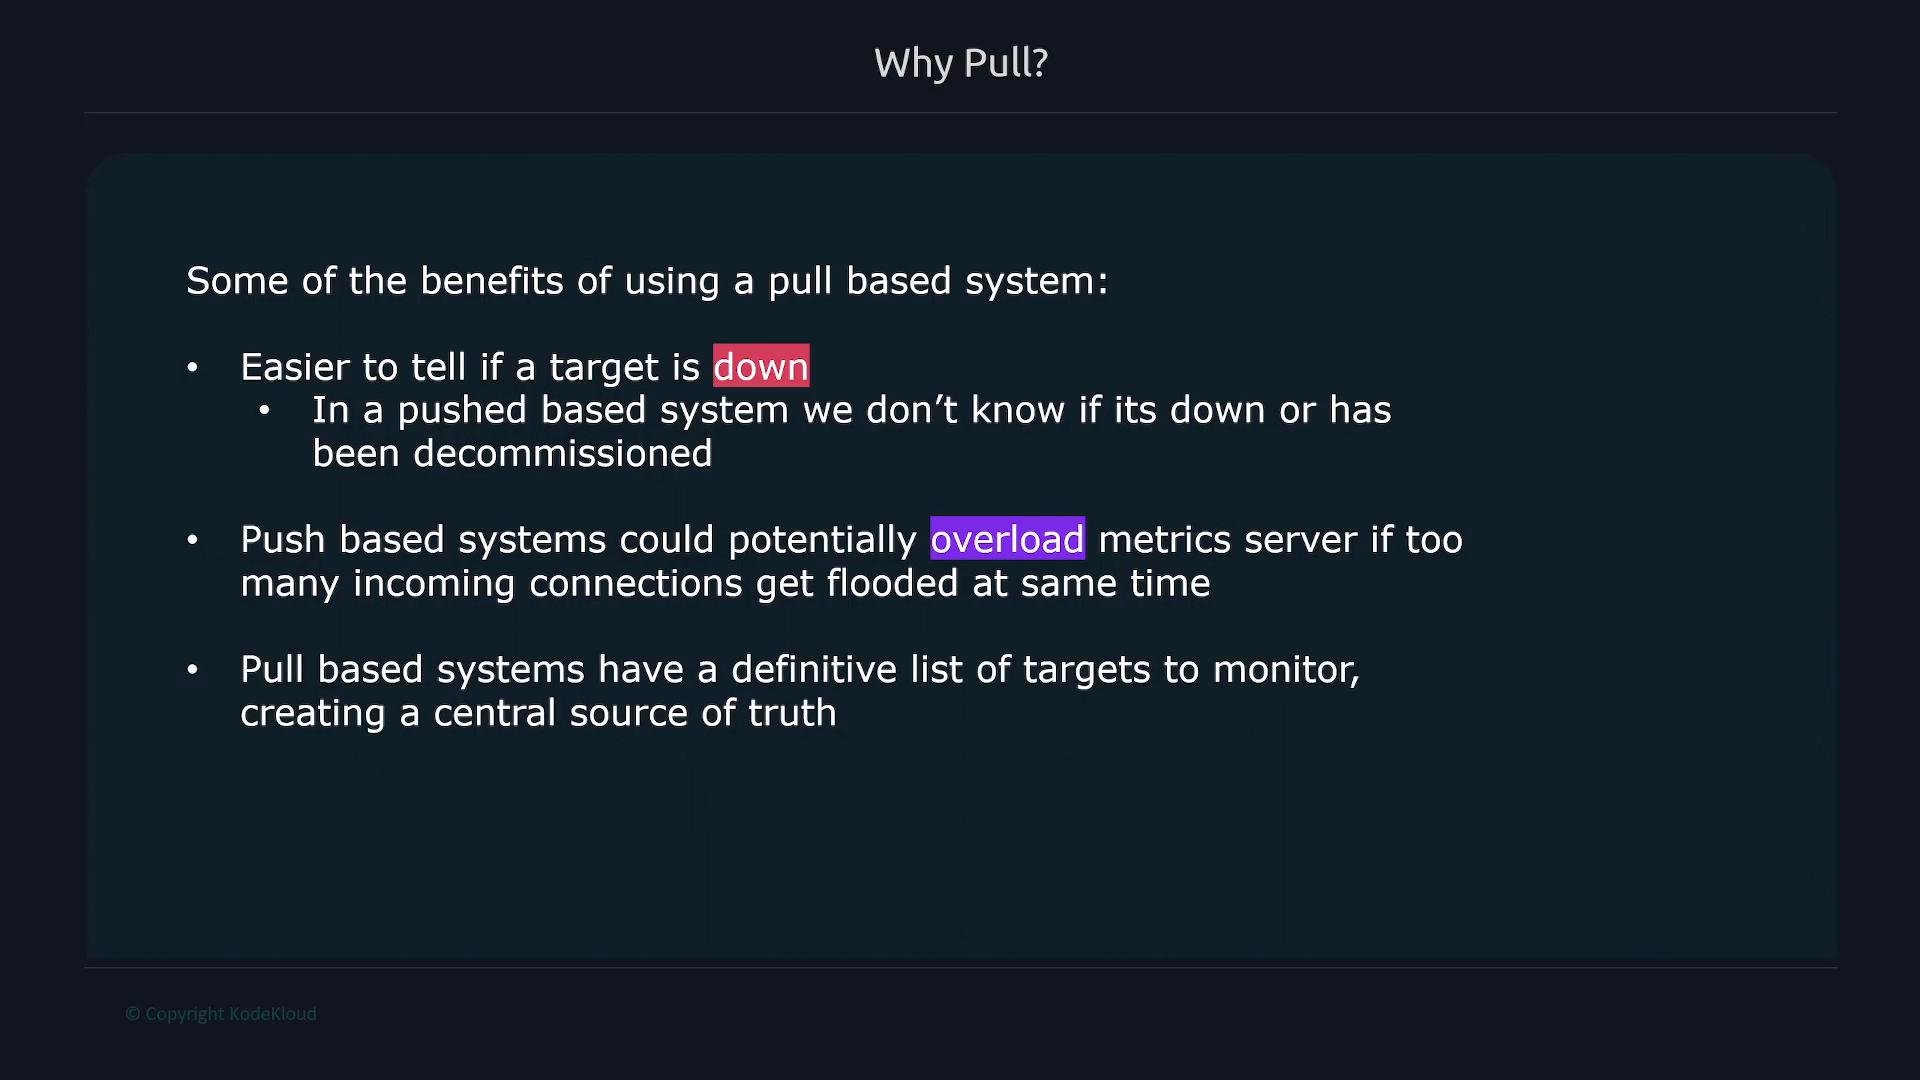
- Easier detection of target failure (no scrape = target likely down).
- Avoids traffic storms where many targets concurrently push to a single server.
- Centralized list of targets simplifies monitoring configuration and control.
When to use push
Push is appropriate for short-lived or event-driven jobs that might finish before Prometheus scrapes them. For these cases, Prometheus provides Pushgateway.Pushgateway should only be used for ephemeral batch jobs. It is not a long-term metrics aggregation service. Pushed metrics can become stale and misrepresent current state if used for long-running services.
- Short-lived job pushes metrics to Pushgateway before exiting.
- Prometheus scrapes the Pushgateway like any other target and captures the metrics.
- See Prometheus guidance on pushing metrics: https://prometheus.io/docs/practices/pushing/
Service discovery
Static target lists are impractical in dynamic environments (Kubernetes, cloud auto-scaling). Prometheus integrates with service discovery mechanisms (Kubernetes, Amazon EC2, Consul, etc.) to automatically discover and update scrape targets. Useful links:- Kubernetes service discovery: https://prometheus.io/docs/prometheus/latest/configuration/configuration/#kubernetes_sd_config
- Amazon EC2 (service discovery): https://learn.kodekloud.com/user/courses/amazon-elastic-compute-cloud-ec2
- Consul: https://learn.kodekloud.com/user/courses/hashicorp-certified-consul-associate-certification
Alerting and Alertmanager
Prometheus evaluates alerting rules and generates alerts, but does not send notifications itself. Alerts are sent to Alertmanager, which handles routing, deduplication, grouping, silencing, and delivering notifications (Slack, email, PagerDuty, etc.). Alertmanager docs: https://prometheus.io/docs/alerting/latest/alertmanager/Querying and visualization
- Query the TSDB with PromQL through the Prometheus HTTP API or the built-in web UI.
- For dashboards and advanced visualizations, Grafana is the common front-end that queries Prometheus.
Quick reference tables
Summary
- Prometheus server = scraper + TSDB + HTTP API (PromQL).
- Exporters and client libraries make systems and applications consumable by Prometheus.
- Pull model centralizes target management and simplifies failure detection.
- Pushgateway solves short-lived job scraping gaps — but use it only for ephemeral metrics.
- Alertmanager handles notification routing and silencing of alerts.
- Service discovery keeps Prometheus aware of dynamic targets in environments like Kubernetes and cloud providers.
- Prometheus documentation: https://prometheus.io/docs/
- Prometheus alerting: https://prometheus.io/docs/alerting/latest/
- Push practices: https://prometheus.io/docs/practices/pushing/
- Zabbix: https://www.zabbix.com/
- Nagios: https://www.nagios.org/
- Graphite: https://graphiteapp.org/
- OpenTSDB: https://opentsdb.net/