Self-hosted runners let you run GitHub Actions on your own infrastructure, but they can fail due to configuration, connectivity, or environment issues. In this guide, we’ll walk through:
  1. Checking runner status in the GitHub UI
  2. Diagnosing network connectivity
  3. Reviewing runner application logs
  4. Monitoring via systemd and journalctl
  5. Triggering and tracking workflows
  6. Updating runners and verifying Docker availability
For more details, visit GitHub’s official docs on Monitoring self-hosted runners.

1. Checking Runner Status in the GitHub UI

Navigate to Settings > Actions > Runners in your repository (or organization) to see all self-hosted runners, their labels, and their status:
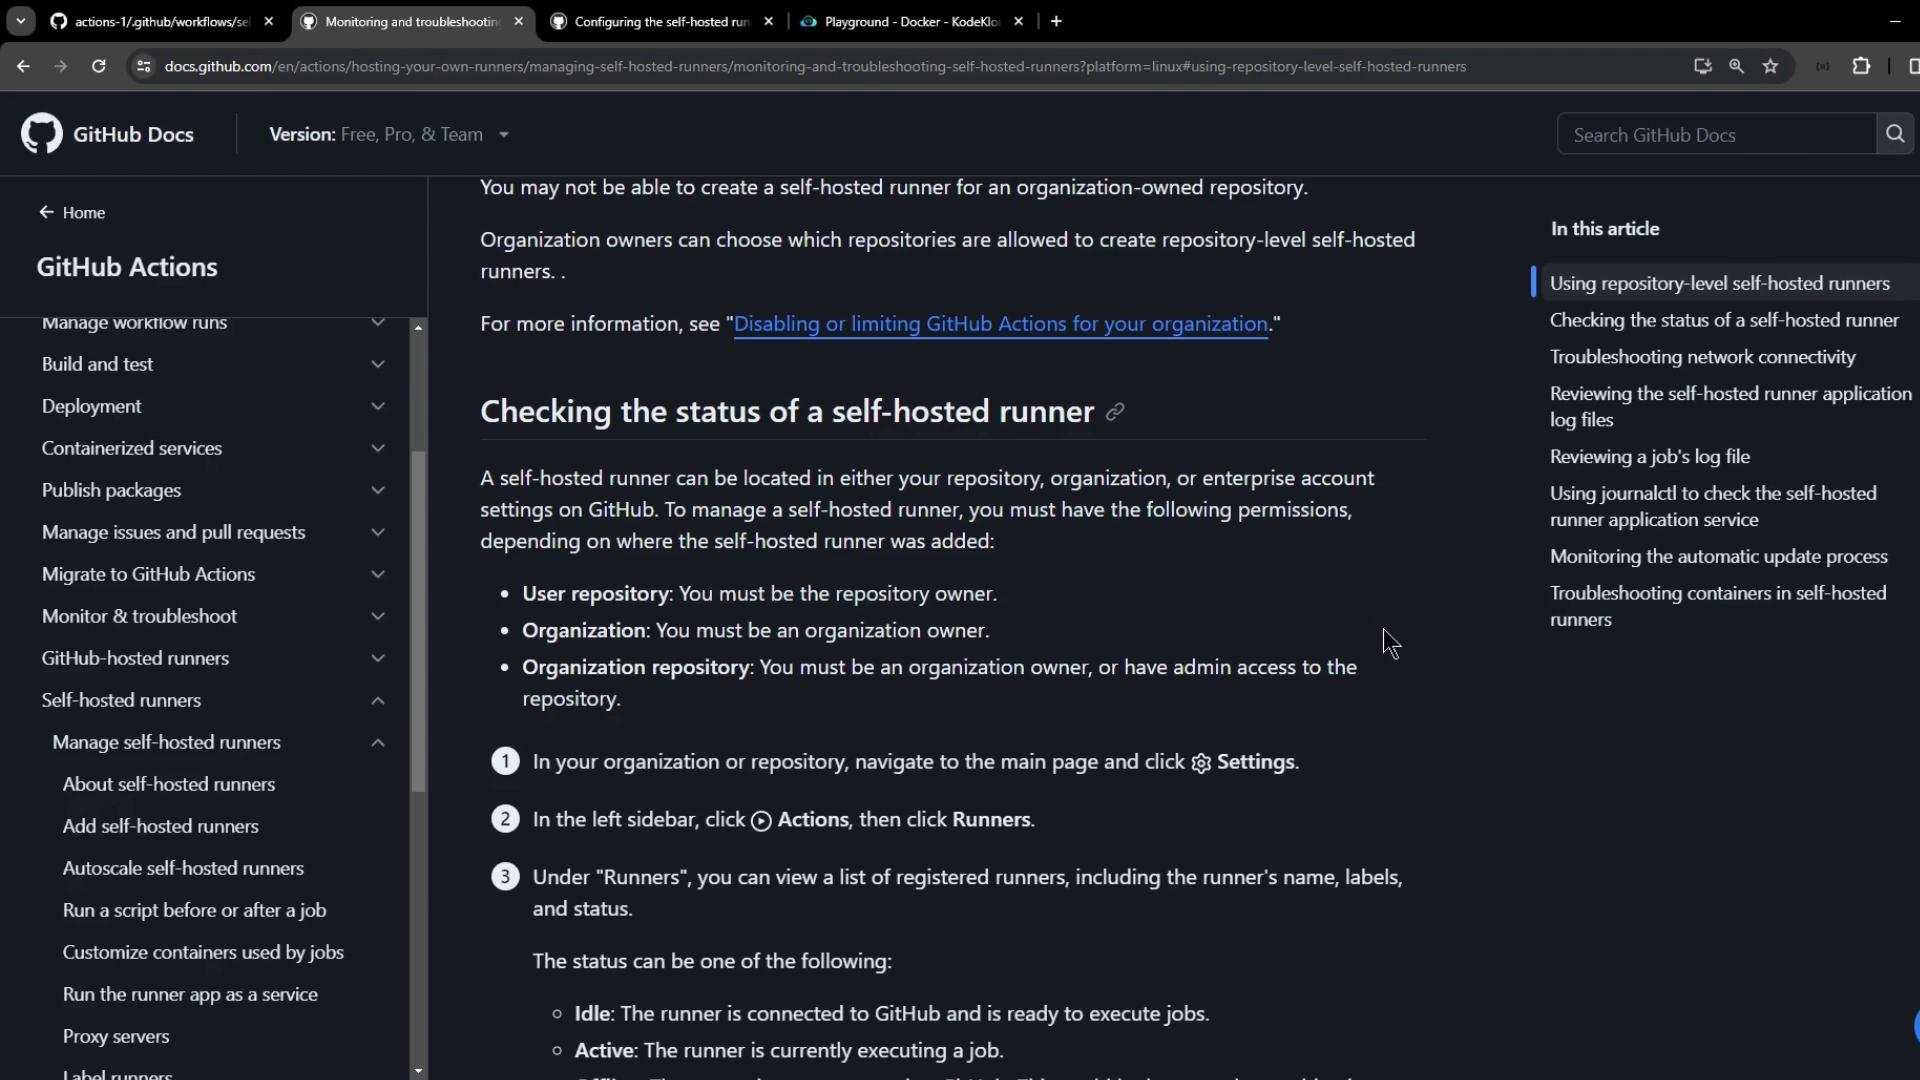
The image shows a GitHub documentation page about managing self-hosted runners, specifically focusing on checking the status of a self-hosted runner. It includes navigation instructions and status descriptions for the runners.
Example workflow using a self-hosted Linux runner labeled prod:
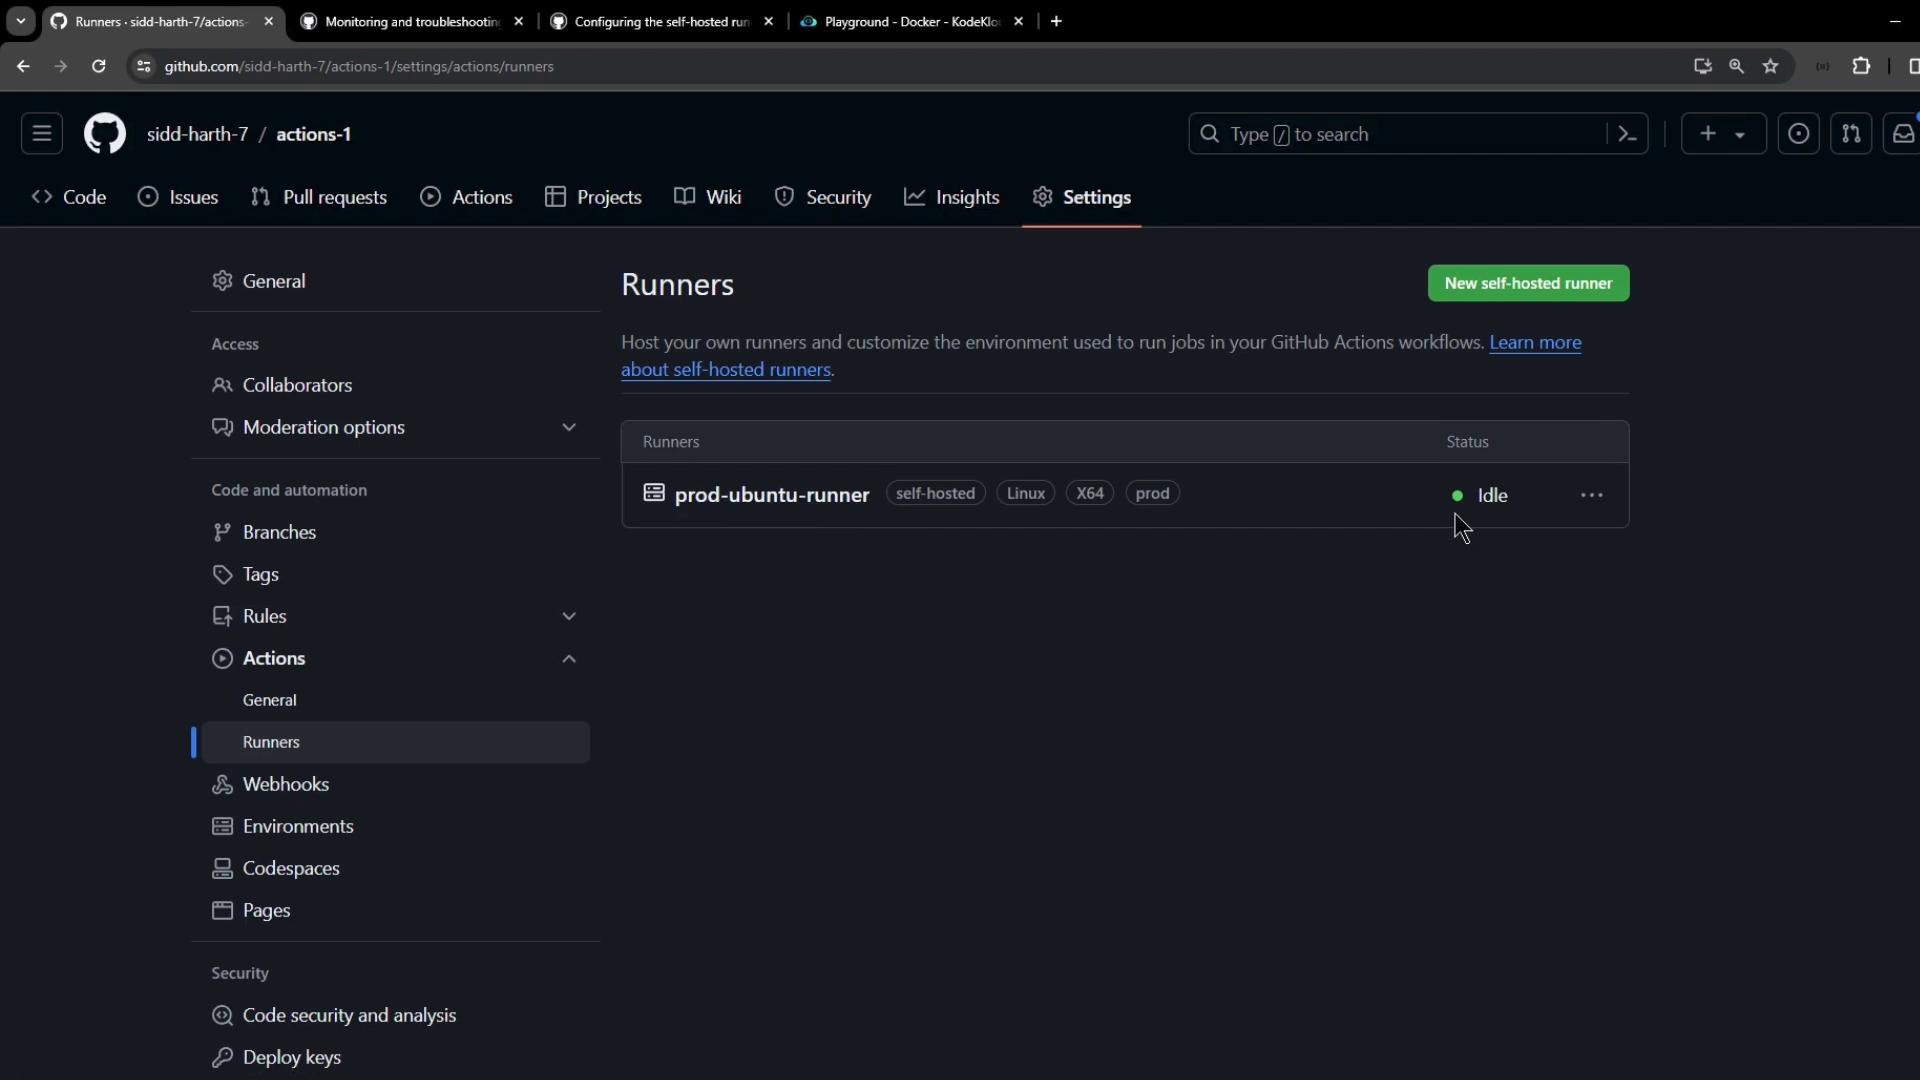
After dispatching, the runner appears as Active under Settings:
The image shows a GitHub settings page for a repository, specifically the "Runners" section under "Actions," displaying a self-hosted runner named "prod-ubuntu-runner" with an idle status.

2. Diagnosing Network Connectivity

The runner provides run.sh with a --check flag to verify connectivity to GitHub services. Run:
Generate a classic personal access token with the workflow scope under Settings > Developer settings > Personal access tokens.
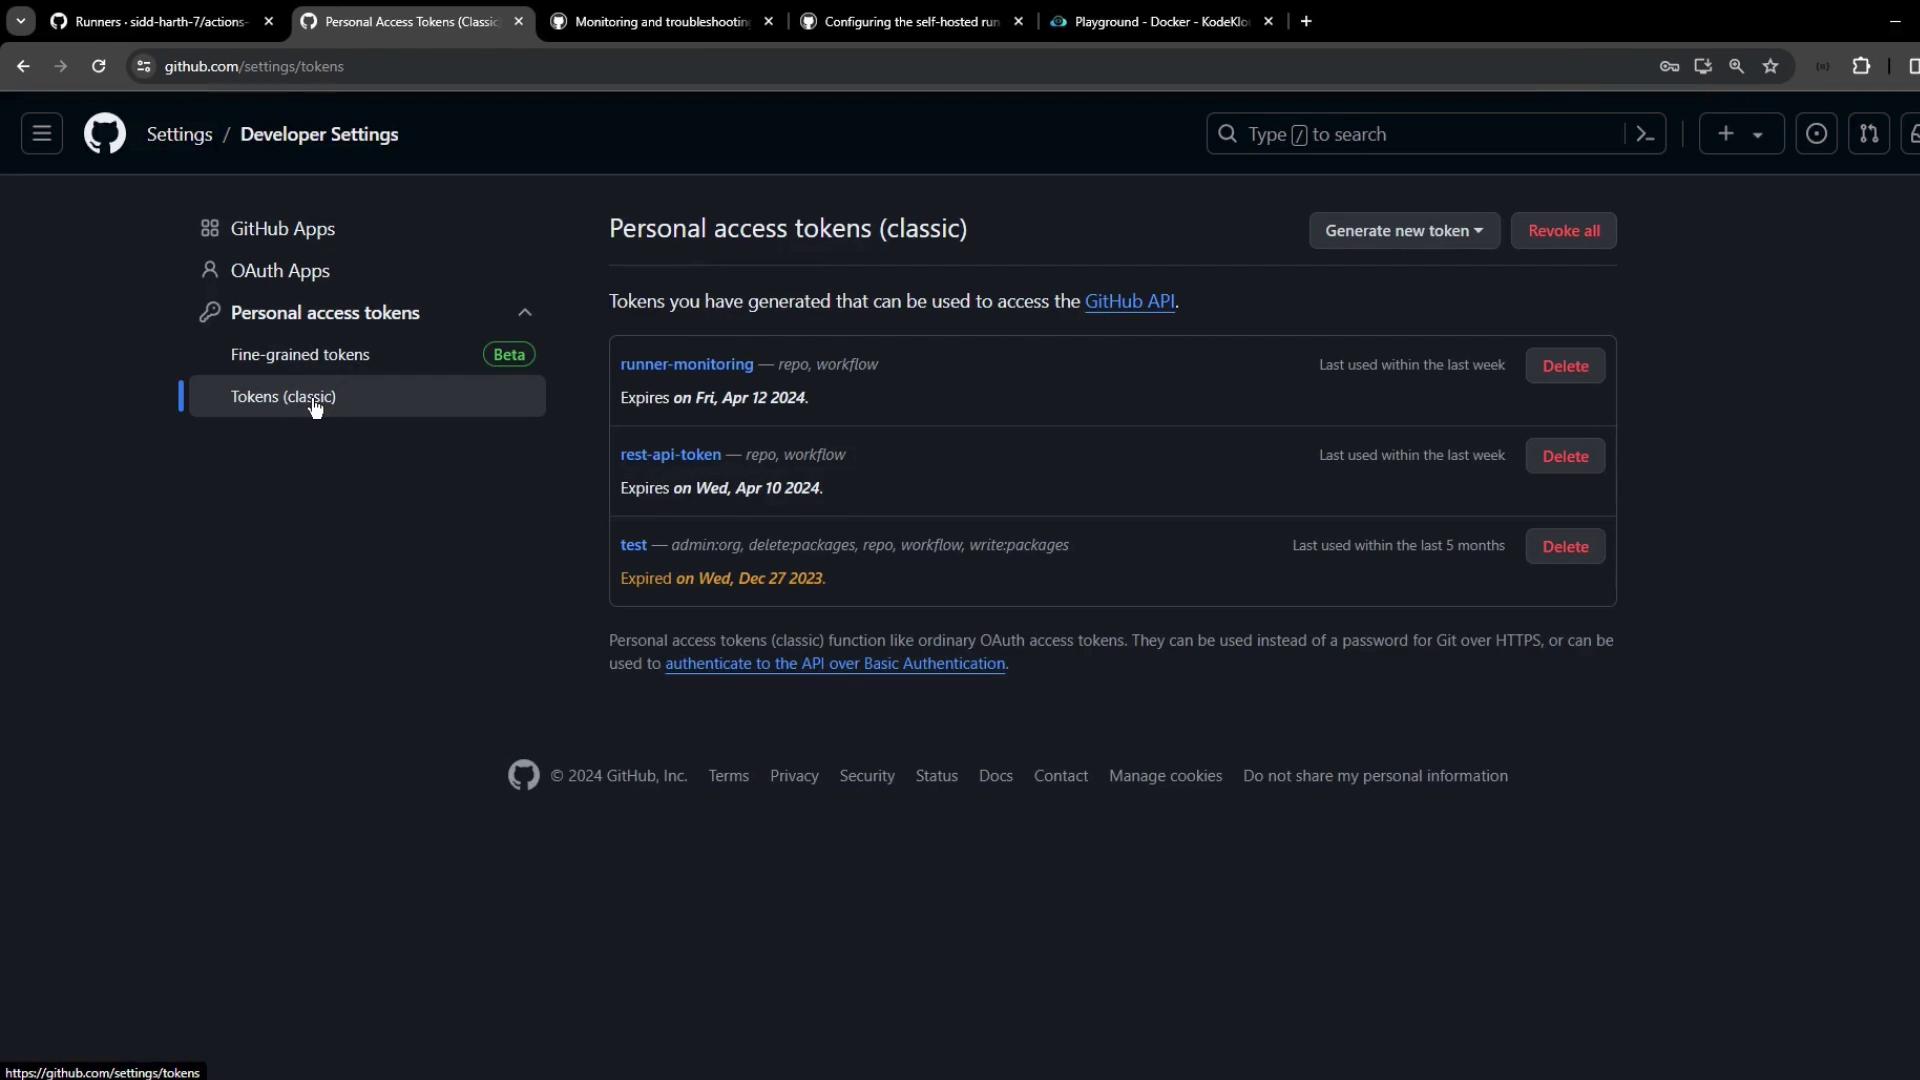
The image shows a GitHub settings page for managing personal access tokens, listing several tokens with their expiration dates and usage details.
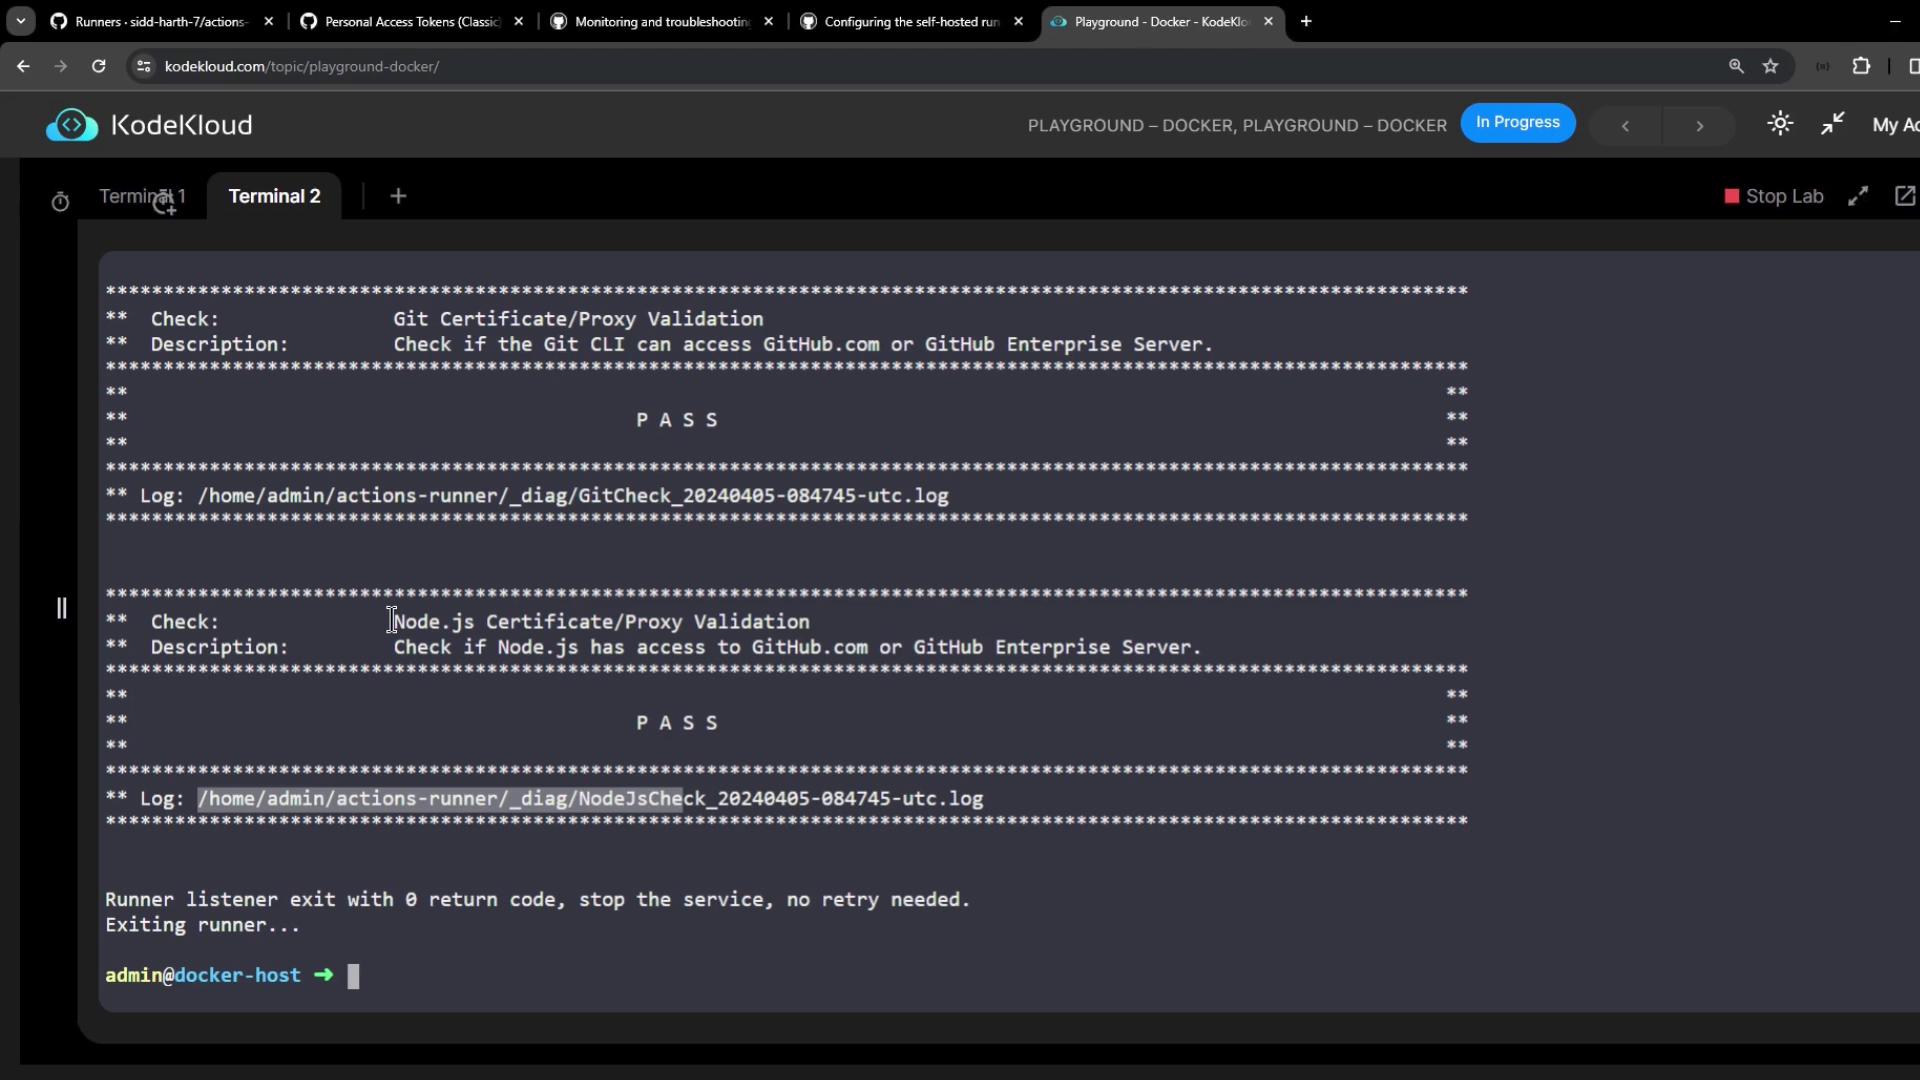
Successful checks look like:
The image shows a terminal window with logs indicating successful Git and Node.js certificate/proxy validation checks. The checks have passed, and the runner listener has exited with a return code of 0.
If any test fails, inspect the _diag log:
Disabling TLS verification reduces security. Use only for temporary troubleshooting:

3. Reviewing Runner Application Logs

All runner logs reside in the _diag directory of your runner installation:
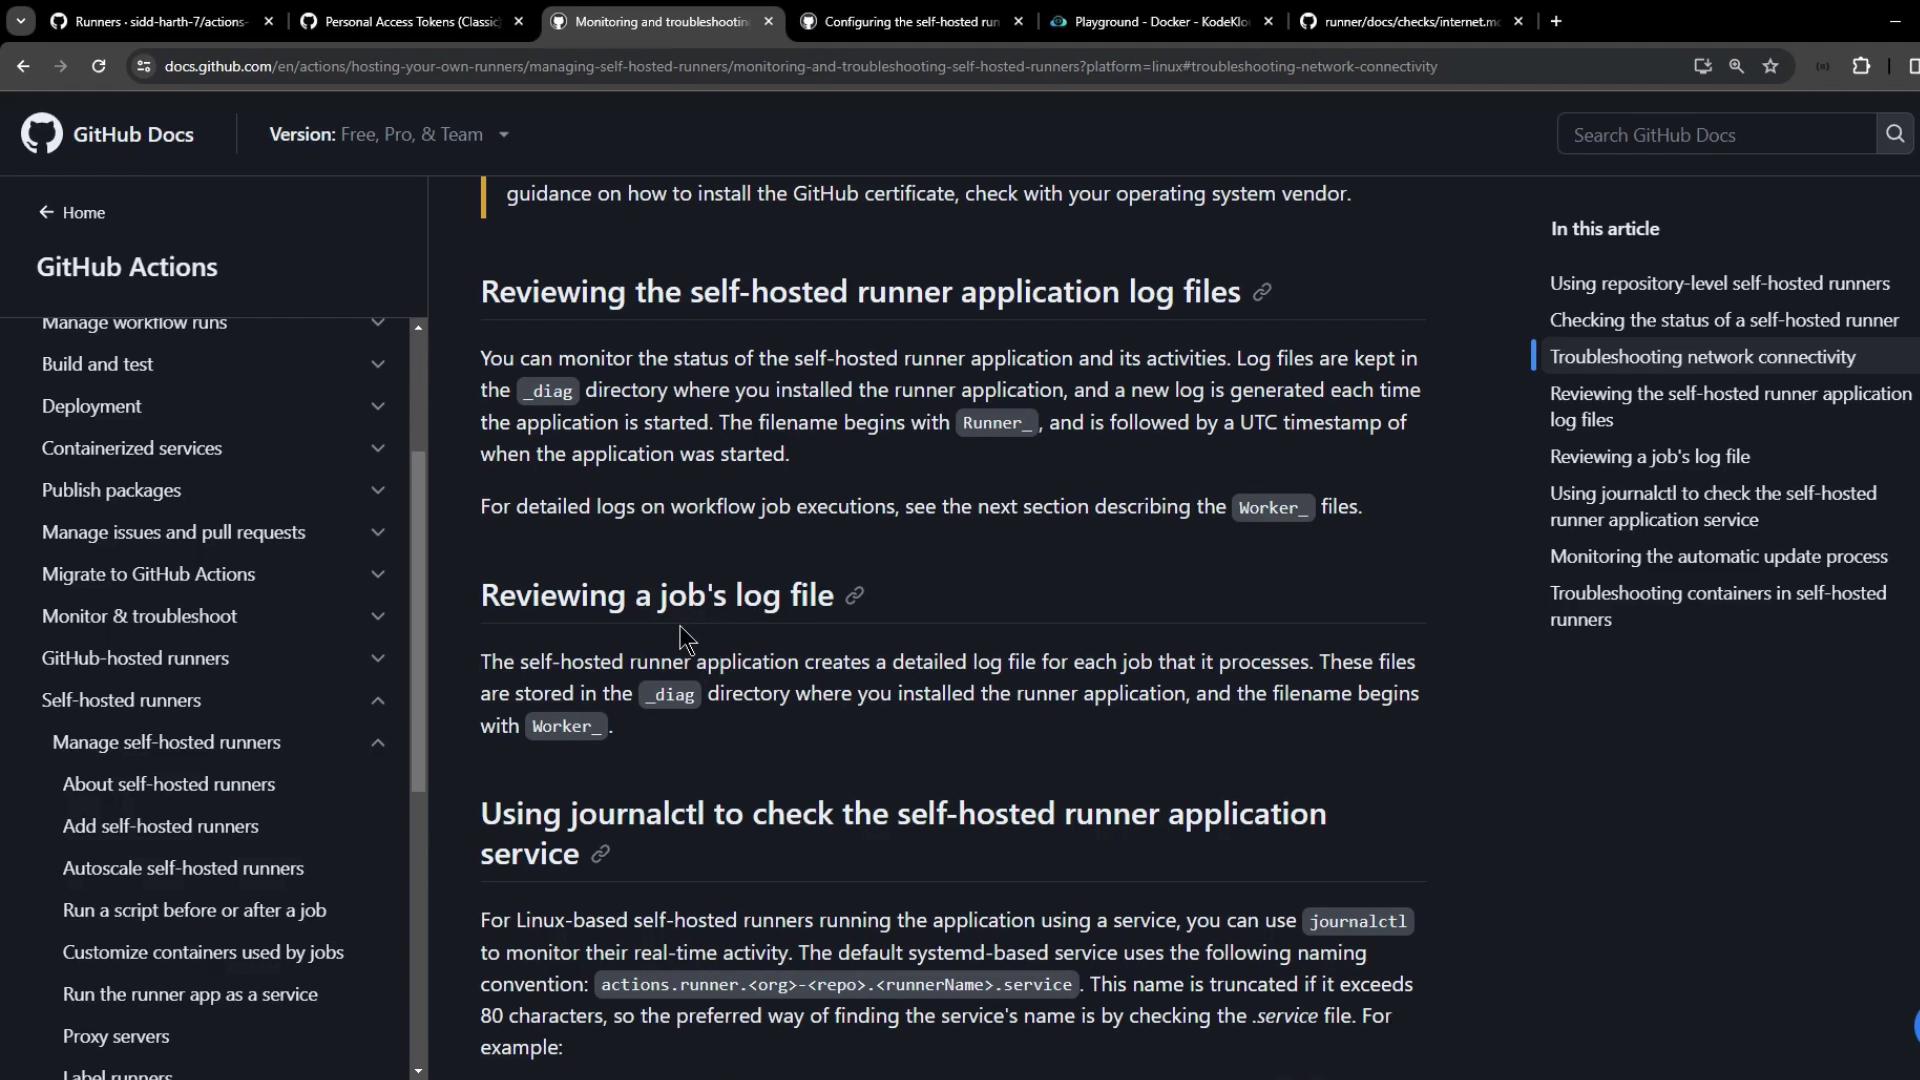
Refer to GitHub’s self-hosted runner logs documentation for file descriptions.
The image shows a GitHub documentation page about managing self-hosted runners, specifically focusing on reviewing application log files and using journalctl for monitoring. The sidebar lists various related topics under GitHub Actions.

4. Monitoring via systemd and journalctl (Linux)

When installed as a service, manage and view logs using systemctl and journalctl. The service name follows:
Install and start:
Verify status:
Stream real-time logs:
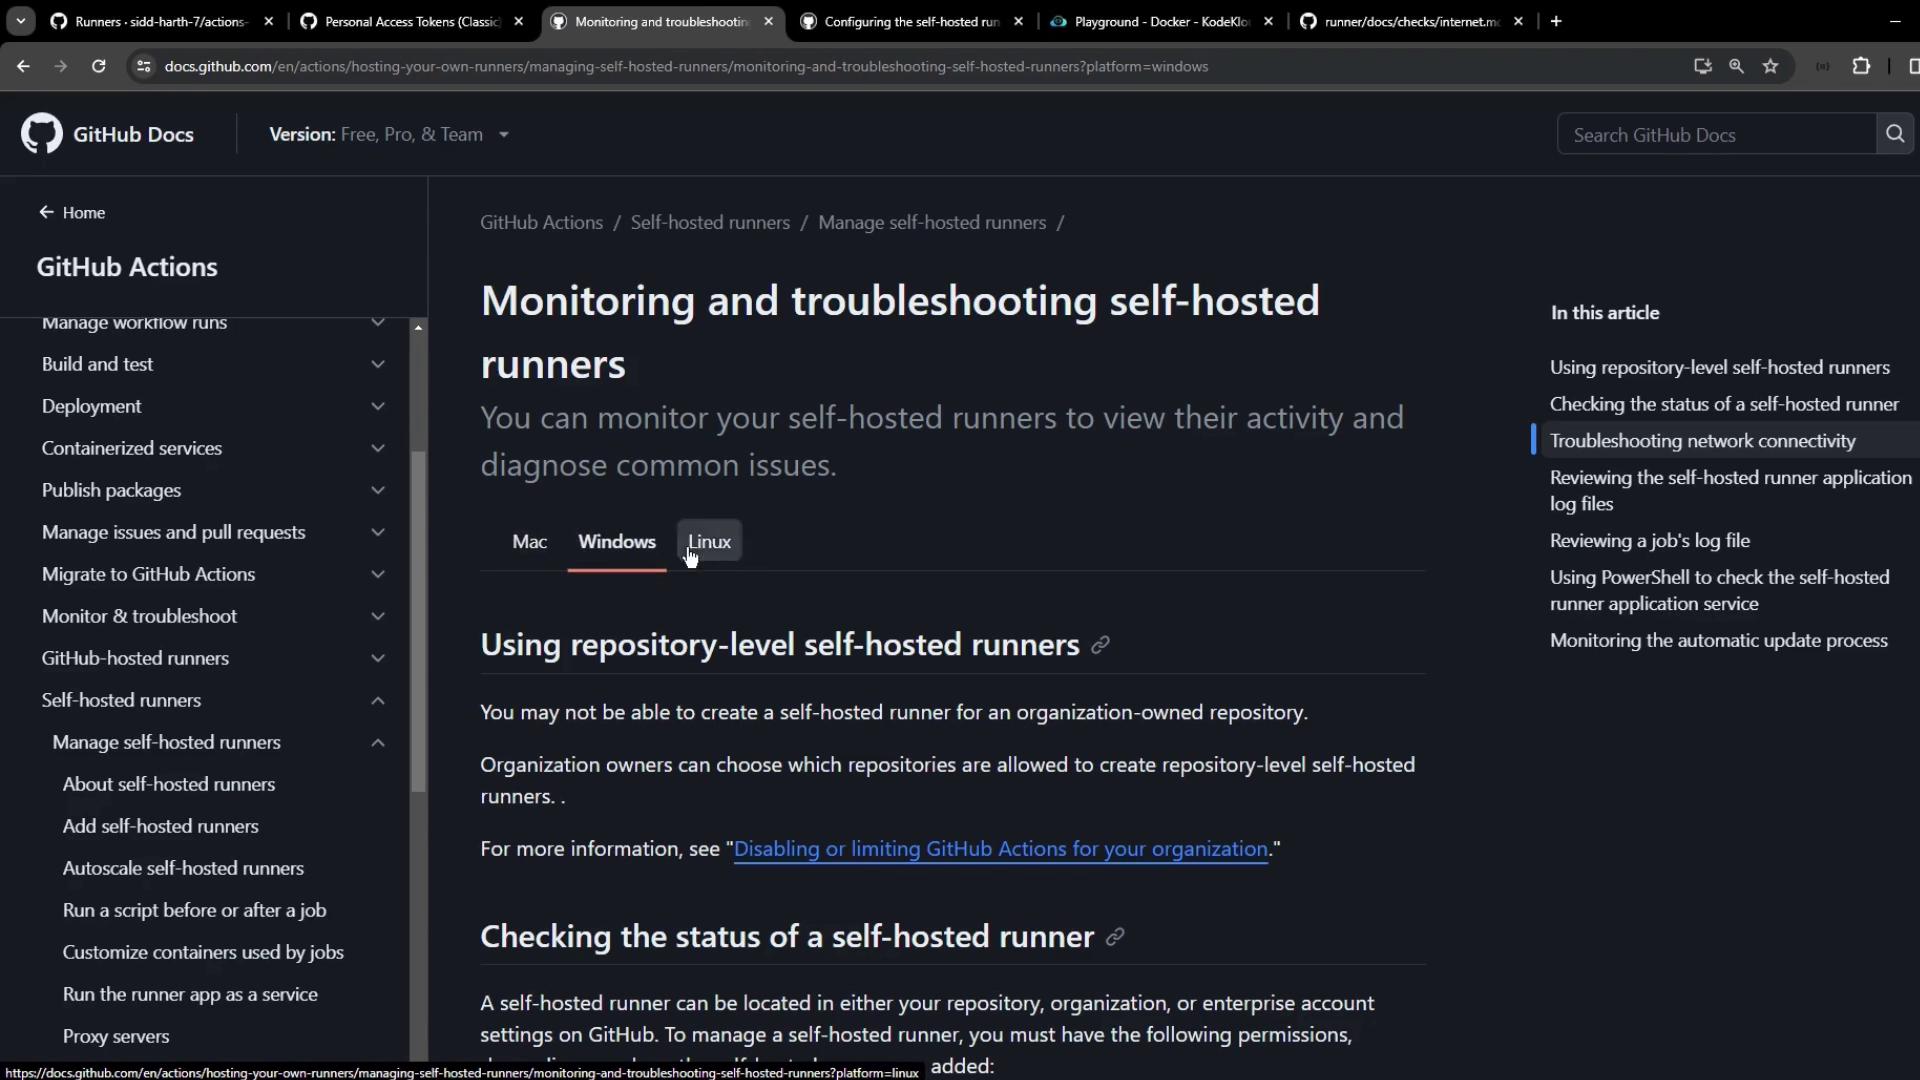
The image shows a GitHub documentation page about monitoring and troubleshooting self-hosted runners, with navigation options for different operating systems and a sidebar with related topics.
Example log output:

5. Triggering and Tracking a Workflow

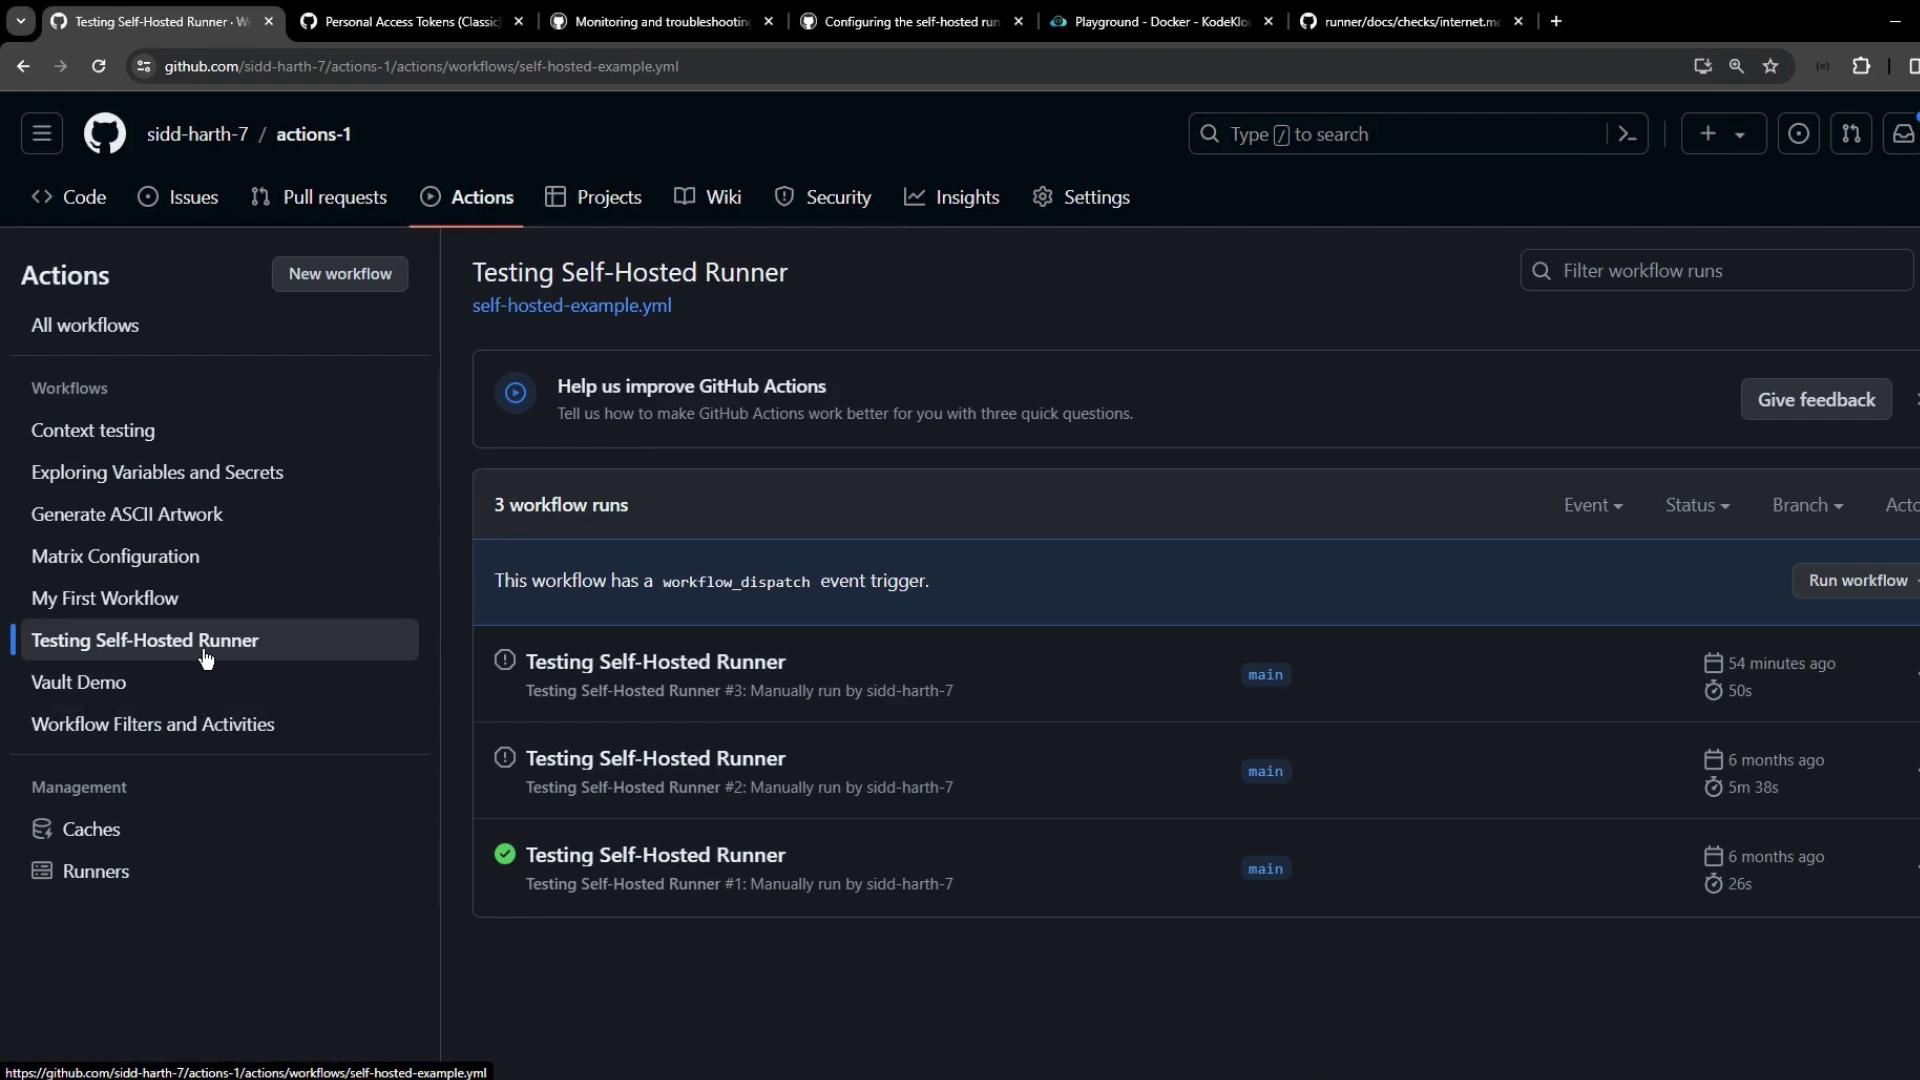
Dispatch your workflow (workflow_dispatch) and watch both the service logs and GitHub Actions UI. In the Actions tab, monitor status, duration, and logs:
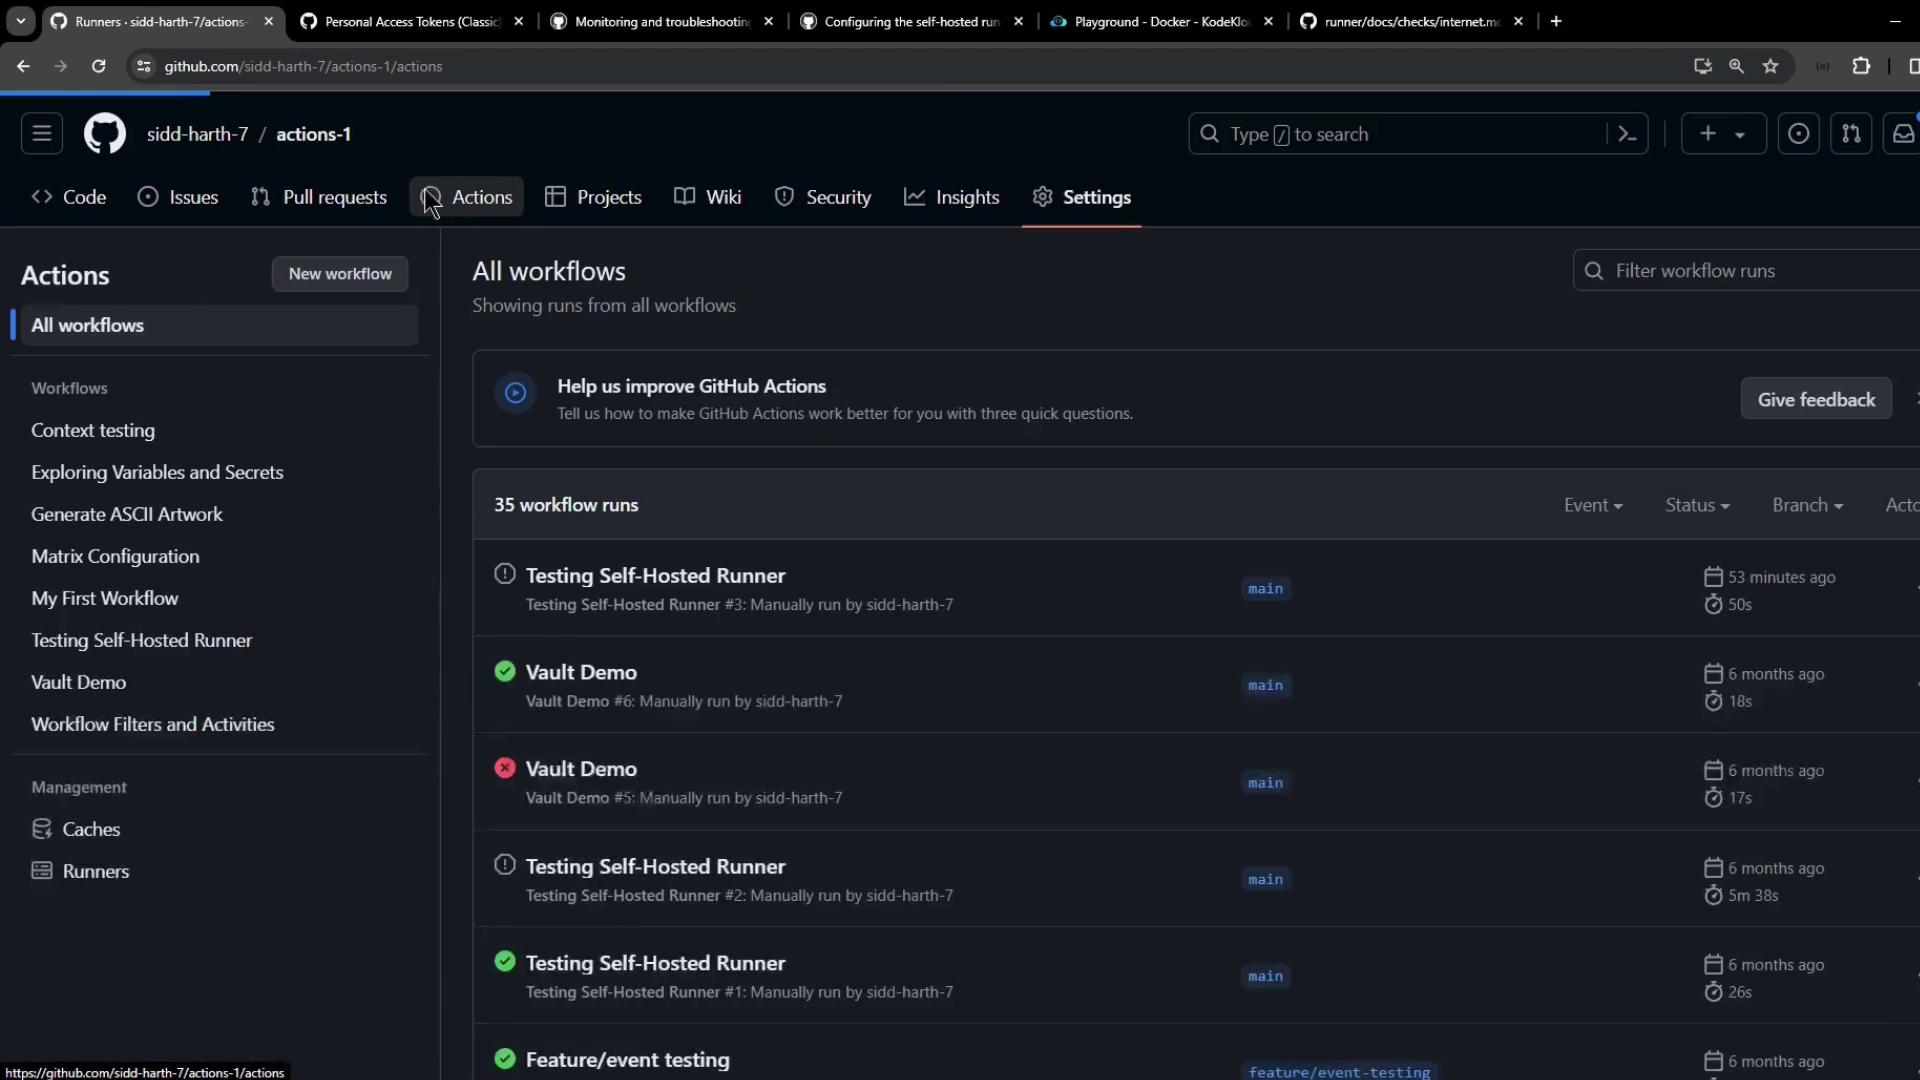
The image shows a GitHub Actions interface displaying a list of workflow runs, including their status, branch, and execution time.
When running, service logs will indicate job execution:
The image shows a GitHub Actions interface with a workflow titled "Testing Self-Hosted Runner" and a list of workflow runs. The sidebar displays various workflow options and management tools.

6. Updating Runners and Verifying Docker

Keep your runner and Docker up-to-date to avoid unexpected failures:
If Docker is not found, container actions will fail:
Install Docker with official instructions.

Watch Video