Let’s focus on the Data Scientist persona and how their day-to-day activities map to tooling and managed ML platform features like Amazon SageMaker.

Data exploration and interactive analysis

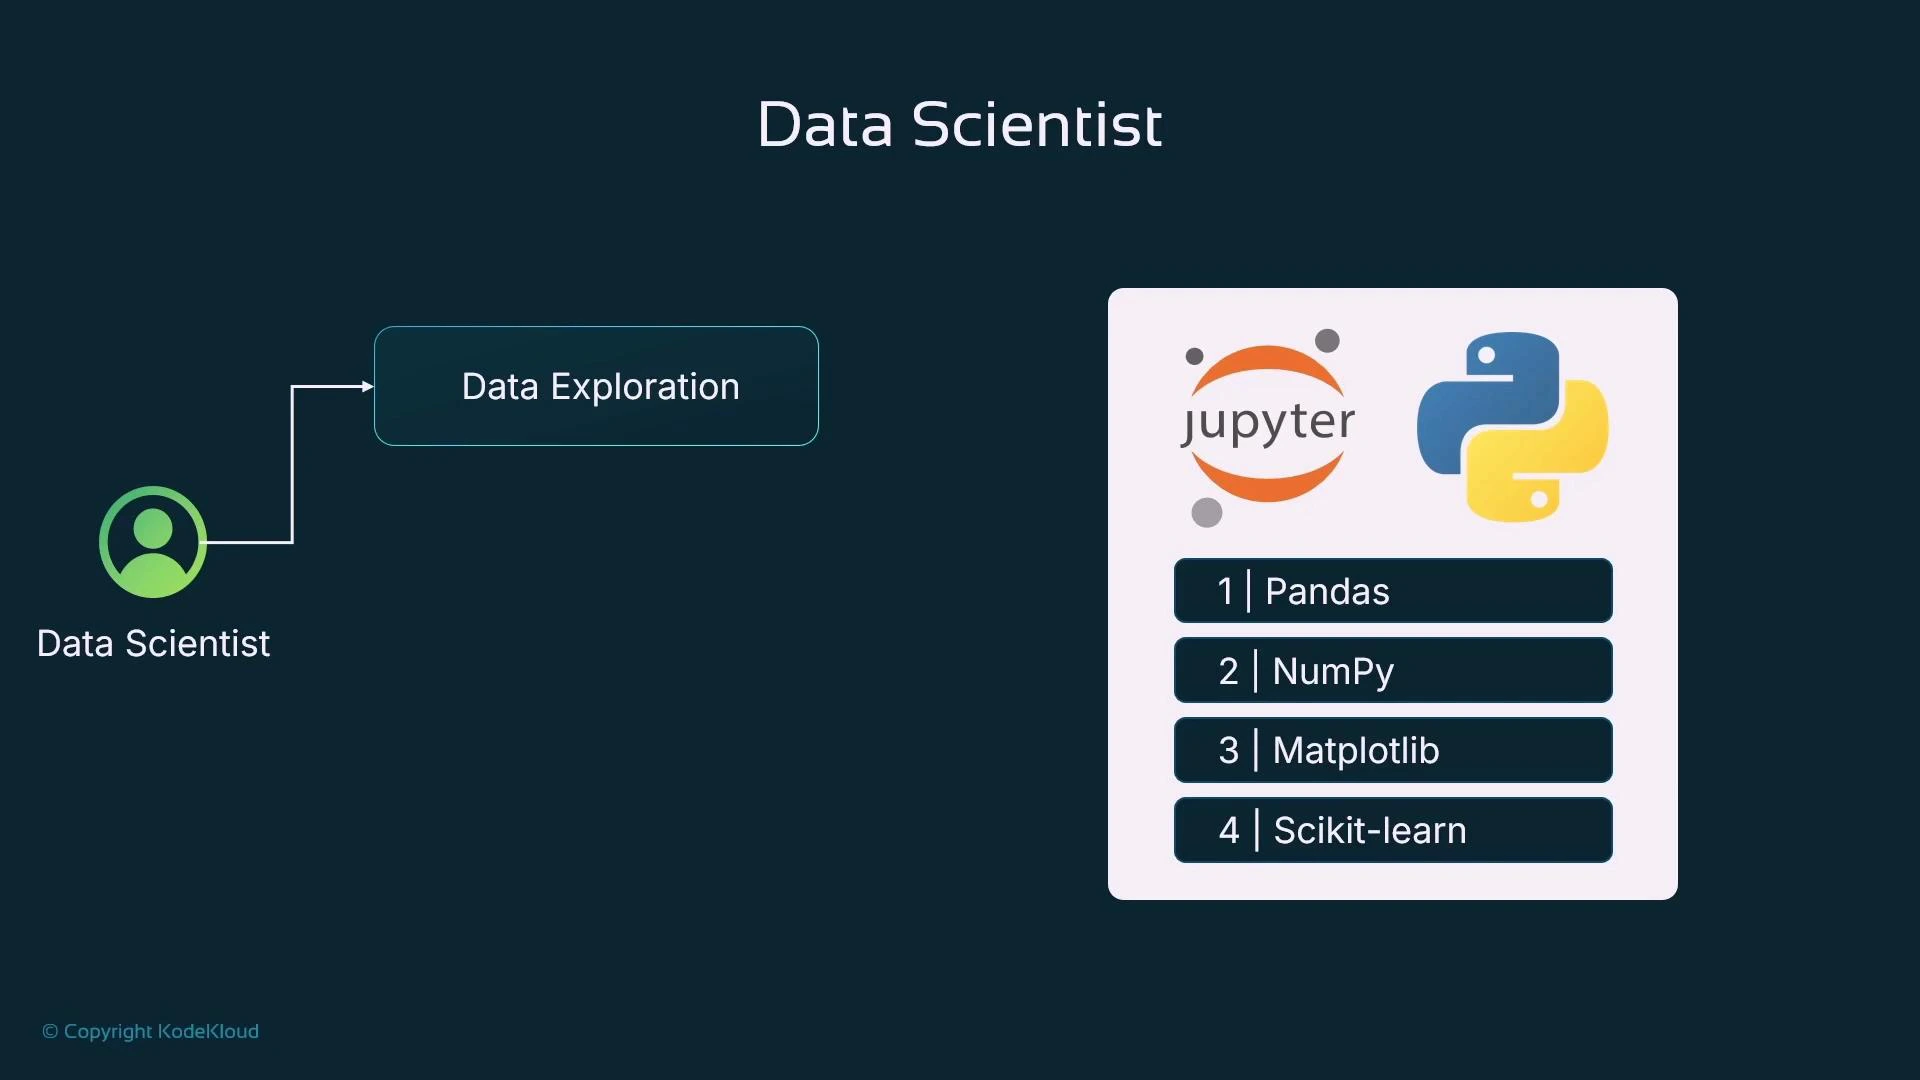
Data scientists start by getting to know the dataset: understand features and targets, spot correlations and outliers, and identify columns to drop. This phase is highly interactive — you run small code cells, inspect outputs, create visualizations, and document reasoning for reproducibility. Jupyter Notebooks or JupyterLab are the default environment for this iterative workflow: run Python cells, visualize inline, and annotate with Markdown to capture findings that can be shared or re-run.
The slide titled "Data Scientist" shows a user icon connected to a "Data Exploration" box, which leads to three tasks: analyzes dataset, visualizes data, and identifies useful features. Each task is shown as a colored horizontal bar with a small icon on a dark background.
Typical exploration workflow:
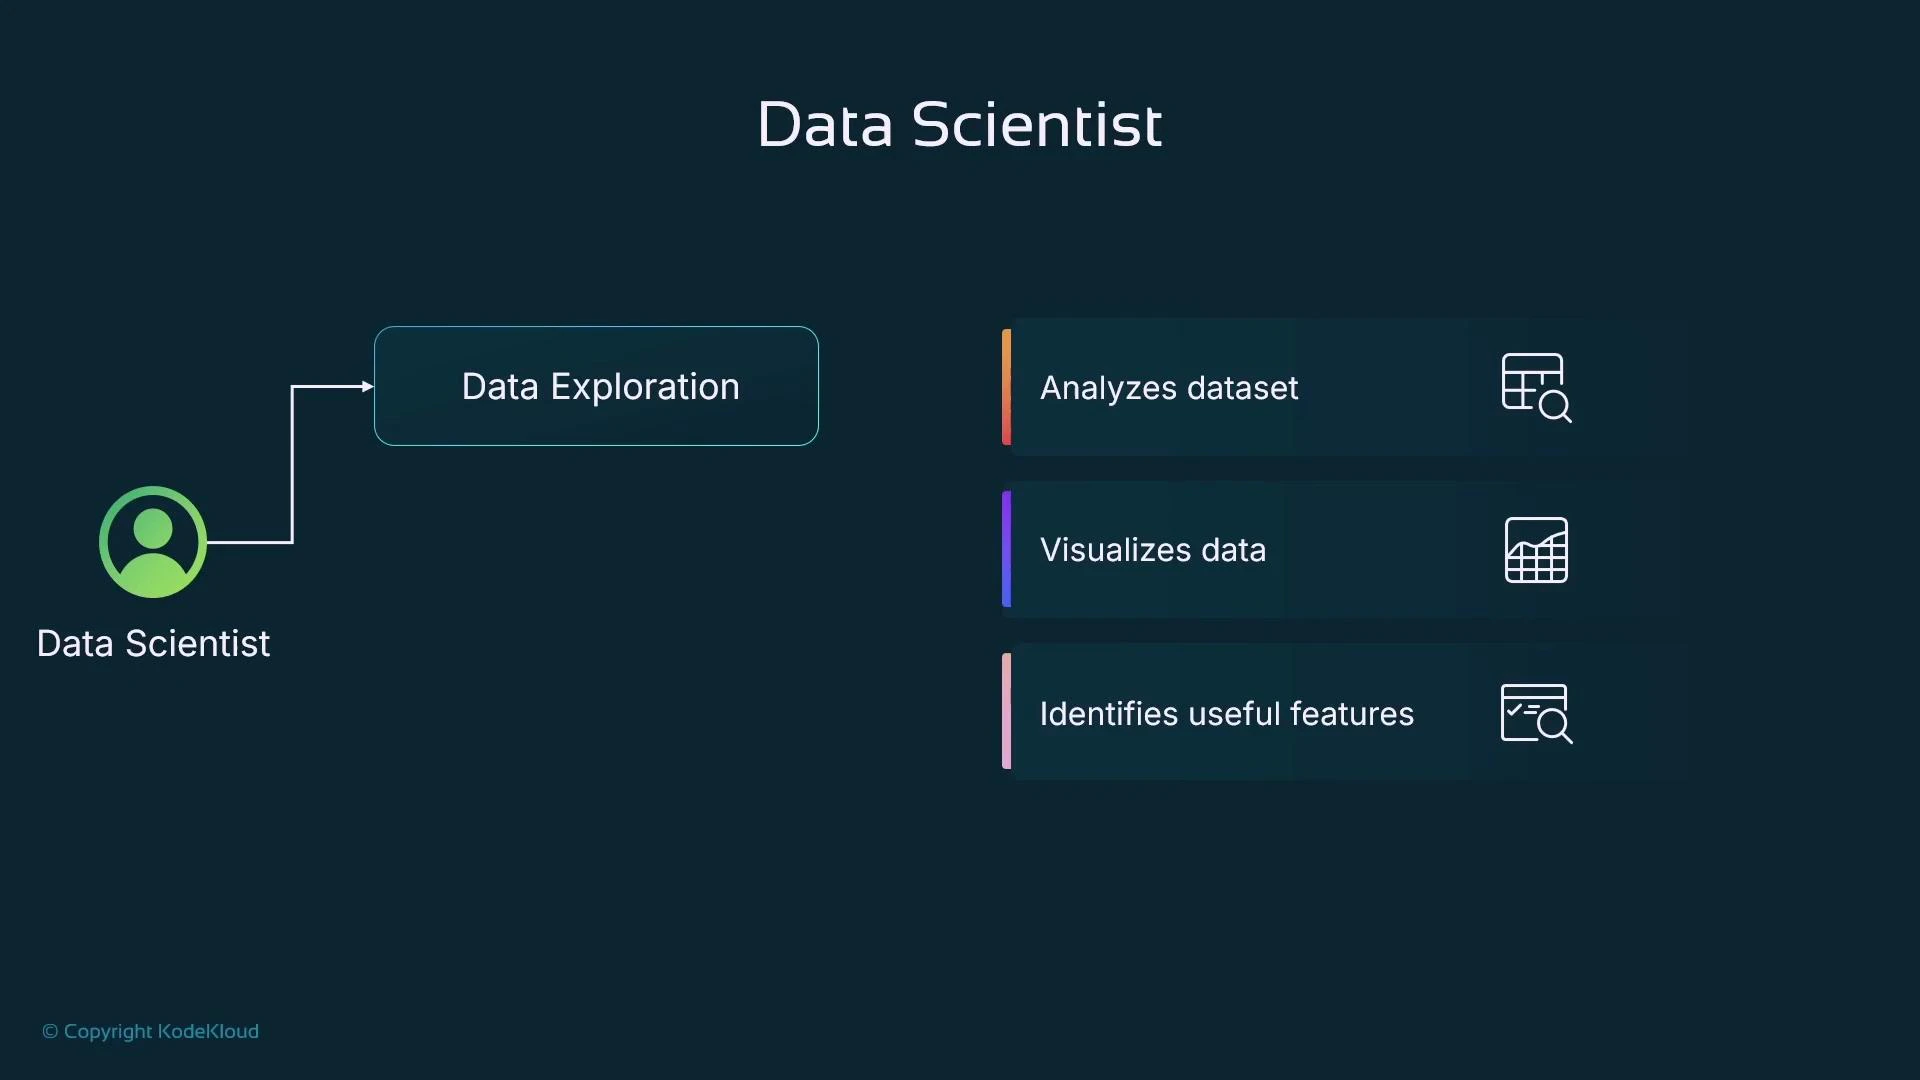
  • Load tabular data into a pandas DataFrame for inspection and manipulation.
  • Use NumPy for fast vectorized numerical ops when required.
  • Visualize distributions, correlations, and model diagnostics with Matplotlib/Seaborn.
  • Use scikit-learn for quick baseline models and common preprocessing (imputation, scaling, encoding) to validate ideas.
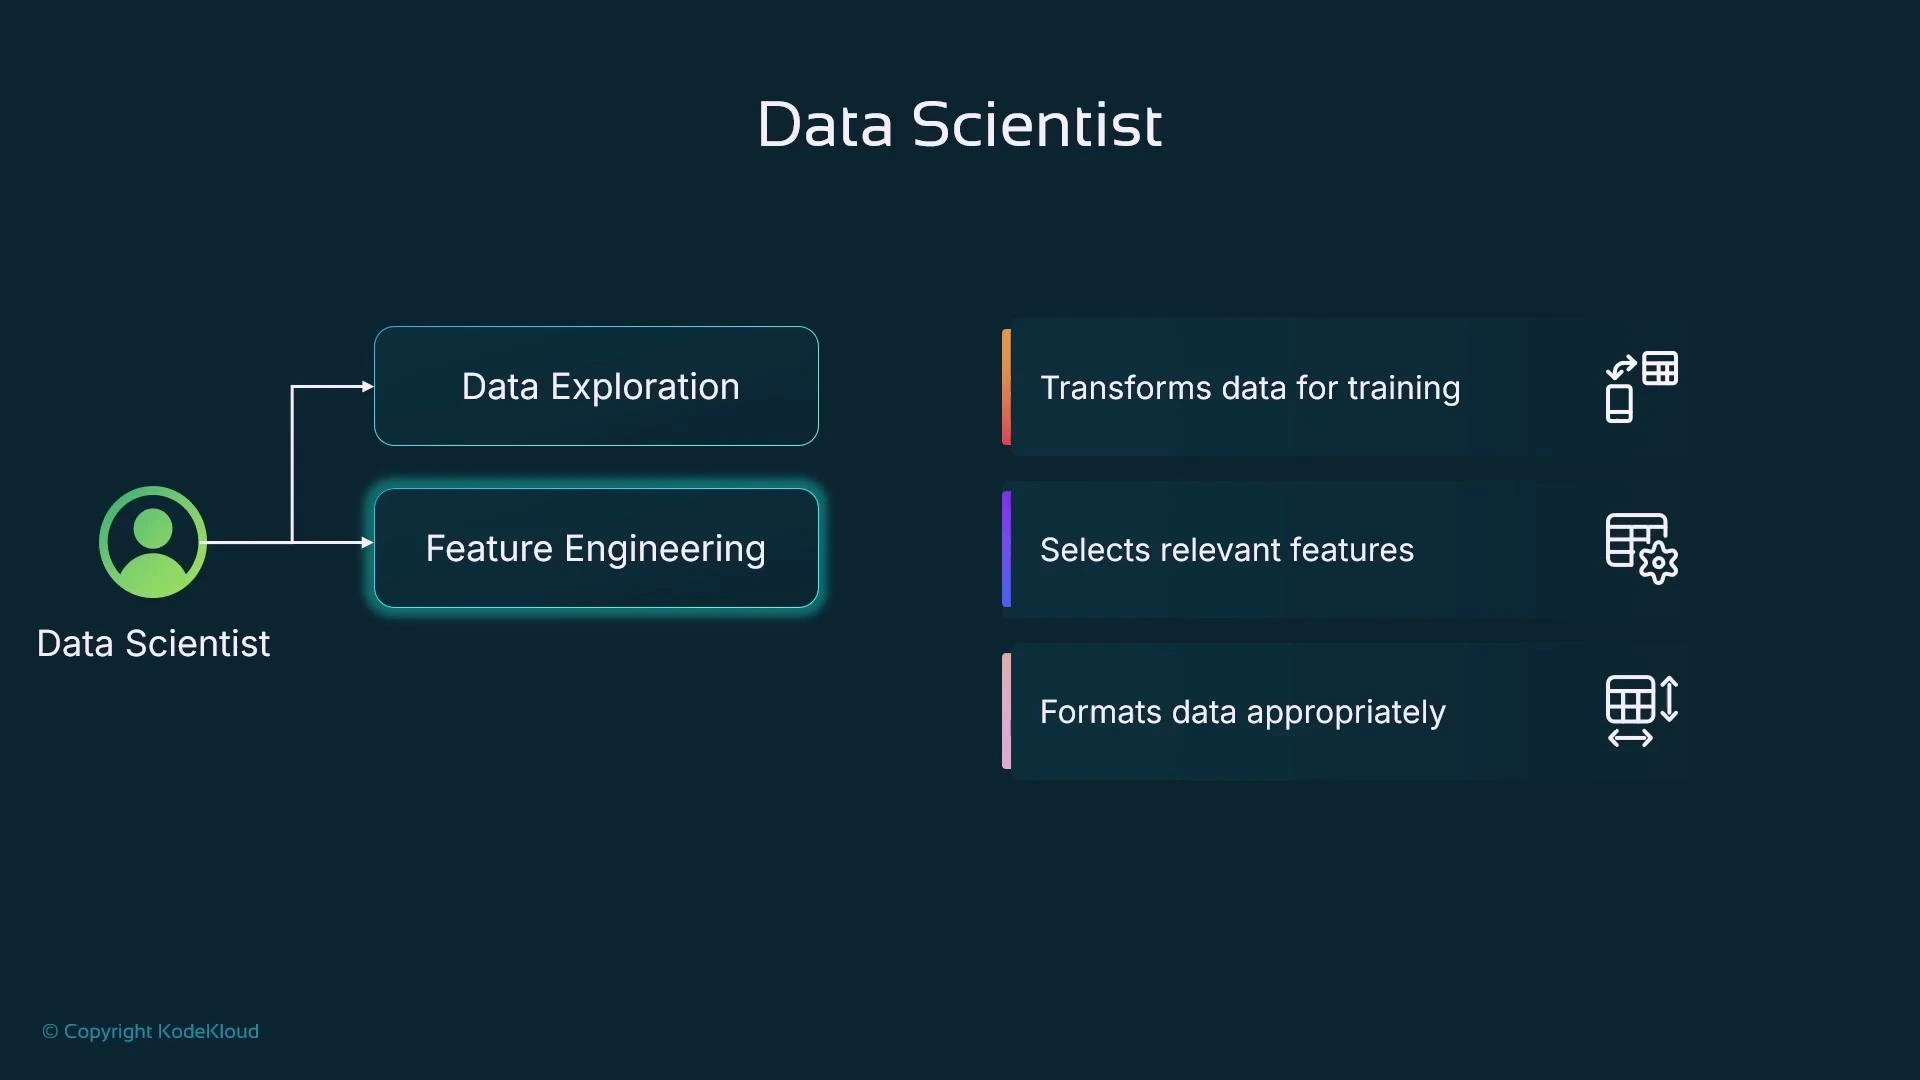
Quick examples (common patterns):
# load and peek at data
import pandas as pd
df = pd.read_csv("data/train.csv")
df.head()
df.describe()

# split for quick validation
from sklearn.model_selection import train_test_split
train_df, val_df = train_test_split(df, test_size=0.2, random_state=42)
For visual diagnostics:
import seaborn as sns
sns.pairplot(df.sample(500), hue="target")
Scikit-learn becomes a productivity multiplier for preprocessing and baseline models — use its transformers to avoid hand-implementing common steps.
A slide titled "Data Scientist" showing a workflow from a green user icon to a "Data Exploration" box. To the right is a panel with Jupyter and Python logos and a numbered list of tools: Pandas, NumPy, Matplotlib, and Scikit-learn.

Feature engineering

Once the dataset is understood, feature engineering prepares inputs for modeling. Common steps:
  • Drop non-predictive columns and reduce cardinality where appropriate.
  • Convert categorical variables to numeric form (one-hot, ordinal, target encoding, or embeddings).
  • Handle missing values (imputation strategies: mean, median, model-based).
  • Normalize / standardize numeric features.
  • Create derived features (date/time decompositions, feature crosses).
  • Reduce dimensionality (feature selection, PCA, or regularization-aware models).
Always confirm the encoding strategy is appropriate for the model and data. For example, one-hot encoding can explode dimensionality for high-cardinality categorical features—consider alternatives like embedding-based approaches or feature hashing in those cases.
A dark-themed slide titled "Data Scientist" showing two main tasks—Data Exploration and Feature Engineering—linked from a user icon. To the right it lists responsibilities: transforms data for training, selects relevant features, and formats data appropriately.
Example: simple preprocessing pipeline with scikit-learn:
from sklearn.pipeline import Pipeline
from sklearn.impute import SimpleImputer
from sklearn.preprocessing import StandardScaler, OneHotEncoder
from sklearn.compose import ColumnTransformer

num_cols = ["age", "income"]
cat_cols = ["gender", "region"]

num_pipeline = Pipeline([
    ("imputer", SimpleImputer(strategy="median")),
    ("scaler", StandardScaler())
])

cat_pipeline = Pipeline([
    ("imputer", SimpleImputer(strategy="constant", fill_value="missing")),
    ("onehot", OneHotEncoder(handle_unknown="ignore"))
])

preprocessor = ColumnTransformer([
    ("num", num_pipeline, num_cols),
    ("cat", cat_pipeline, cat_cols)
])
When datasets have hundreds of features, prioritizing feature selection and dimensionality reduction is essential to avoid overfitting and to improve training convergence.

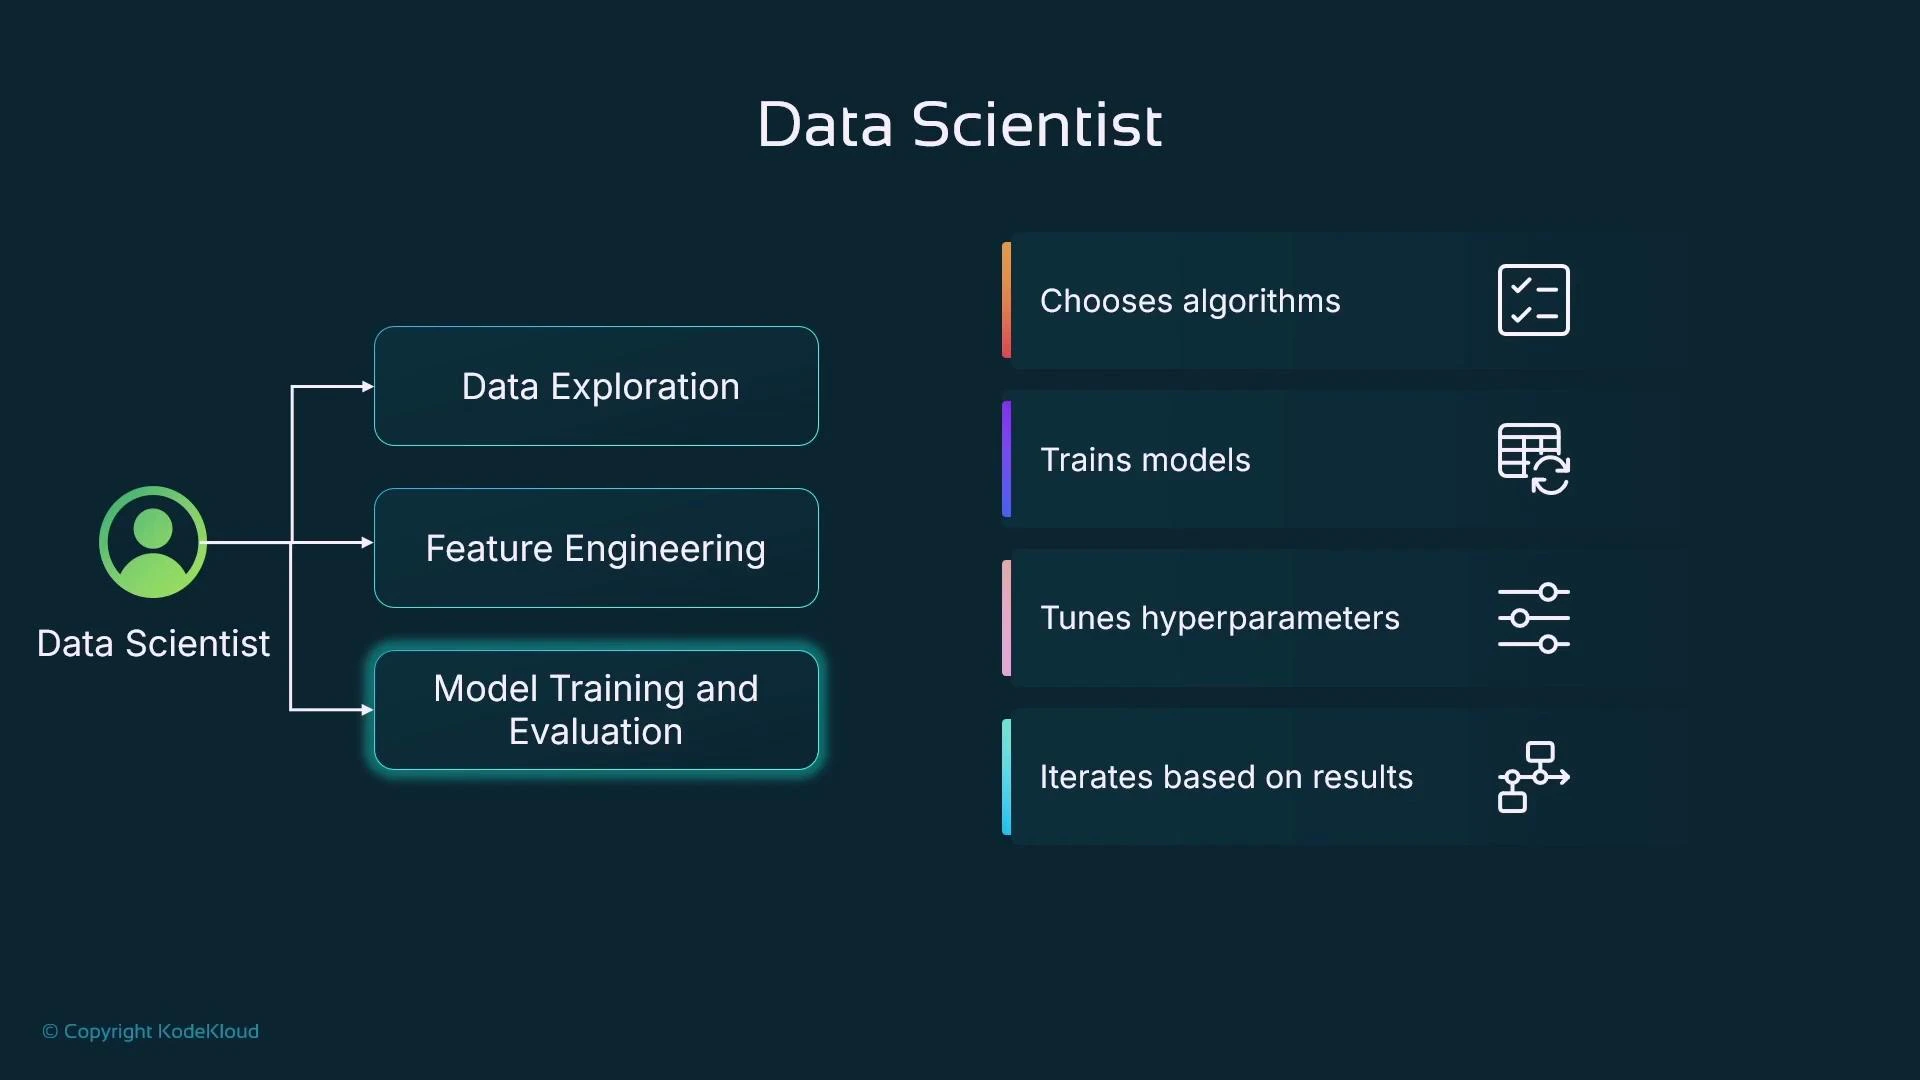
Model training, evaluation, and iteration

Data scientists run experiments across algorithms (e.g., XGBoost, LightGBM, or deep learning) and hyperparameters. Each run produces model artifacts and evaluation metrics; when using managed training, artifacts commonly persist to object storage (e.g., Amazon S3). Standard evaluation patterns:
  • Hold-out split (typical: 70% train / 20% validation / 10% test) or cross-validation.
  • Monitor validation metrics to compare runs and avoid overfitting.
  • Track hyperparameters (learning rate, epochs/rounds, batch size, regularization) and their impact.
Hyperparameter tuning is iterative—automated search (random, grid, Bayesian) is used to find strong configurations efficiently.
An infographic titled "Data Scientist" showing a person icon linked to three boxes: Data Exploration, Feature Engineering, and Model Training and Evaluation. To the right it lists responsibilities like choosing algorithms, training models, tuning hyperparameters, and iterating based on results.
Small example: train a baseline sklearn model and save results:
from sklearn.ensemble import RandomForestClassifier
from sklearn.metrics import accuracy_score
import joblib

X_train = preprocessor.fit_transform(train_df)
y_train = train_df["target"]

model = RandomForestClassifier(n_estimators=100, random_state=42)
model.fit(X_train, y_train)

# evaluate
X_val = preprocessor.transform(val_df)
y_val = val_df["target"]
print("val acc:", accuracy_score(y_val, model.predict(X_val)))

# save locally or upload to managed storage (S3) for later deployment
joblib.dump(model, "model.joblib")
Managed platforms provide additional capabilities — automated HPO, distributed training, and profiling/debugging tools — to scale these experiments.

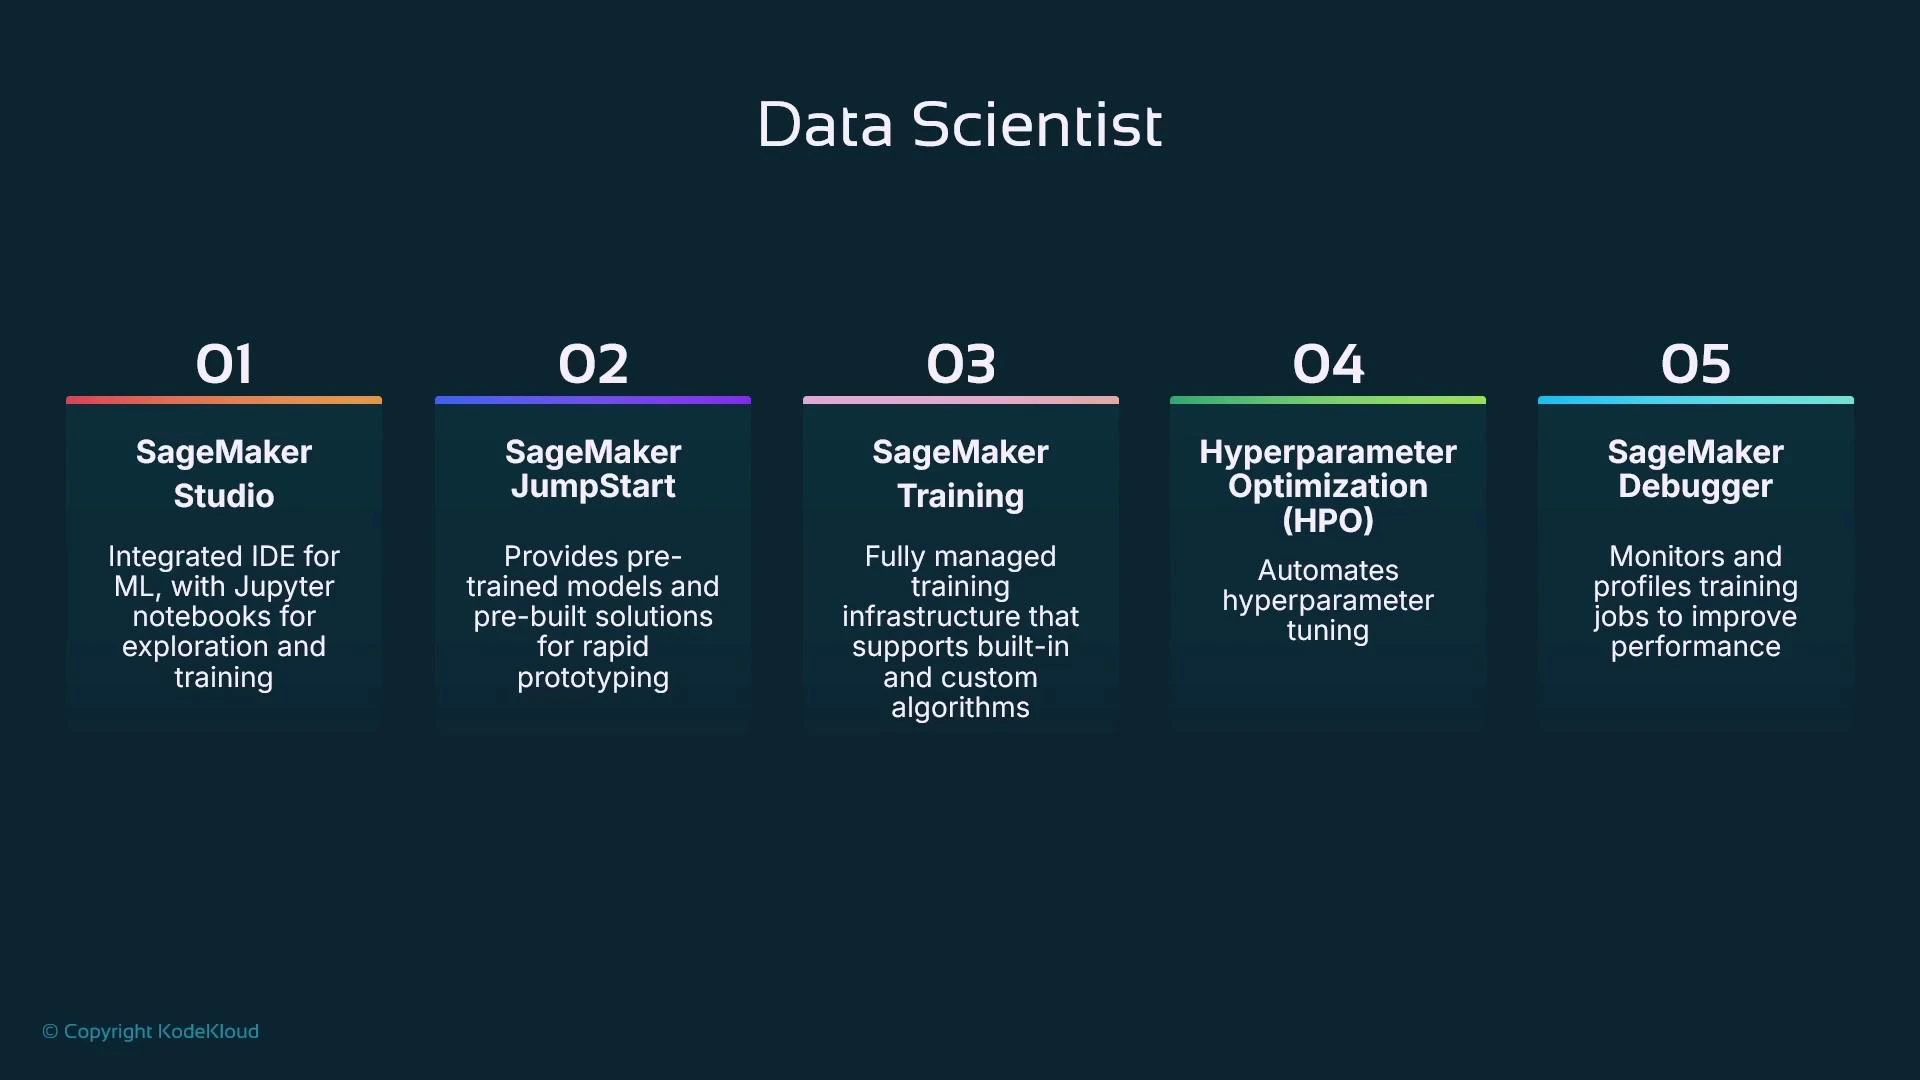
How Data Scientist tasks map to a managed ML platform

  • Hosted, browser-based notebook environments (like SageMaker Studio) let data scientists author and run experiments with managed compute and seamless integrations.
  • Model catalogs and prebuilt examples (JumpStart) accelerate prototyping using pre-trained models or templates.
  • Managed training jobs provision compute (CPU/GPU), run training, and persist model artifacts to storage (S3).
  • Automated hyperparameter optimization services search the configuration space efficiently.
  • Training-level debuggers and profilers collect metrics and tensors during training to reveal bottlenecks.
A dark presentation slide titled "Data Scientist" showing five numbered cards that list AWS SageMaker components: SageMaker Studio, JumpStart, Training, Hyperparameter Optimization (HPO), and SageMaker Debugger. Each card includes a one-line description of the corresponding feature.
Tool-to-use mapping (quick reference):
Resource / ToolUse CaseExample
Jupyter / JupyterLabInteractive exploration and notebooksjupyter.org
PandasTabular data manipulation and EDAdf.describe(), df.groupby()
NumPyEfficient numerical opsVectorized transforms
Matplotlib / SeabornVisualizations and diagnosticssns.pairplot()
scikit-learnPreprocessing & baseline modelsPipelines, transformers, train_test_split
XGBoost / LightGBMFast tree-based models for tabular dataXGBoost, LightGBM
Managed training (SageMaker)Scalable compute for training, artifacts to S3SageMaker Docs

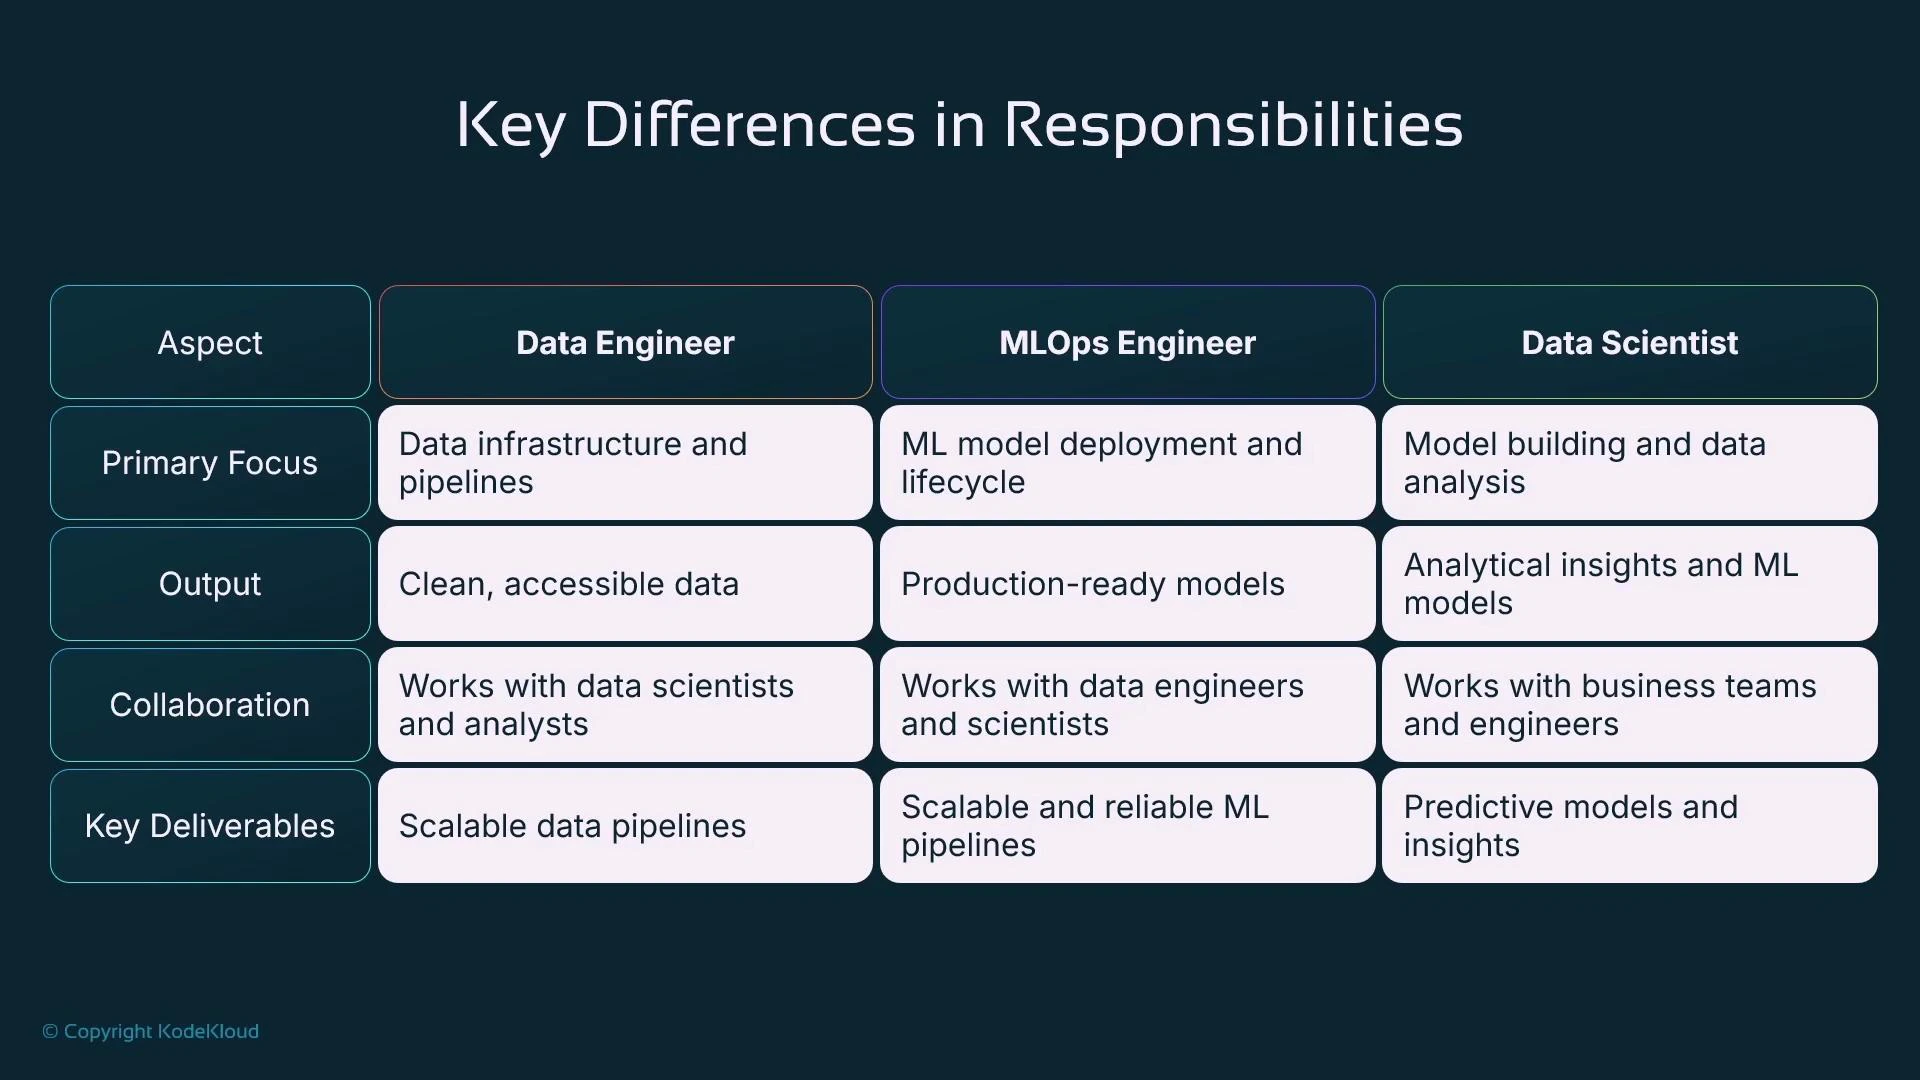
Personas and collaboration

Three complementary ML personas and their responsibilities:
  • Data Engineer: builds repeatable ETL/ELT pipelines, cleans and transforms raw data, and delivers production-ready datasets for downstream modeling.
  • Data Scientist: performs exploratory data analysis, feature engineering, model experimentation, and delivers trained models and documented notebooks.
  • MLOps Engineer: automates end-to-end ML workflows (CI/CD for models), orchestrates training/deployments, manages model registry/versioning, and ensures safe production releases.
They collaborate closely: data engineers supply clean data; data scientists build and validate models (often with subject-matter experts); MLOps engineers operationalize models into production systems.
A slide titled "Key Differences in Responsibilities" showing a comparison table that contrasts Data Engineer, MLOps Engineer, and Data Scientist across aspects like Primary Focus, Output, Collaboration, and Key Deliverables. Each column summarizes each role’s focus (e.g., data pipelines, model deployment, model building), typical outputs, collaborators, and deliverables.

Recap

  • Data engineers prepare repeatable data extraction and transformation pipelines to deliver clean datasets.
  • Data scientists explore data, engineer features, run iterative training experiments with different algorithms and hyperparameters, and produce trained models and documented notebooks.
  • MLOps engineers automate, test, version, and deploy models and pipelines for production usage.
This lesson mapped common managed ML platform features (notebooks, managed training, HPO, debugger) to the data scientist persona. Next, we’ll cover what defines a managed service and how such platforms behave operationally.

References and further reading

Watch Video