- CloudWatch for infrastructure and service-level metrics and logs.
- SageMaker Model Monitor for model-centric monitoring: data quality, drift, bias, and feature-attribution changes.
This article shows AWS-native approaches (CloudWatch + SageMaker Model Monitor) and how they complement each other. You can integrate CloudWatch metrics into third-party tools (Datadog, Sumo Logic) or trigger remediation (Lambda, CI/CD) from alarms.
Two perspectives for monitoring
When deciding whether a deployed model is working well, separate monitoring into two perspectives:-
Infrastructure health
- Monitors compute resources where models run (managed endpoints). Undersized instances cause high latency and low throughput.
- Track CPU/GPU/disk usage, memory, networking, and request latency.
-
Model health
- Monitors prediction quality and data distribution changes that affect model behavior.
- Verify production inputs are statistically similar to training/validation inputs, detect bias across subgroups, and monitor feature-attribution changes.
SageMaker Model Monitor — baseline example
A typical first step is to create a baseline from training or holdout data. The baseline produces statistics.json and constraints.json that Model Monitor uses to detect drift and data-quality issues. Example: suggest a baseline using DefaultModelMonitorCloudWatch: metrics and logs
CloudWatch collects metrics and logs from AWS services (Lambda, SageMaker, S3, etc.). SageMaker components (training, processing jobs, endpoints) emit both metrics and service logs to CloudWatch. Key CloudWatch metrics for SageMaker endpointsEnabling data capture on a SageMaker endpoint
Data capture is configured as part of the EndpointConfig. To enable capture for an existing endpoint, create a new EndpointConfig with DataCaptureConfig and update the endpoint to the new config.CloudWatch costs can grow significantly at enterprise scale (many models, many high-resolution metrics and logs, frequent data capture). Plan retention, metric resolution, sampling, and S3 lifecycle policies to control costs.
CloudWatch console: metrics and dashboards
In the CloudWatch console browse All Metrics by namespace and service. For endpoints, monitor CPU/GPU/memory, invocations, error counts, and latency. Use dashboards to aggregate signals across endpoints and to correlate model health with infrastructure metrics. When troubleshooting, distinguish:- 4xx spikes -> malformed requests or client-side issues.
- 5xx spikes -> server-side failures or model runtime errors.
CloudWatch logs
Service logs are organized into log groups. For SageMaker endpoints, search log groups for “endpoint” and inspect log streams. Filter for ERROR, exception, or failed to find root-cause messages. Logs often contain structured payloads (timestamp, message, inferenceId) useful for matching predictions to ground truth later. Example of captured ground-truth records (attach to inference records for evaluation):Alarms and automated remediation
CloudWatch Alarms allow threshold-based detection and can invoke actions:- SNS notifications (email/SMS) to alert teams.
- Invoke Lambda for automated remediation (scale-up, restart endpoint, toggle traffic).
- Trigger CI/CD pipelines to redeploy or roll back models.
- Alert when p95 latency > 5s → notify MLOps team.
- If 5xx errors persist, run an automated workflow to scale the endpoint or redeploy a previous model version.
- When Model Monitor constraints fail, trigger a retraining pipeline.
SageMaker Model Monitor (model-focused)
SageMaker Model Monitor detects model-data issues: data quality problems, distribution drift, bias, and changes in feature attribution. Typical workflow:- Create a baseline (statistics.json, constraints.json, optional attribution baselines).
- Enable data capture on the endpoint to collect payloads.
- Schedule monitoring jobs (hourly/daily) to compute runtime statistics and compare against baseline.
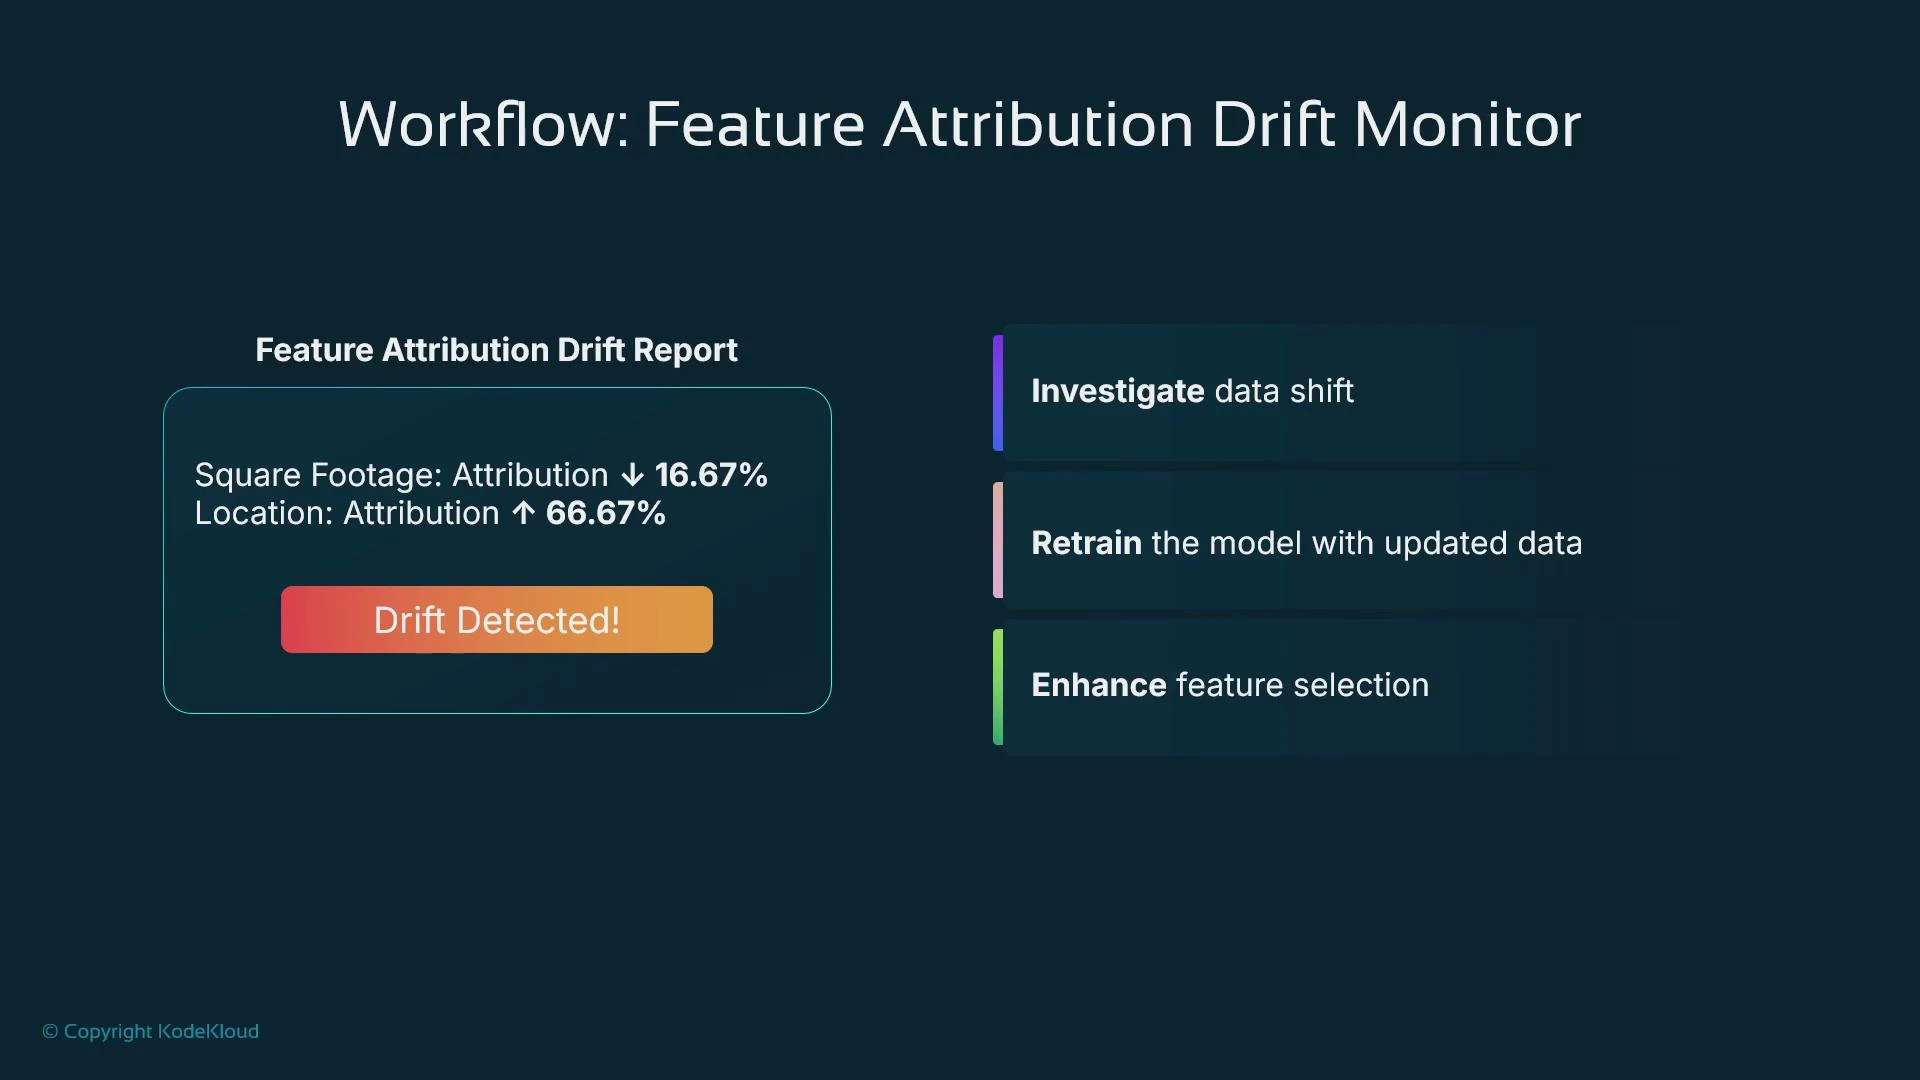
- Trigger alerts or remediation when drift/bias is detected.
Feature attribution drift — concept and workflow
Feature attribution drift tracks whether feature importances (which features drive predictions) change over time. Changes in feature importance often indicate shifts in the relationship between inputs and the target and may require retraining or feature engineering. Example scenario: a housing-price model initially uses Square Footage as the top driver and Location as a minor contributor. After a market shift, Location becomes the dominant factor — a clear attribution drift signal.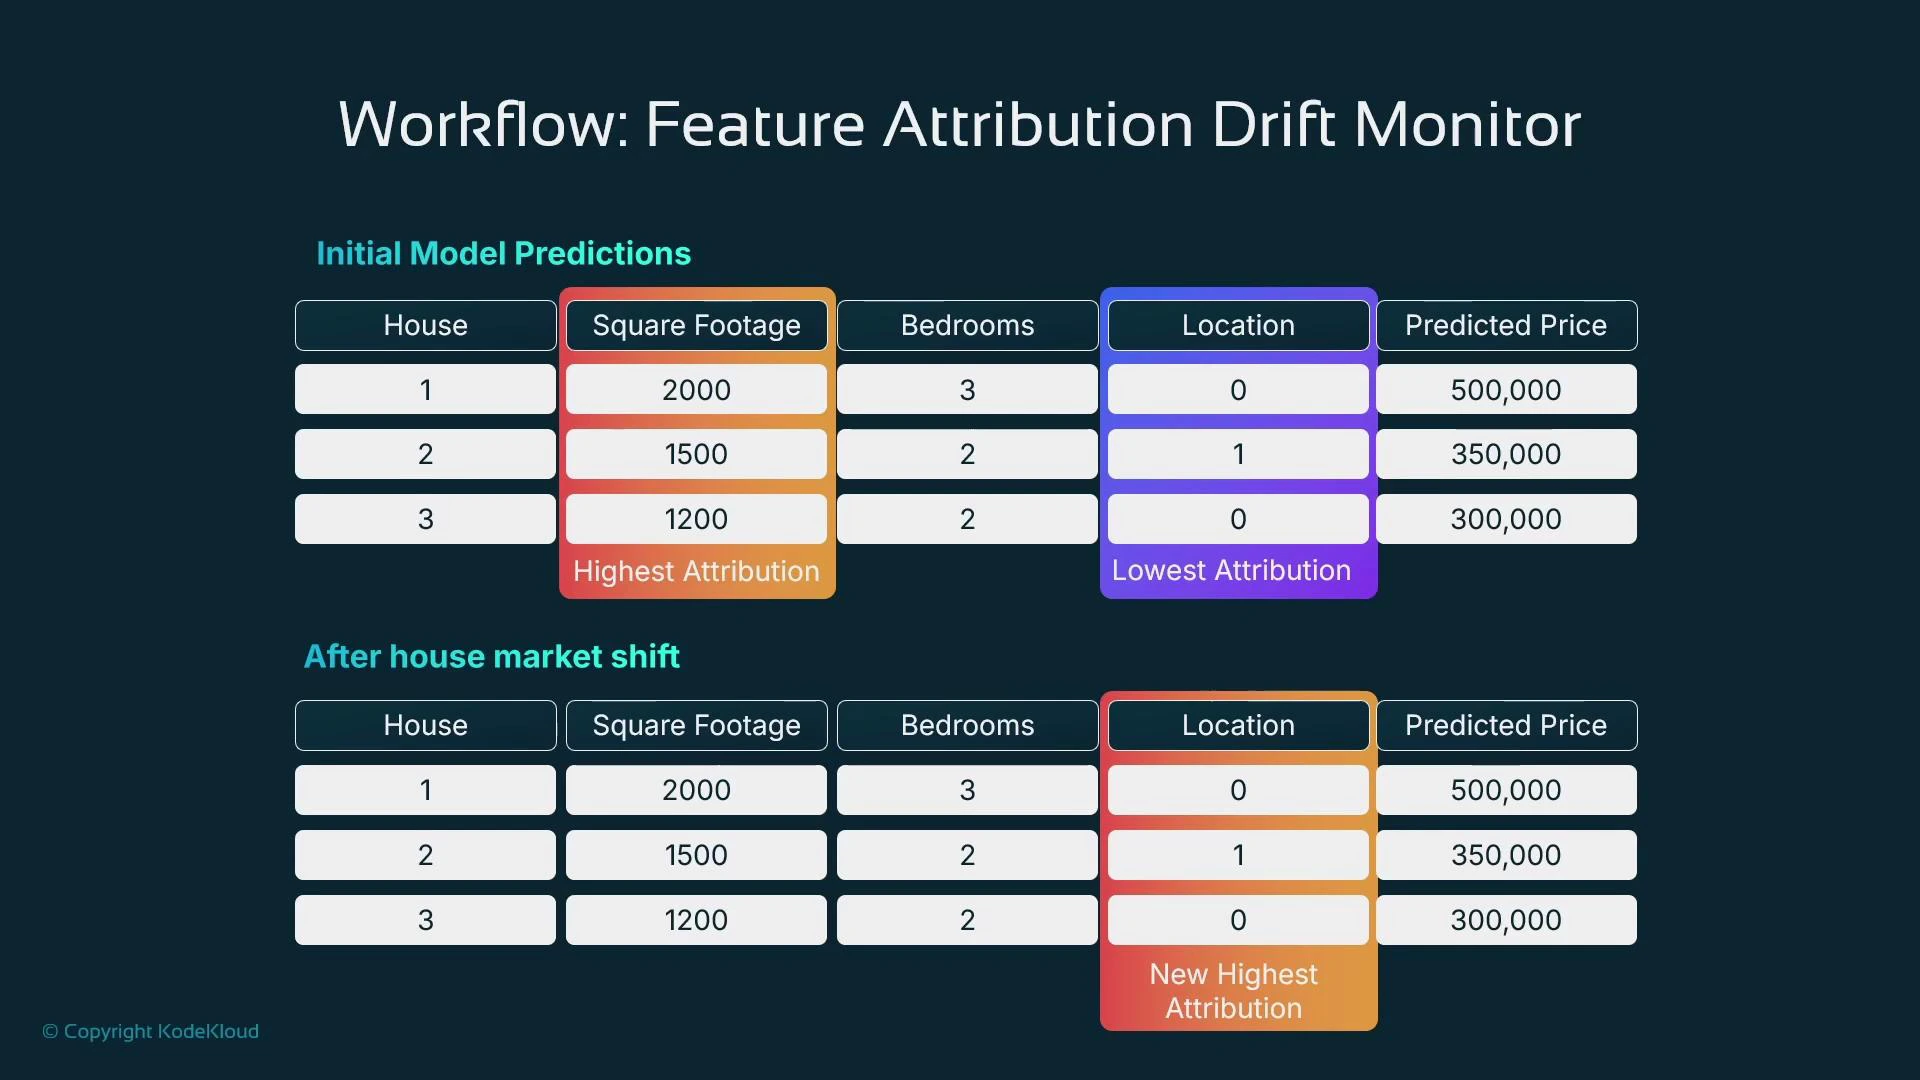
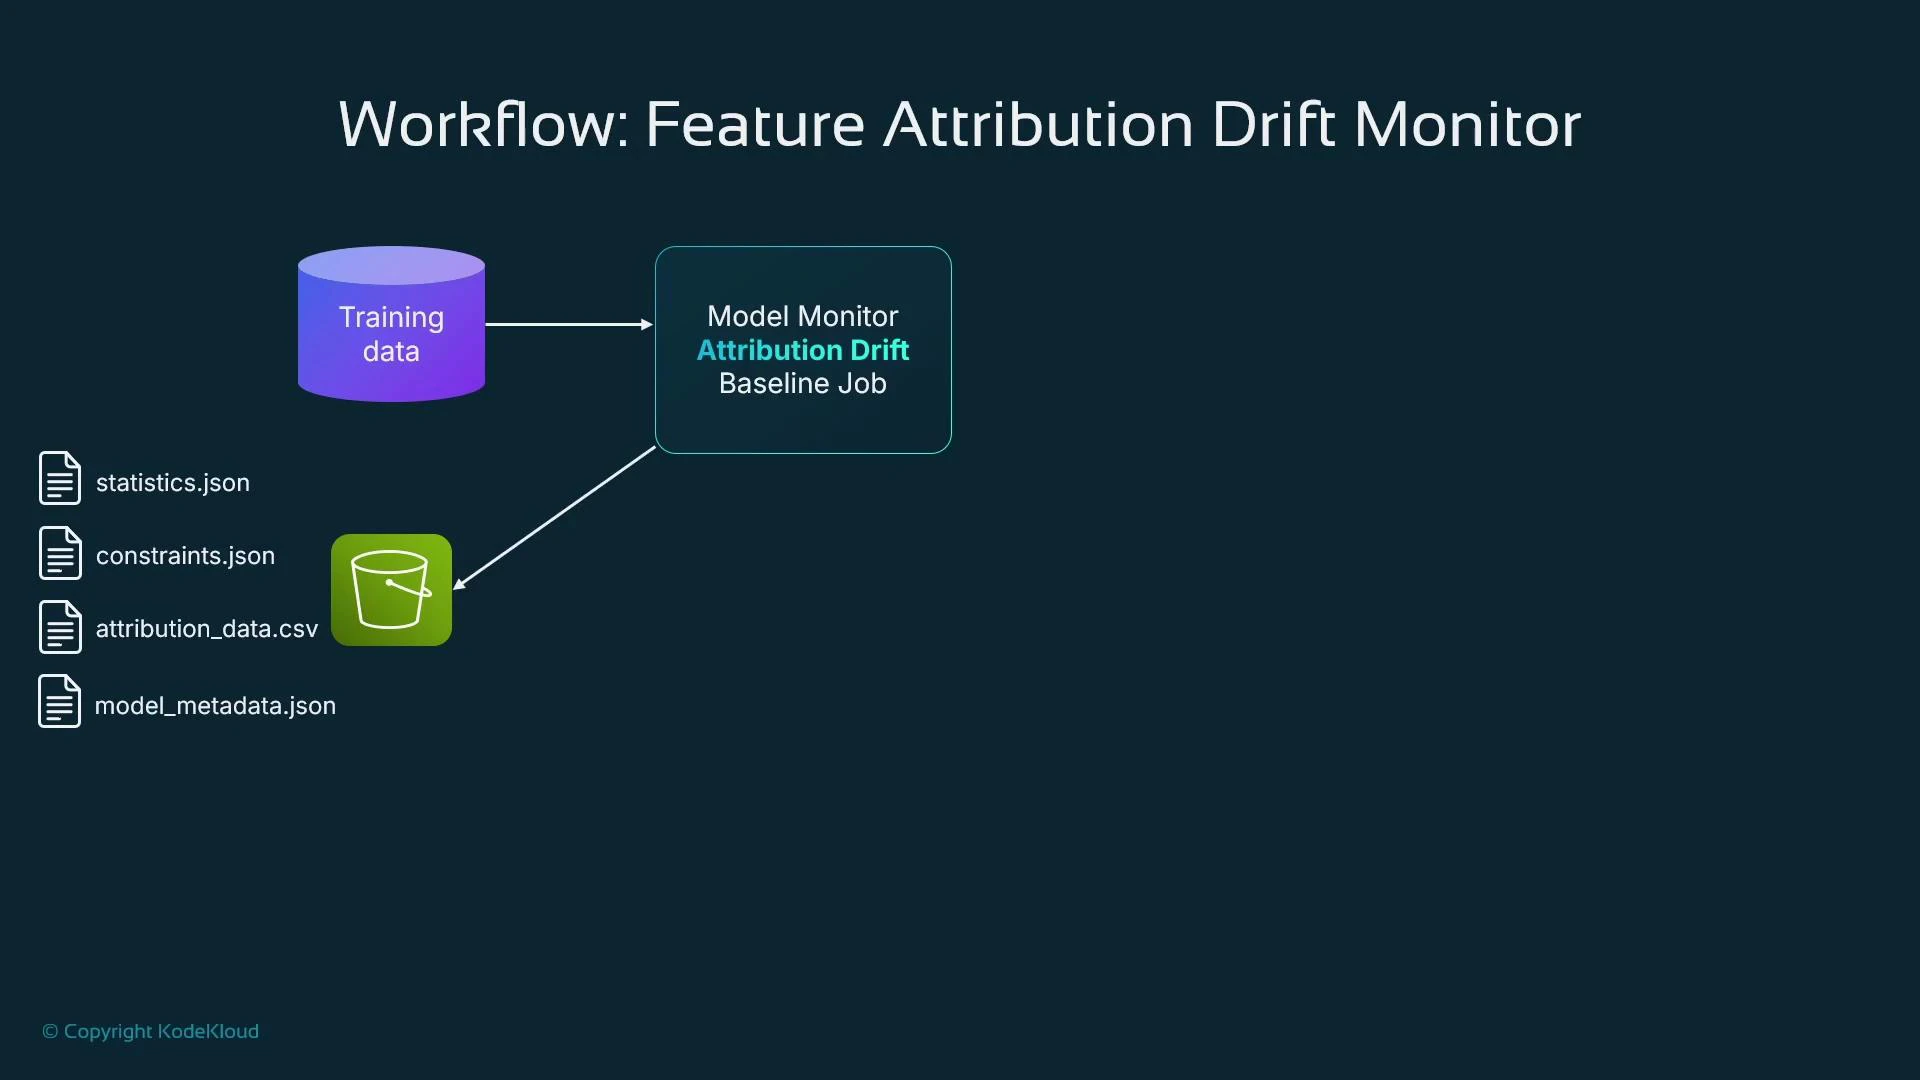
Creating a feature-attribution baseline (processing job)
Example: compute feature attributions and store baseline in S3Bias monitoring example
Detect differences in model performance across sensitive subgroups by scheduling bias monitoring. Provide captured inference data, ground truth labels, and baseline expectations.Closing notes and best practices
- Use CloudWatch for infrastructure and service-level health: CPU/GPU/memory, invocation counts, latency, logs, dashboards, and alarms.
- Use SageMaker Model Monitor for model-specific signals: data quality, input distribution drift, label/ground-truth drift, bias, and feature-attribution changes.
- Combine signals from CloudWatch and Model Monitor to trigger alerts and automated remediation: notify teams, retrain models, or redeploy as needed.
- Optimize costs: manage CloudWatch resolution and retention, use S3 lifecycle policies, and sample or aggregate high-frequency telemetry.
- Maintain a clear runbook: define thresholds, alert routing, and remediation steps for each detected condition to reduce mean time to repair.
- Amazon CloudWatch Documentation
- SageMaker Model Monitor Documentation
- AWS Lambda Documentation (automation hooks)
- Amazon SNS Documentation (notifications)