In this lesson we continue with Amazon SageMaker Canvas to build a tabular regression model from a preprocessed dataset produced in the previous Data Wrangler lesson. SageMaker Canvas provides AutoML — a low‑code capability that automates many model-building decisions so you can quickly prototype and iterate on models. What you’ll accomplish
  • Review the Data Wrangler–processed dataset exported for Canvas.
  • Create a Canvas AutoML training job using the processed dataset.
  • Inspect training artifacts, metrics, and feature attributions.
  • Run sample single-record inference and learn how to deploy the model.
Why this workflow
  • Data Wrangler standardizes and documents your preprocessing steps.
  • Canvas AutoML speeds up model exploration without requiring code.
  • When you need production-grade models, you can take artifacts from Canvas and iterate using SageMaker Studio or the SDK.
Important reminder: Canvas runs and Canvas‑backed SageMaker instances incur charges while active. Check pricing for your region and stop instances when not in use: https://aws.amazon.com/sagemaker/pricing/.
Canvas instances are billed while running. Stop the instance when not in use to avoid unexpected costs.

1 — Verify the exported dataset from Data Wrangler

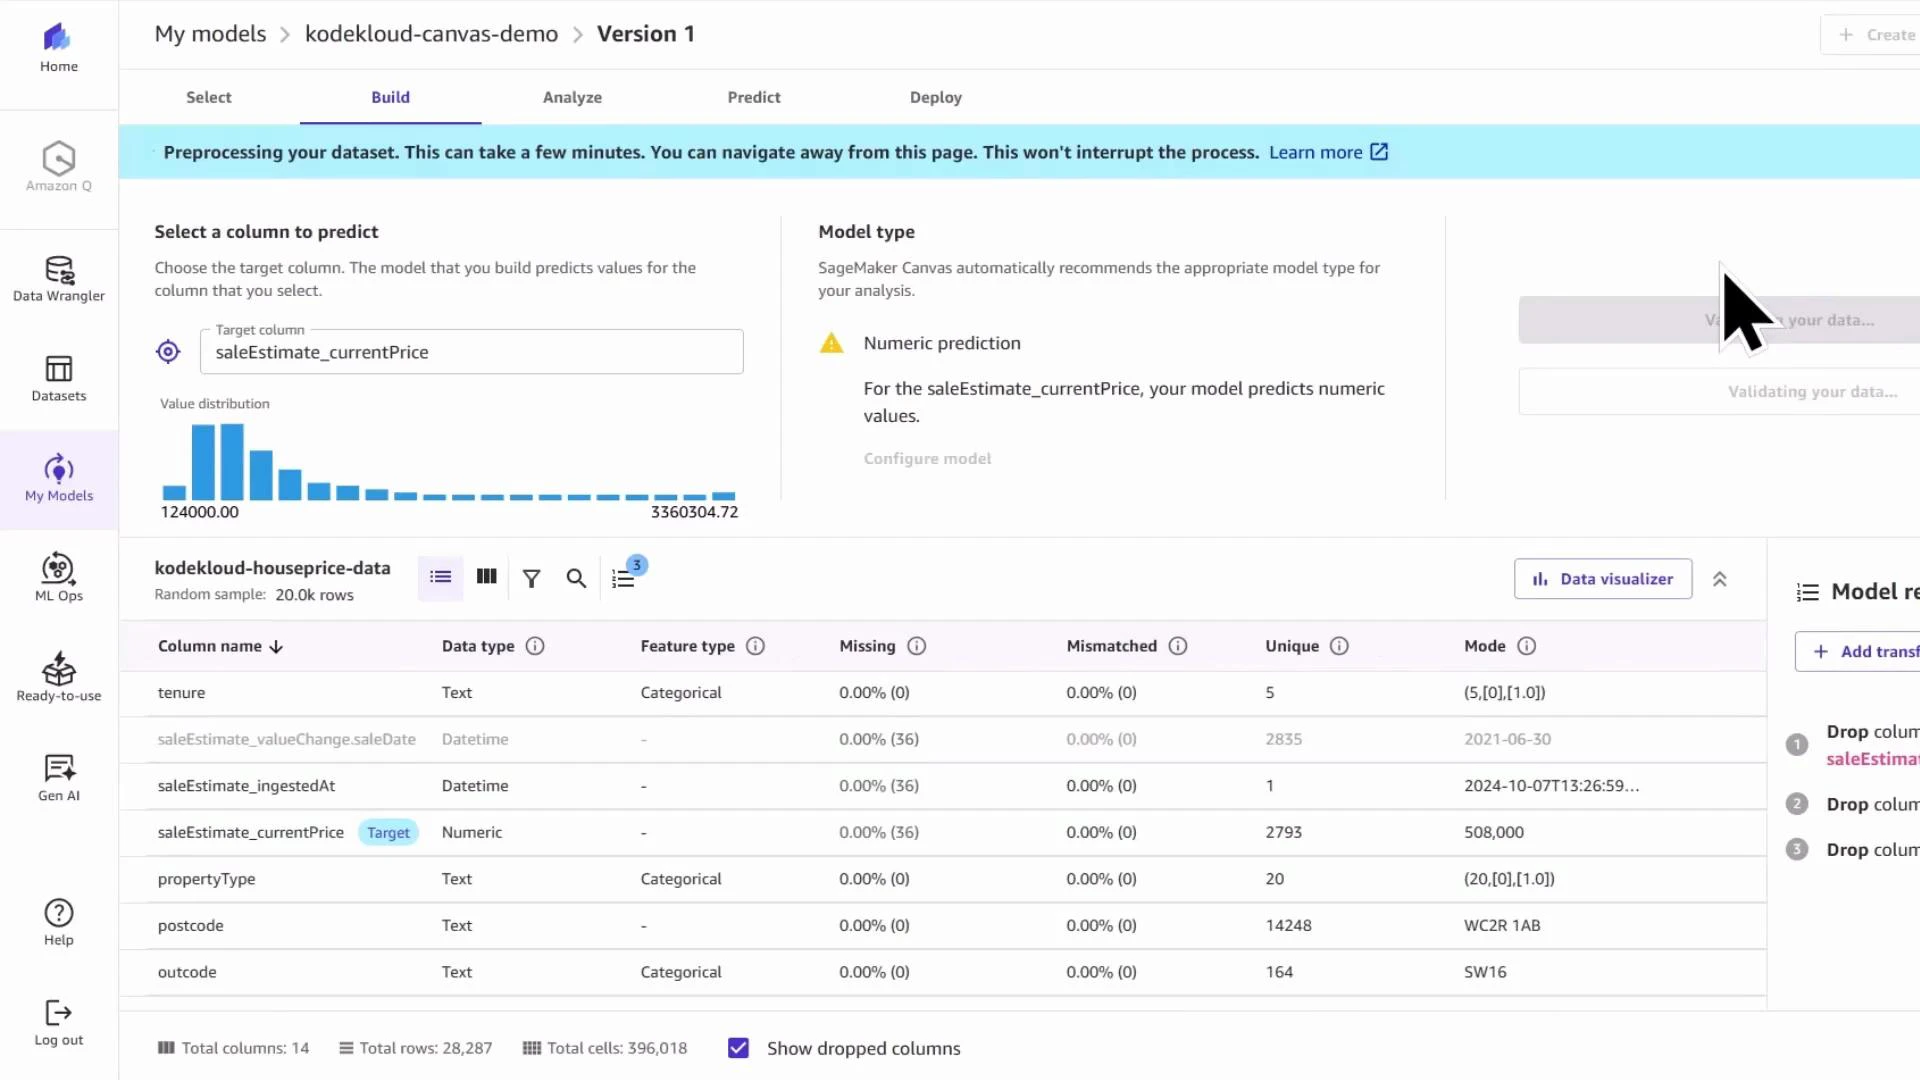
We used Data Wrangler to clean and transform the house‑price dataset: removing unnecessary columns, imputing missing values, scaling numeric features, applying ordinal encoding for some features and one‑hot encoding for others. The Data Wrangler flow exported the transformed dataset to SageMaker Canvas (and optionally to S3).
A screenshot of a Data Wrangler "Data flow" named kk-house-price-flow showing a pipeline for preprocessing a house price dataset. The flow includes steps like Data Quality report, Drop column, Impute, Scale values, Ordinal encode, One-hot encode, and two destination outputs.
Open SageMaker Studio and launch SageMaker Canvas from the Applications panel. In Canvas, open the Datasets panel and select the dataset exported by Data Wrangler (for this demo: “kodekloud-houseprice-data”).
A screenshot of a "Datasets" dashboard listing tabular datasets with columns for name, dataset type, source (S3), file count, cells (columns × rows), last updated time, and status. The top dataset ("kodekloud-houseprice-data") is selected, indicated by a checked box and a pointing hand cursor.

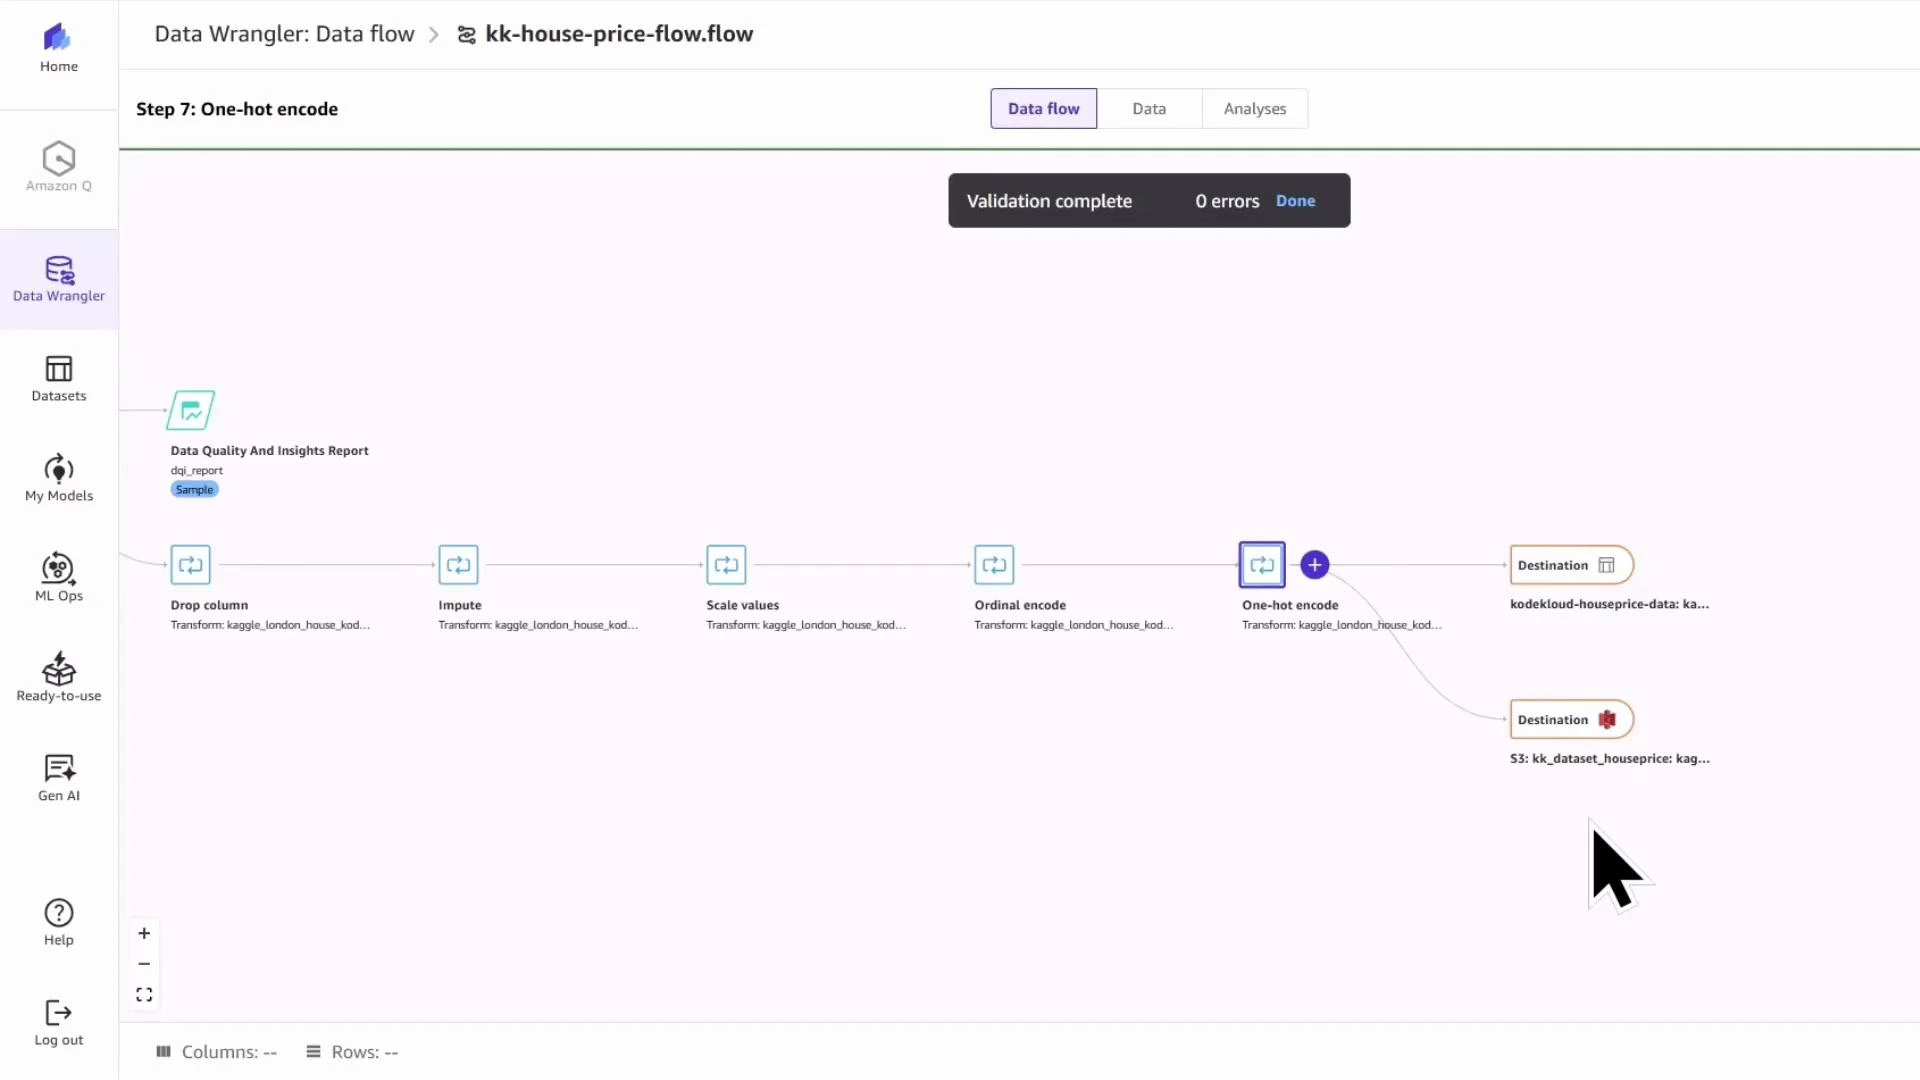
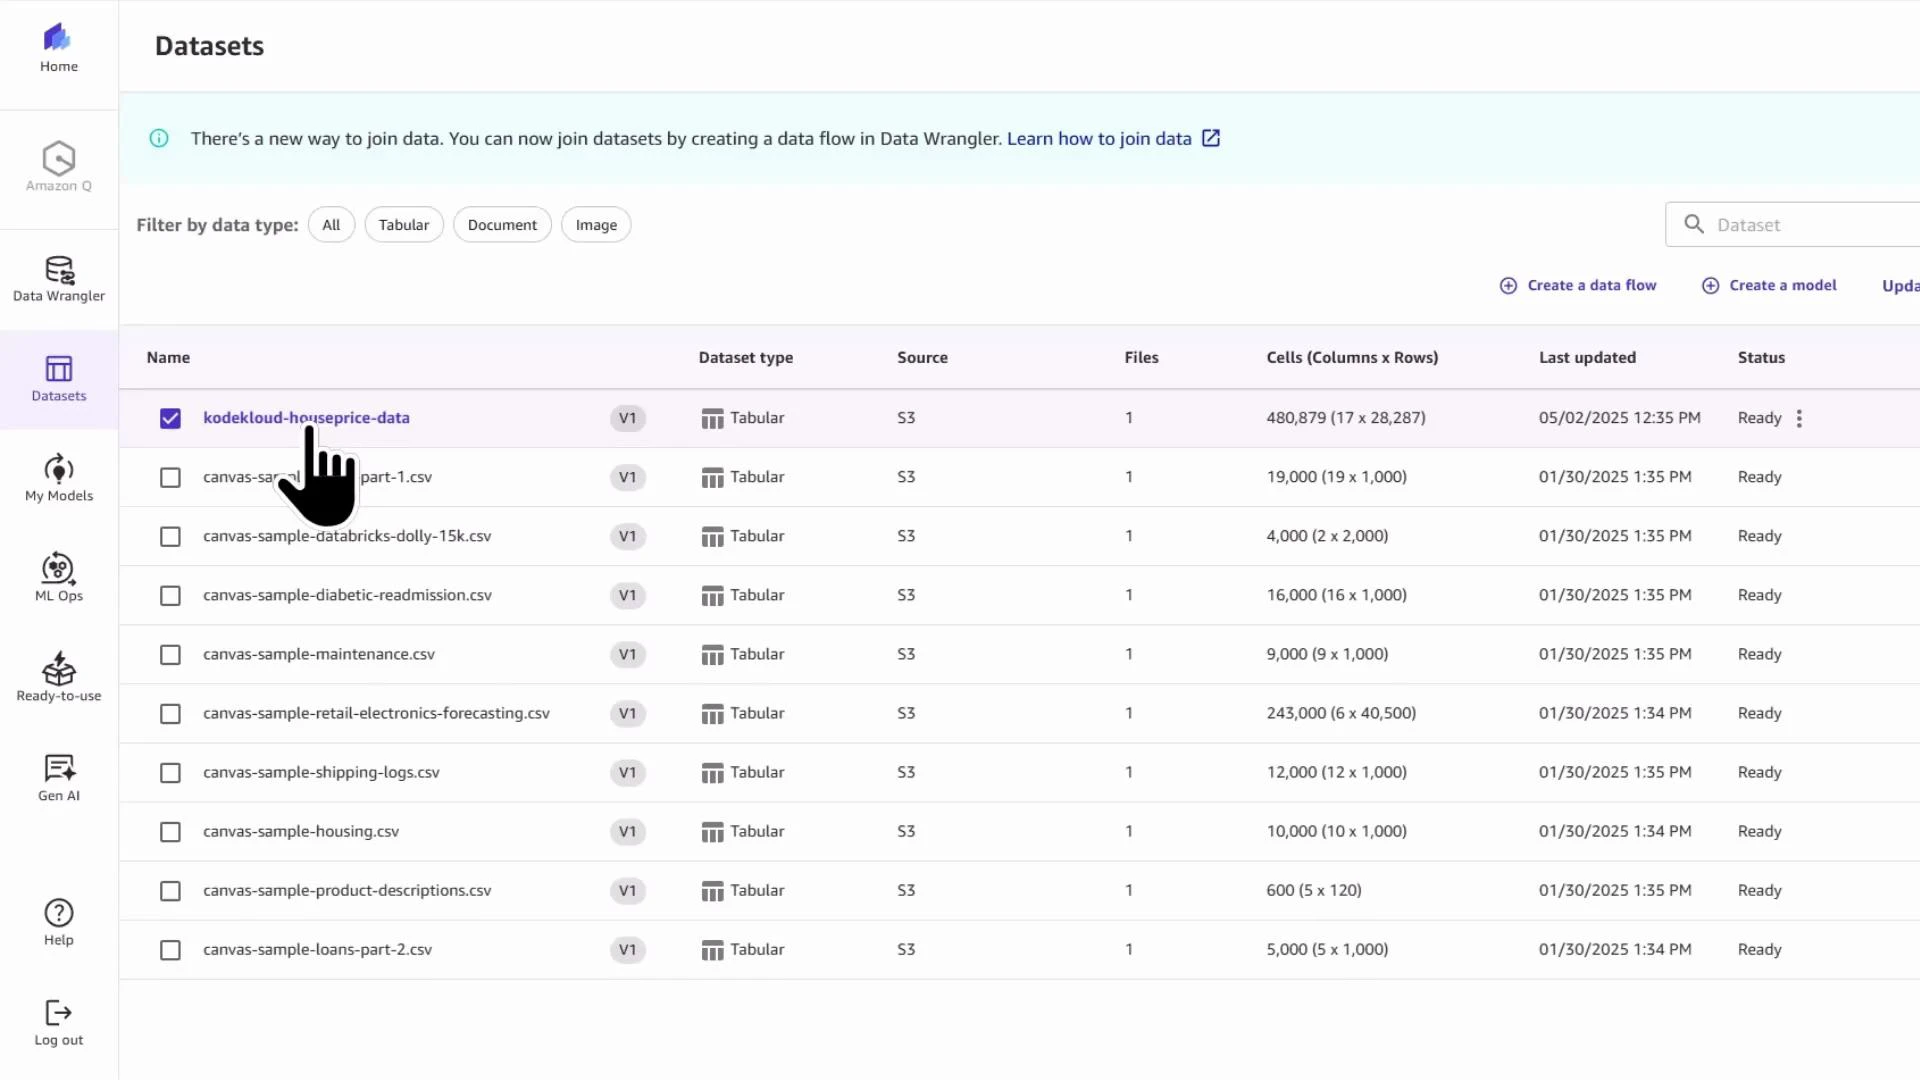
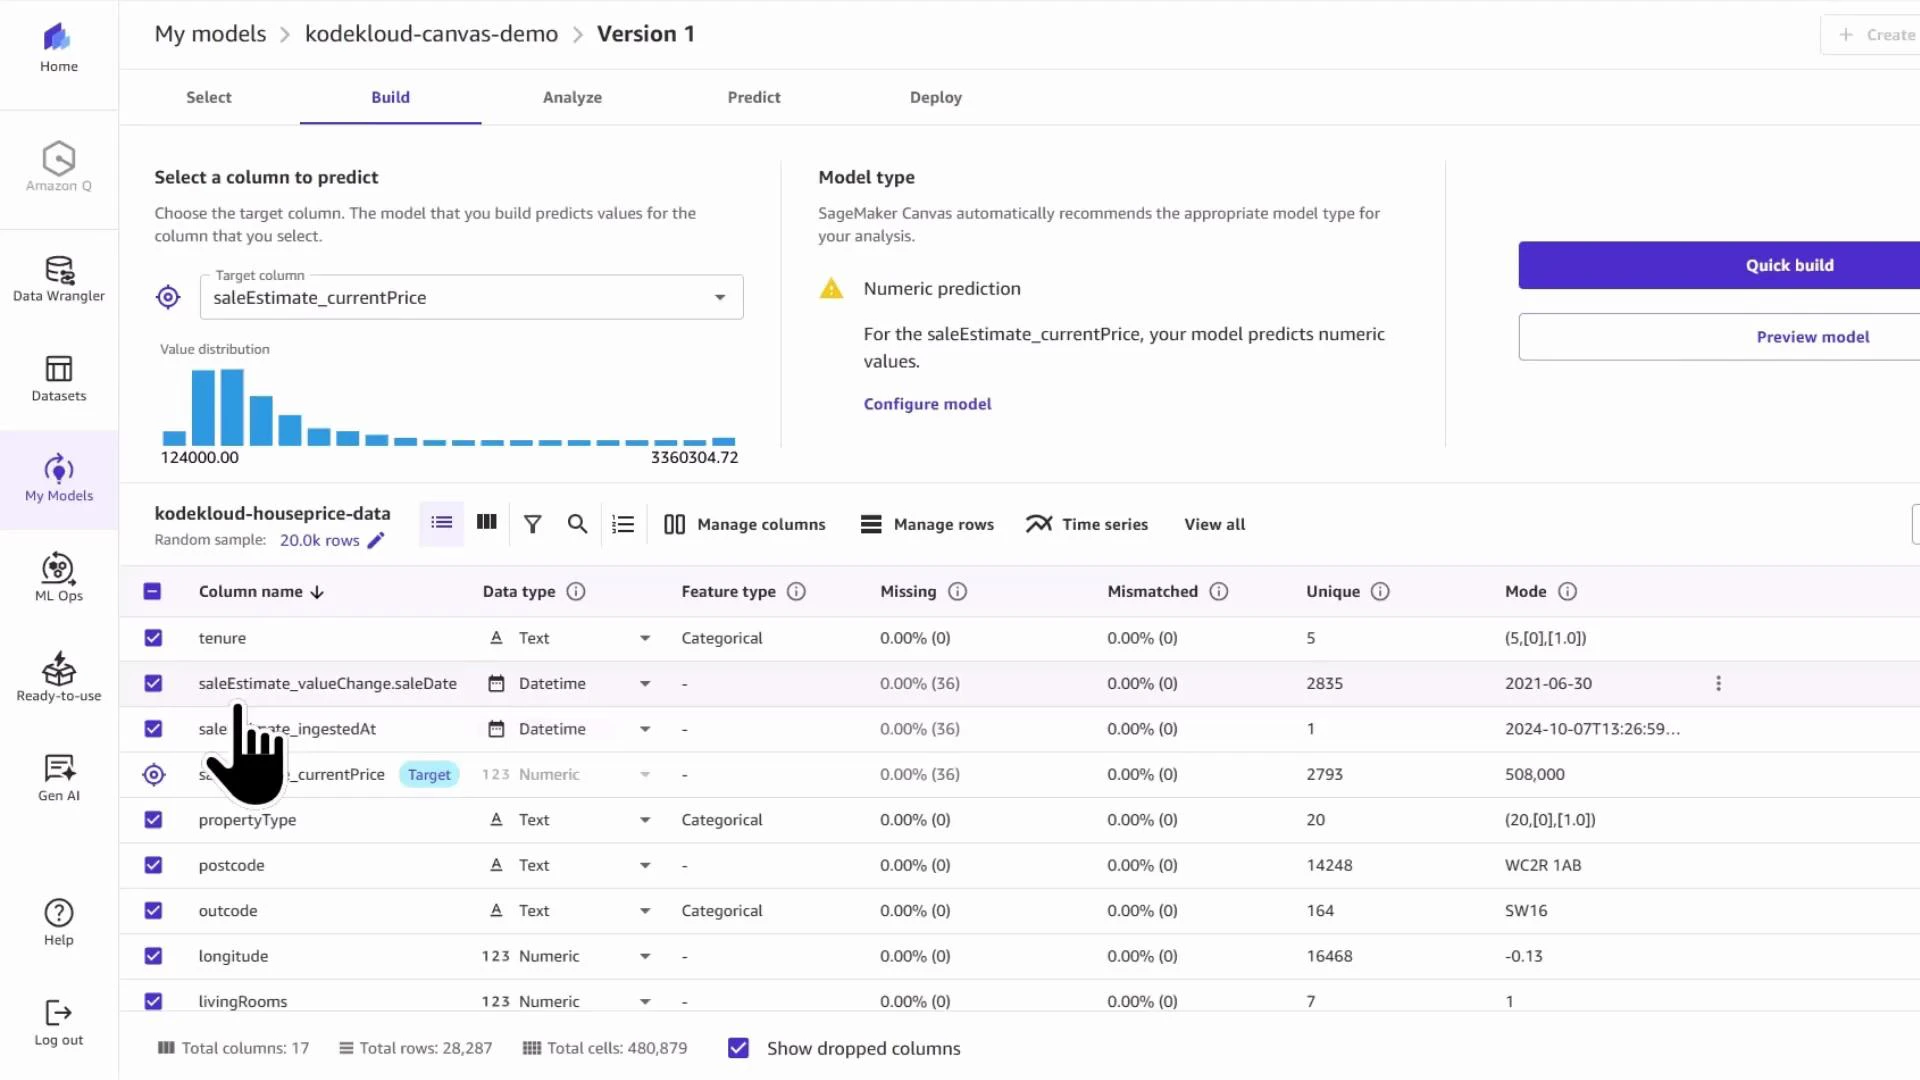
2 — Create a Canvas AutoML model (Quick Build)

  1. With the Canvas dataset selected, click Create model.
  2. Give the model a name (example: kodekloud-canvas-demo) and choose the problem type. For predicting sale prices you want a numeric/regression model — not image or text.
A web app dialog titled "Create new model" with the model name filled as "kodekloud-canvas-demo" and four problem-type cards (Predictive analysis, Image analysis, Text analysis, Fine-tune foundation model). A hand-shaped cursor is clicking the Image analysis option, and a datasets list with sidebar navigation is visible in the background.
Canvas displays the dataset columns and asks you to select the target column. For this example choose the estimated sale price column:
A screenshot of a machine learning model-building interface (SageMaker Canvas) on the "Build" tab, showing a dropdown to select a target column and a table of dataset features with statistics. A hand-shaped cursor is pointing at the "saleEstimate_currentPrice" option in the target column menu.
Canvas may suggest a time‑series model if datetime fields are present. If your objective is to predict a continuous numeric value (a regression task), explicitly set the model type to numeric/regression.
A screenshot of a machine learning UI showing a "Configure model" dialog with model type options (Time series forecasting, Numeric model type, etc.) and a left-side menu of configuration sections. The blurred background displays a dataset and column list.
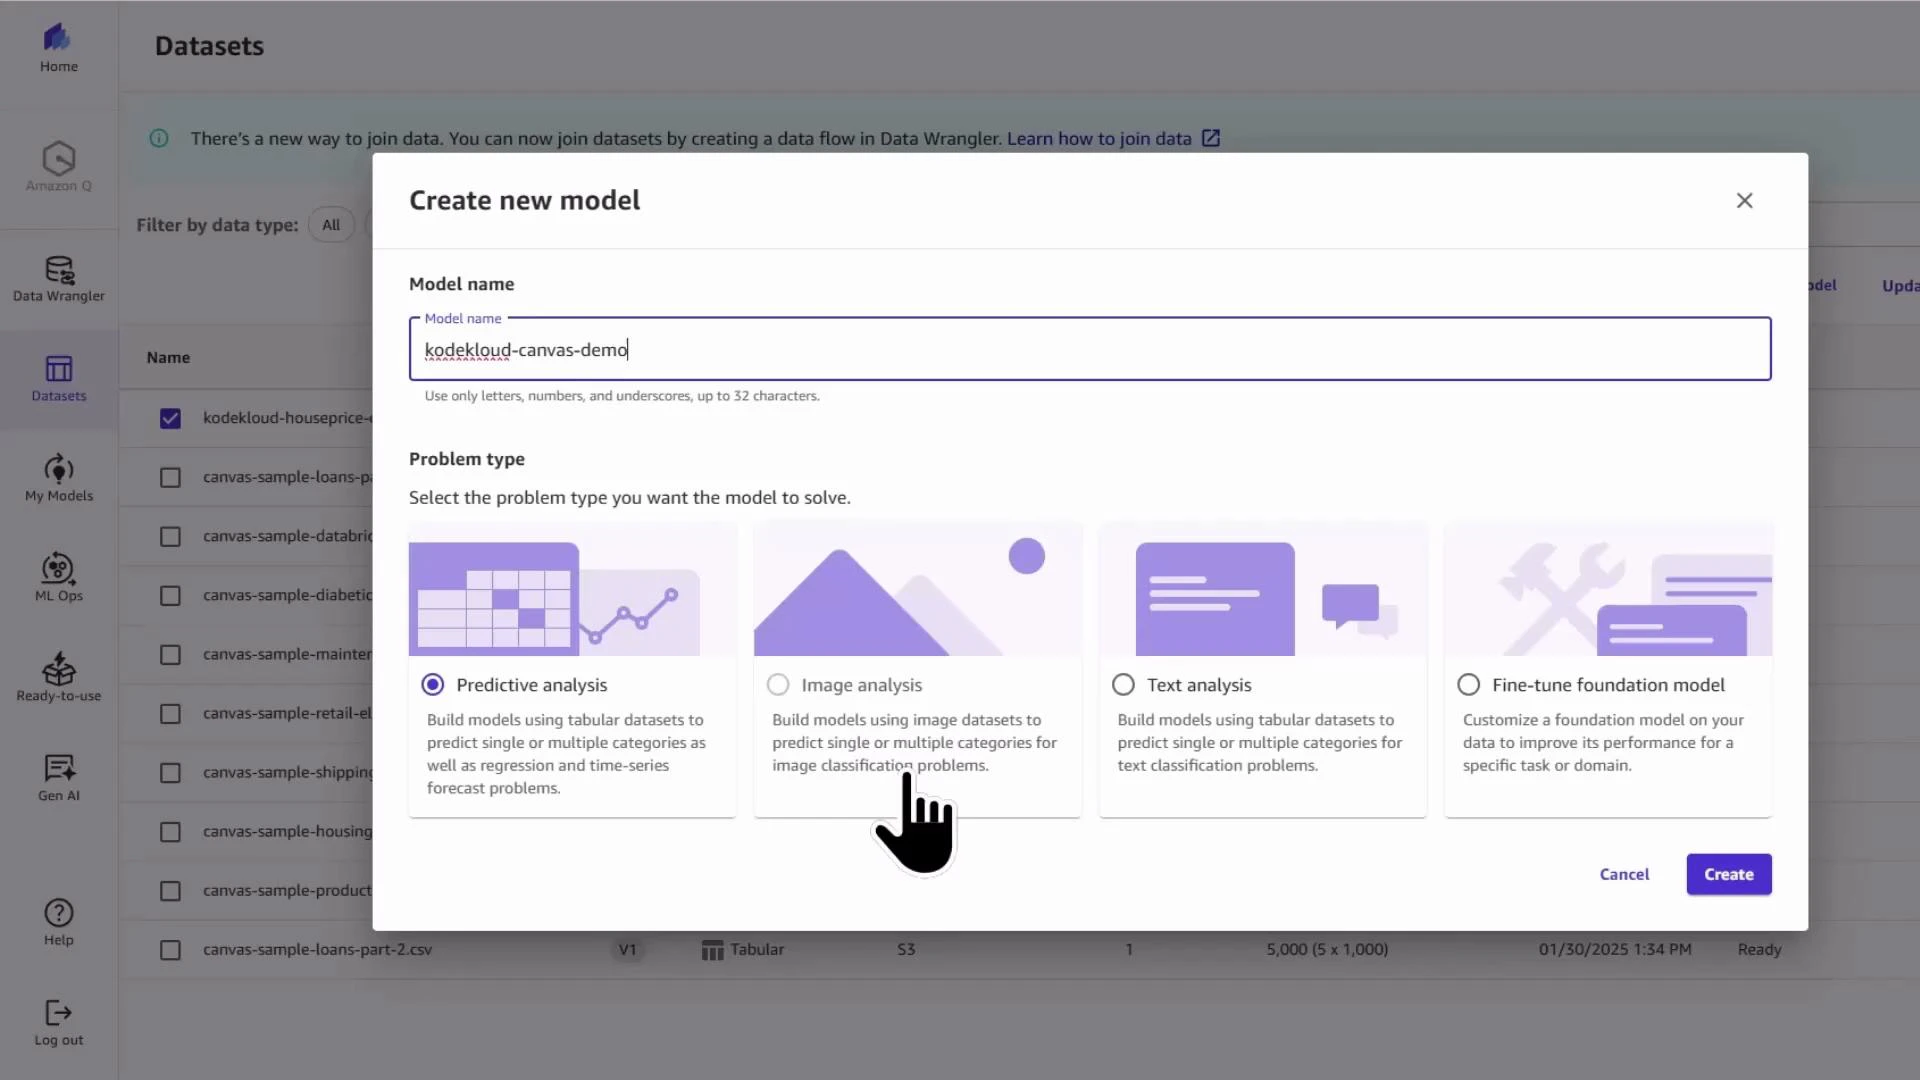
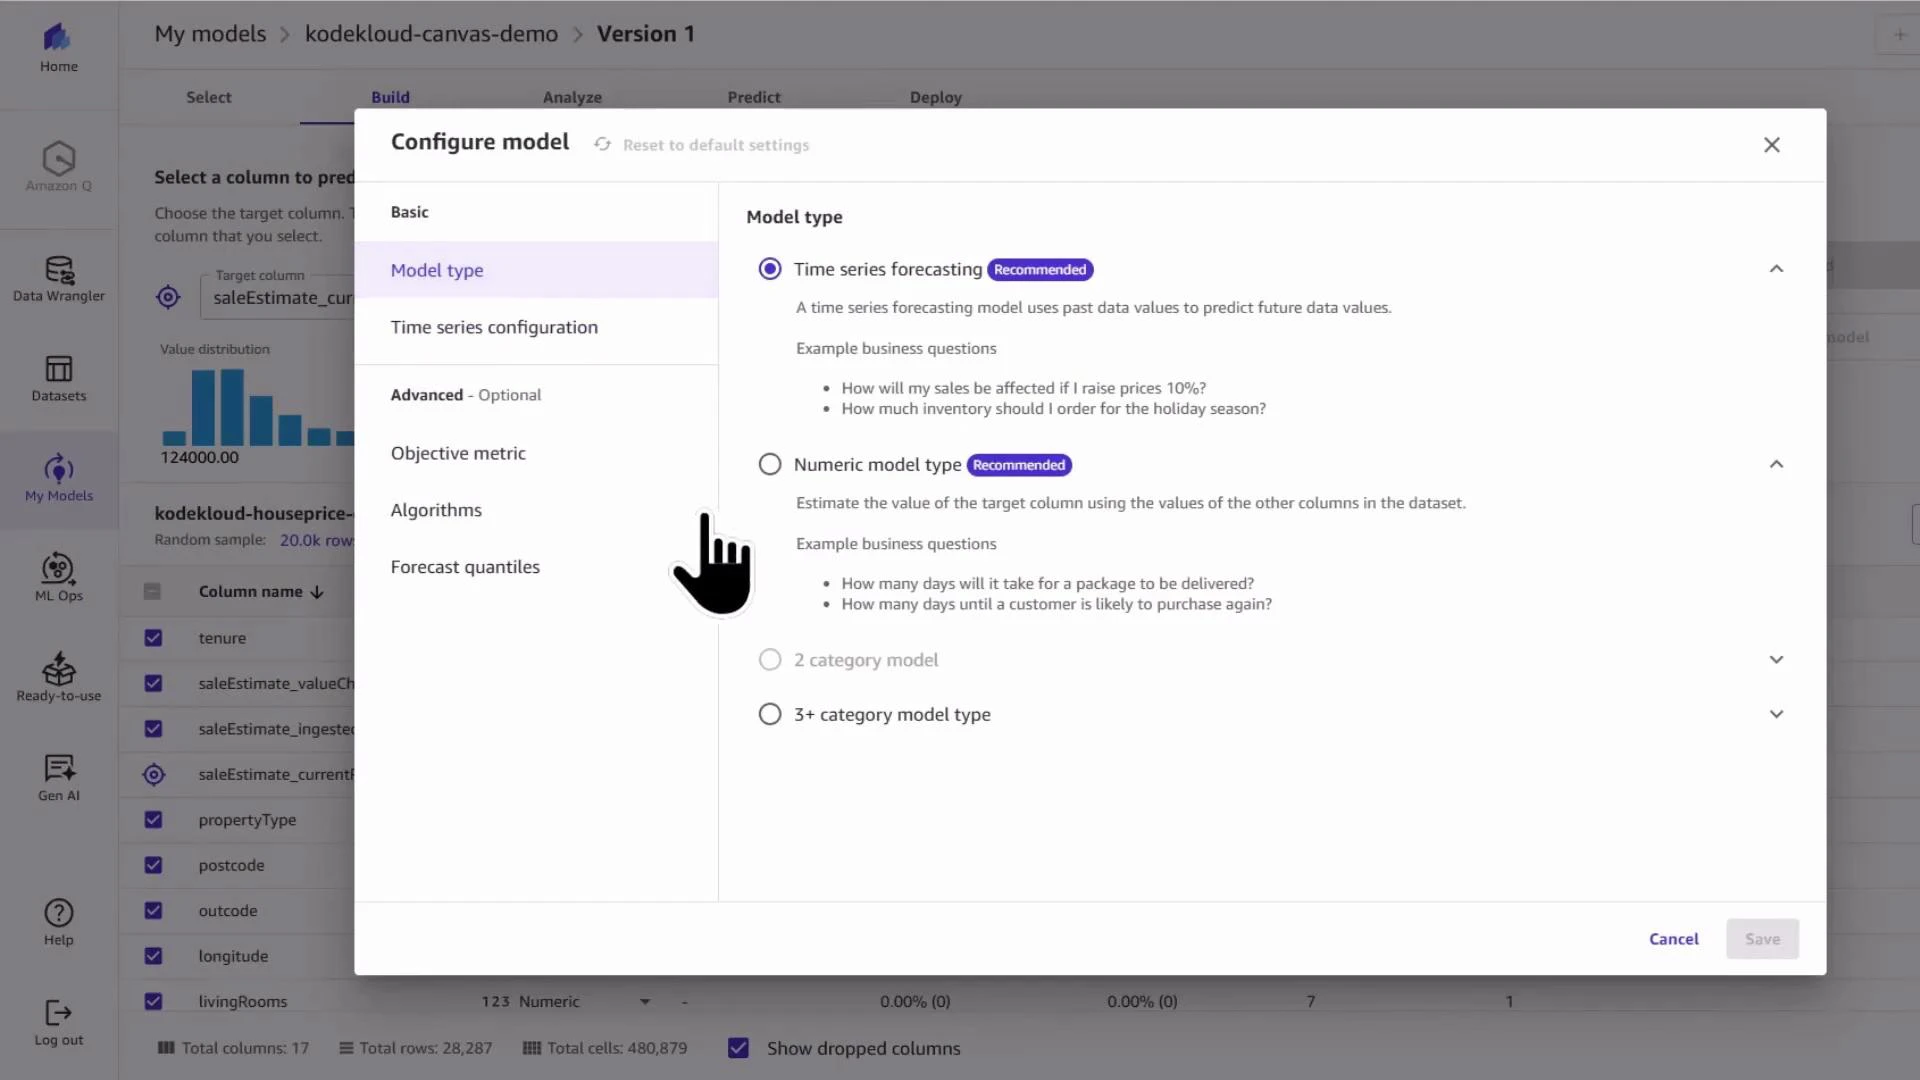
Canvas AutoML can misidentify the problem type when time-related columns exist. Explicitly choose numeric/regression when predicting continuous values.
Before training, review and include or exclude features. For housing data you might:
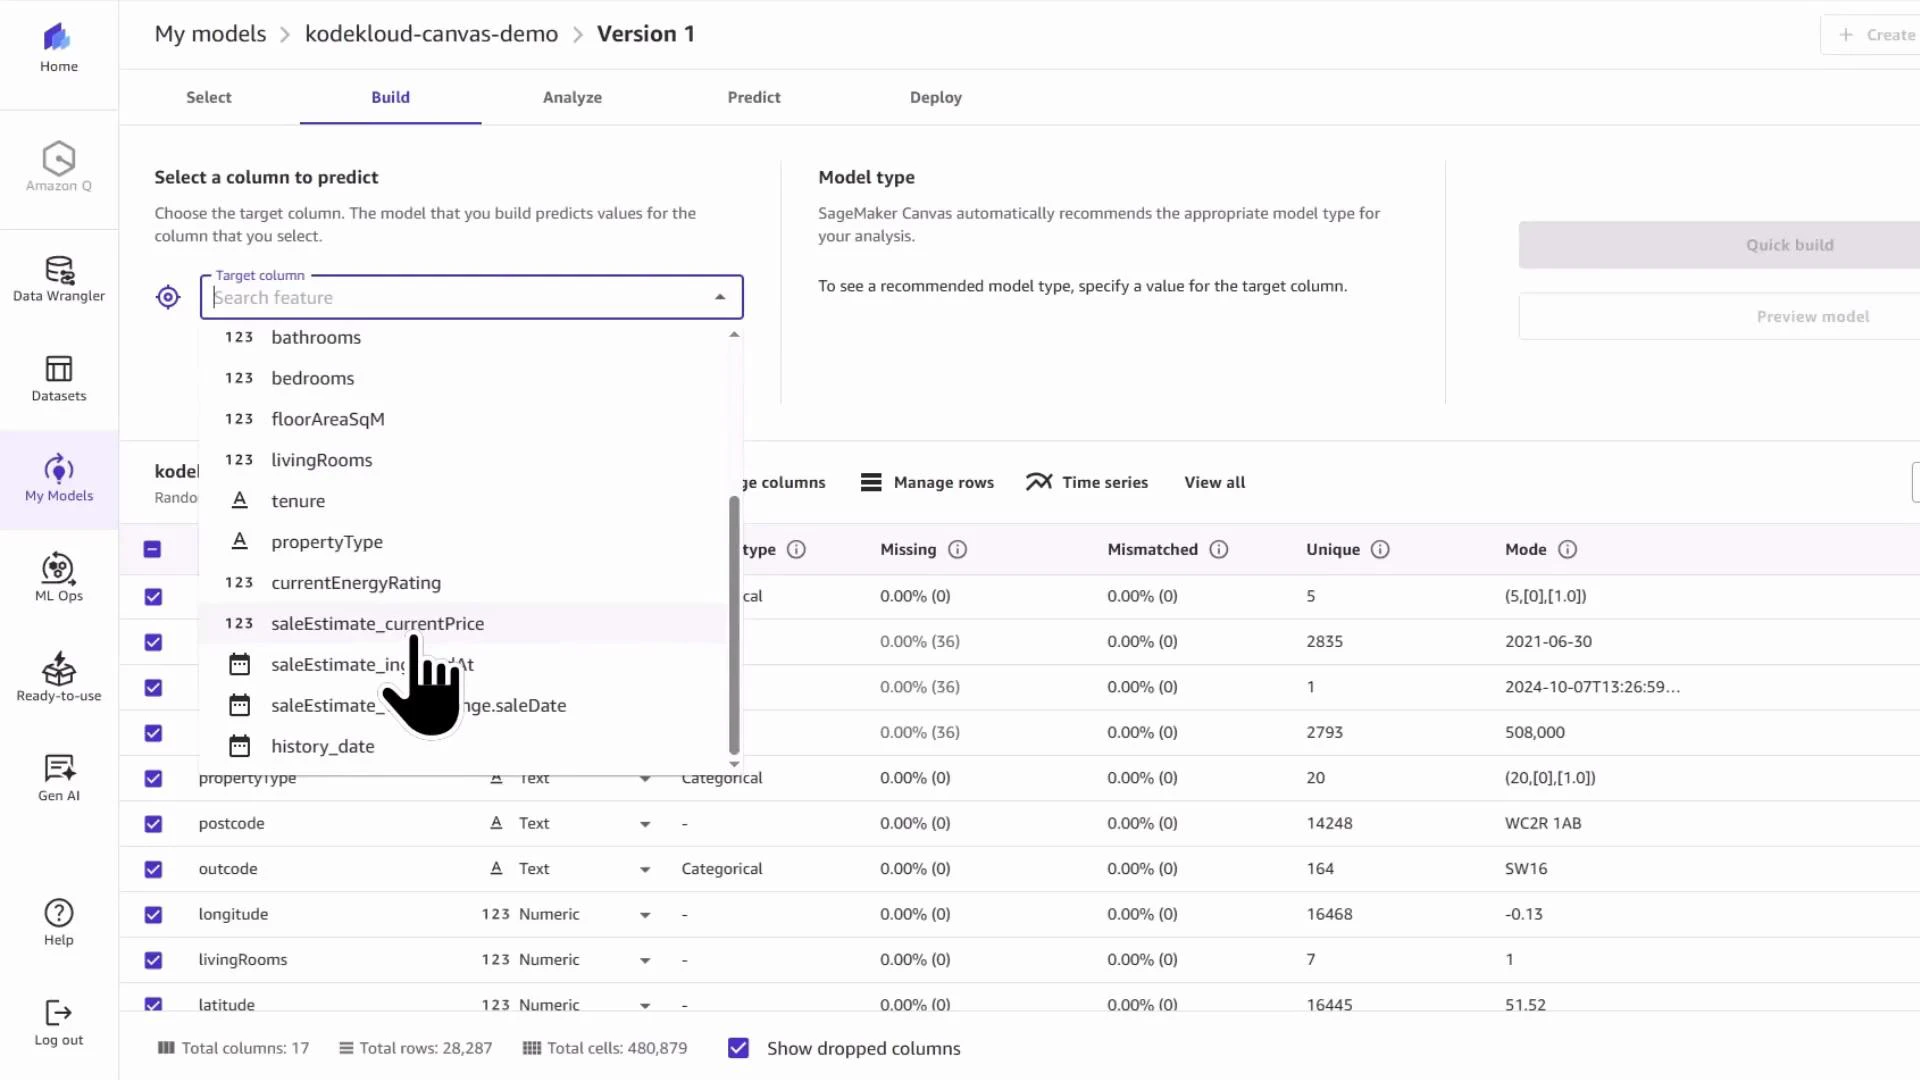
  • Exclude verbose free-text address fields.
  • Keep postcode prefix, latitude and longitude for geographic signals.
  • Keep numeric predictors such as bedrooms, bathrooms, energy rating, floor area, and tenure.
Canvas shows distributions for the selected target and per-feature summary statistics to aid quick exploratory decisions.
Screenshot of Amazon SageMaker Canvas in the Build view showing selection of a target column (saleEstimate_currentPrice) with a value-distribution histogram and a recommended numeric prediction model. The lower pane lists the kodekloud-houseprice-data dataset columns, data types, missing/mismatch stats and sample values.
When ready, click Quick Build. Canvas will run preprocessing (including any additional transforms you chose) and start a training job. Preprocessing may take a few minutes.
A screenshot of Amazon SageMaker Canvas showing dataset preprocessing for "Version 1," with the target column "saleEstimate_currentPrice" selected and a value distribution chart. The lower pane lists dataset columns and their types, missing values, and other summary statistics.

3 — Inspect the underlying SageMaker training job

Canvas creates a standard SageMaker training job under the hood. You can monitor it from SageMaker Studio → Jobs → Training to inspect hyperparameters, input channels, and output artifacts. This transparency helps you reproduce or customize runs later via the SDK. Example job status overview:
Status: Executing
Click into the training job to review artifact channels and generated outputs.
A dark-themed AWS SageMaker Studio screenshot showing a training job details page (Artifacts tab selected) for a Canvas job. The main panel lists input artifacts (channels like "train" and "feature-specification") and an output artifacts section, with the left navigation menu visible.

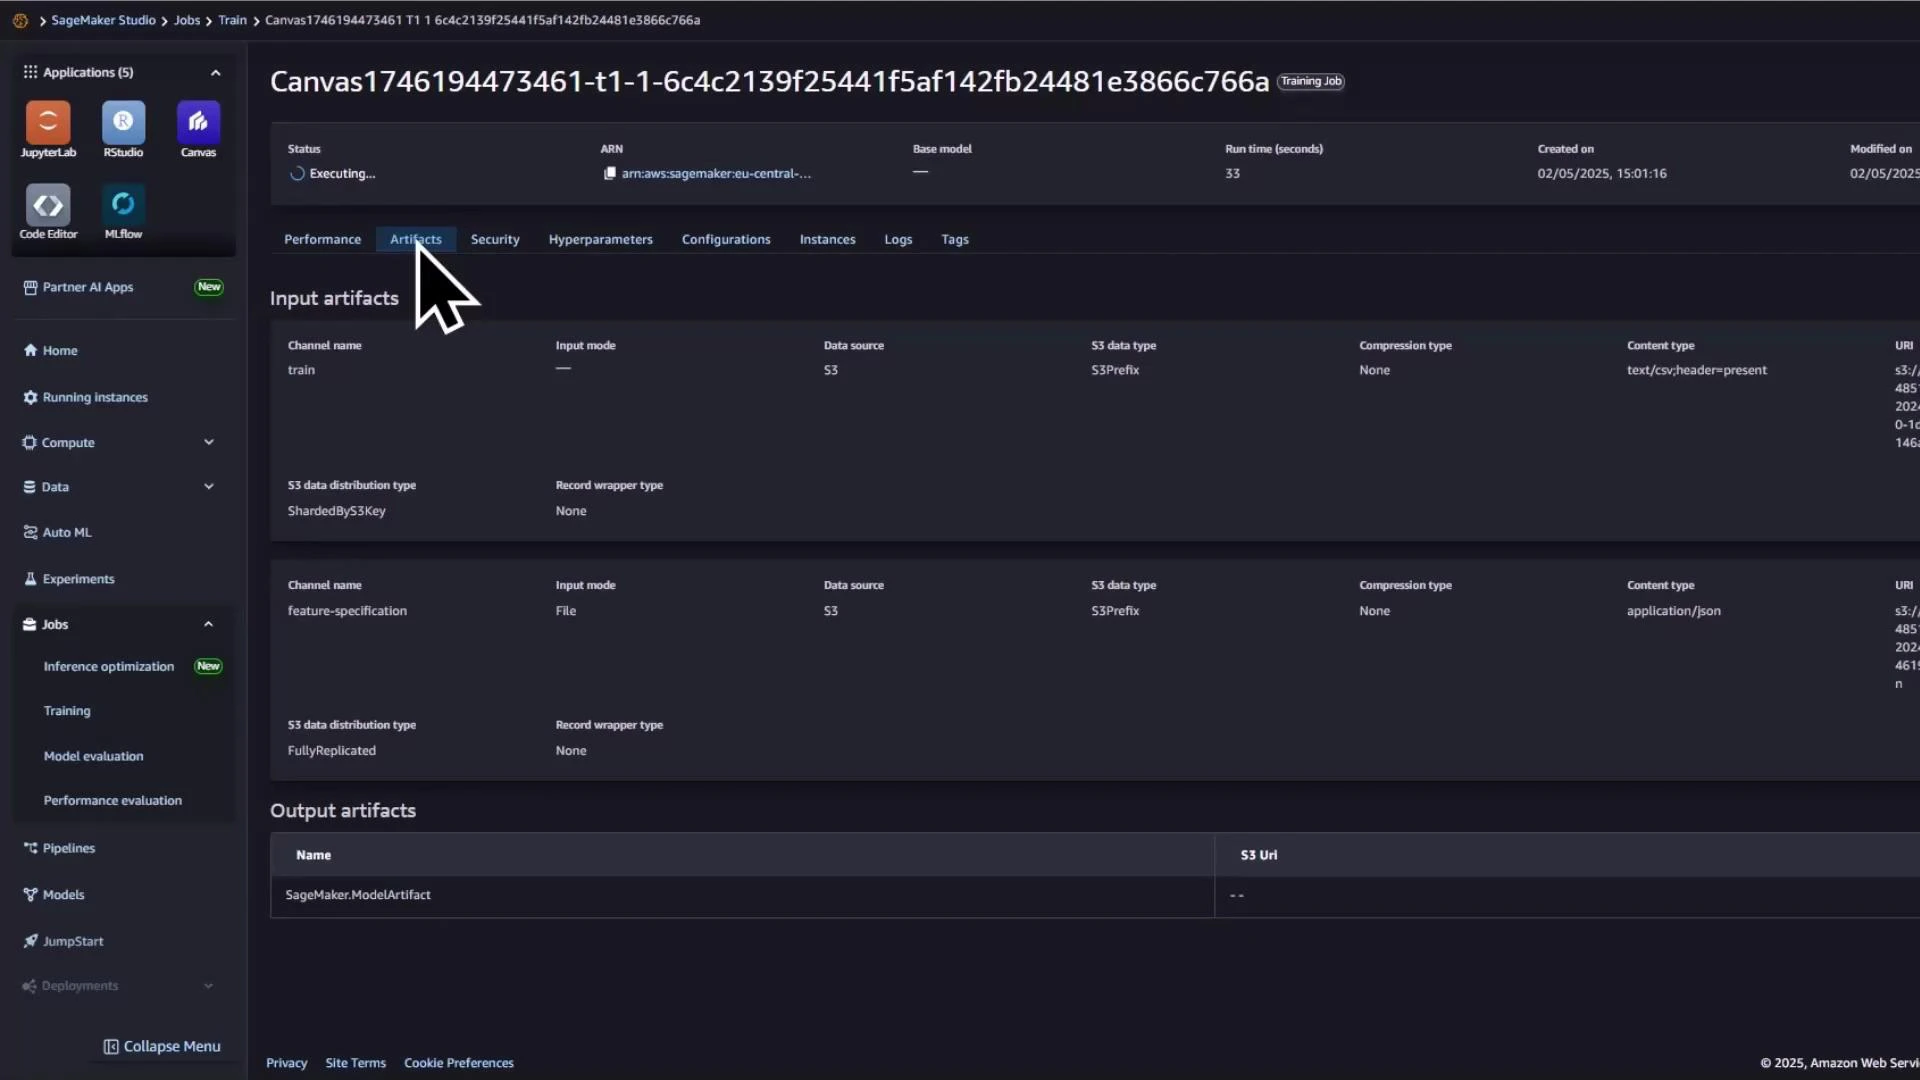
4 — Review metrics, feature importance, and diagnosis

After Quick Build completes, Canvas surfaces performance metrics (RMSE, MSE) and feature attributions. A high RMSE indicates the model is not yet production-ready and suggests further iteration: handle outliers, transform the target (e.g., log transform), re-encode categories, add external features, or remove leakage.
A machine-learning model analysis dashboard showing performance metrics (RMSE 444,710.906; MSE 197,767,790,592) and a ranked column-impact list with features like longitude, floorAreaSqM, postcode, latitude, etc. To the right is a scatter plot titled "Impact of longitude on prediction of saleEstimate_currentPrice" showing points of longitude versus impact on prediction.
Use feature importance and per-feature impact plots to prioritize feature-engineering efforts. Common next steps to improve a Canvas AutoML model:
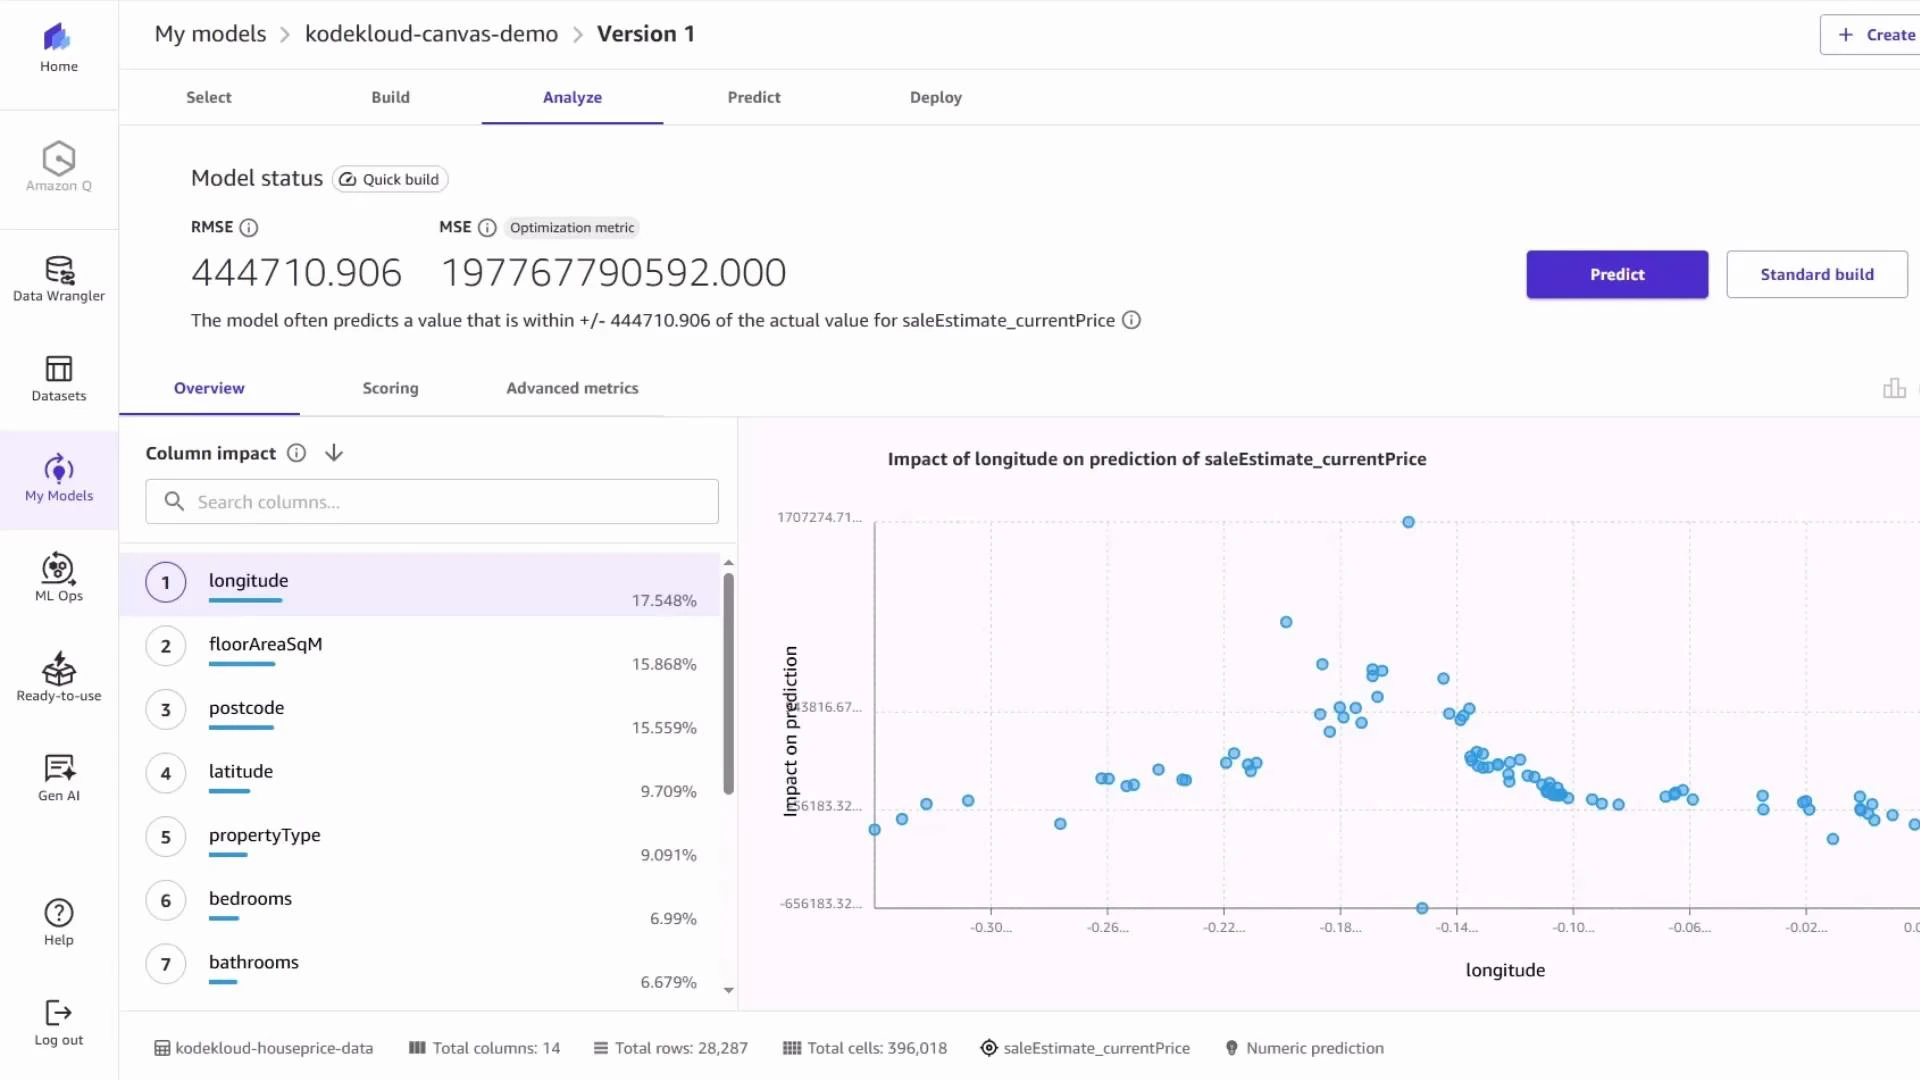
  • Remove or treat extreme outliers.
  • Log-transform skewed targets.
  • Create interaction features (e.g., bedrooms × floor area).
  • Add external geographic or neighborhood statistics.
  • Re-check training/test splits for leakage.

5 — Test predictions (single and batch)

Even if the RMSE is high, you can still exercise the model with single-record or batch predictions to validate end-to-end behavior. Example single prediction input (London property):
A web dashboard for a property price model showing input fields (address, postcode, country, latitude/longitude, bathrooms, bedrooms) on the left and a predicted sale price of 683,601.125 on the right. The panel is in "Single prediction" mode and compares the new prediction with the last one.
In this example the model predicted £683,601 for the sample input. Because the model’s RMSE is large, treat such predictions as exploratory until the model is improved and validated.

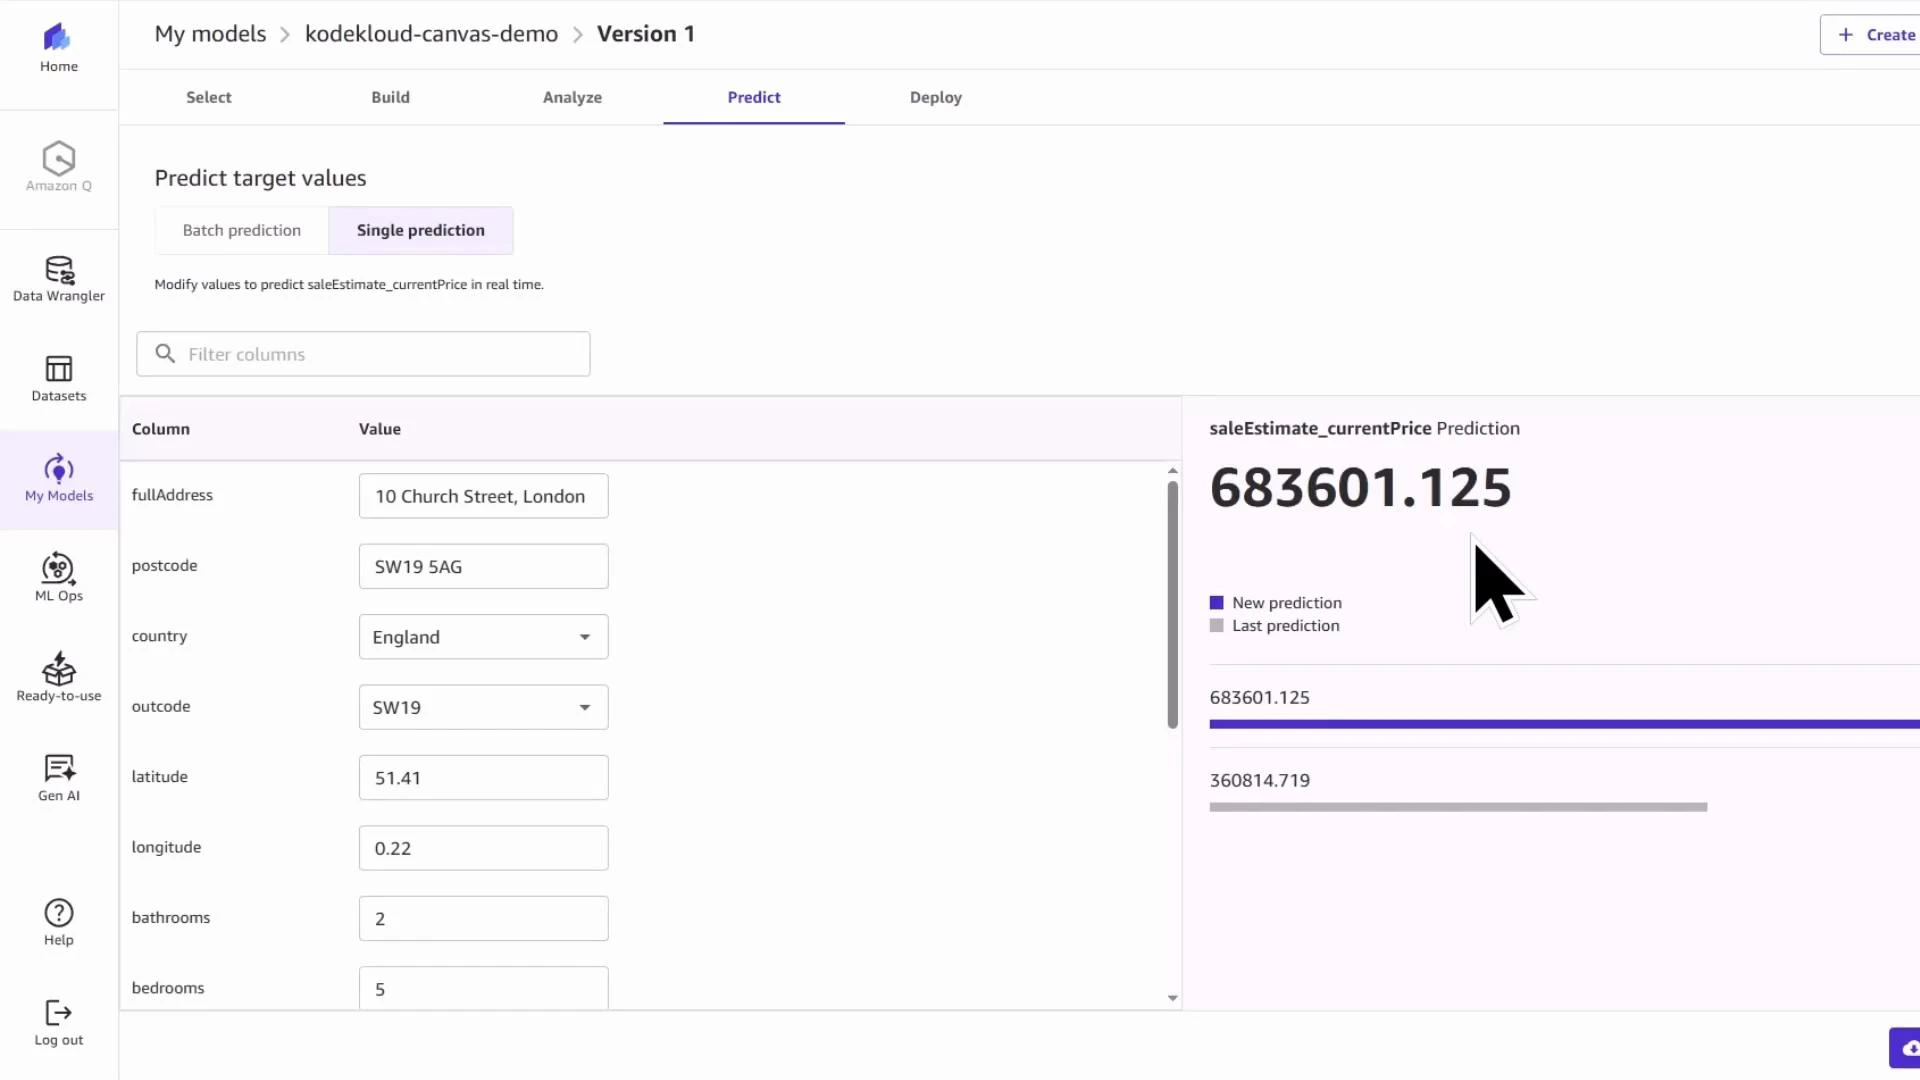
6 — Deploy to a SageMaker endpoint (when ready)

When model performance meets your acceptance criteria, Canvas supports direct deployment to a hosted SageMaker endpoint. Choose Create deployment, provide a deployment name and select instance size to create a real-time inference endpoint.
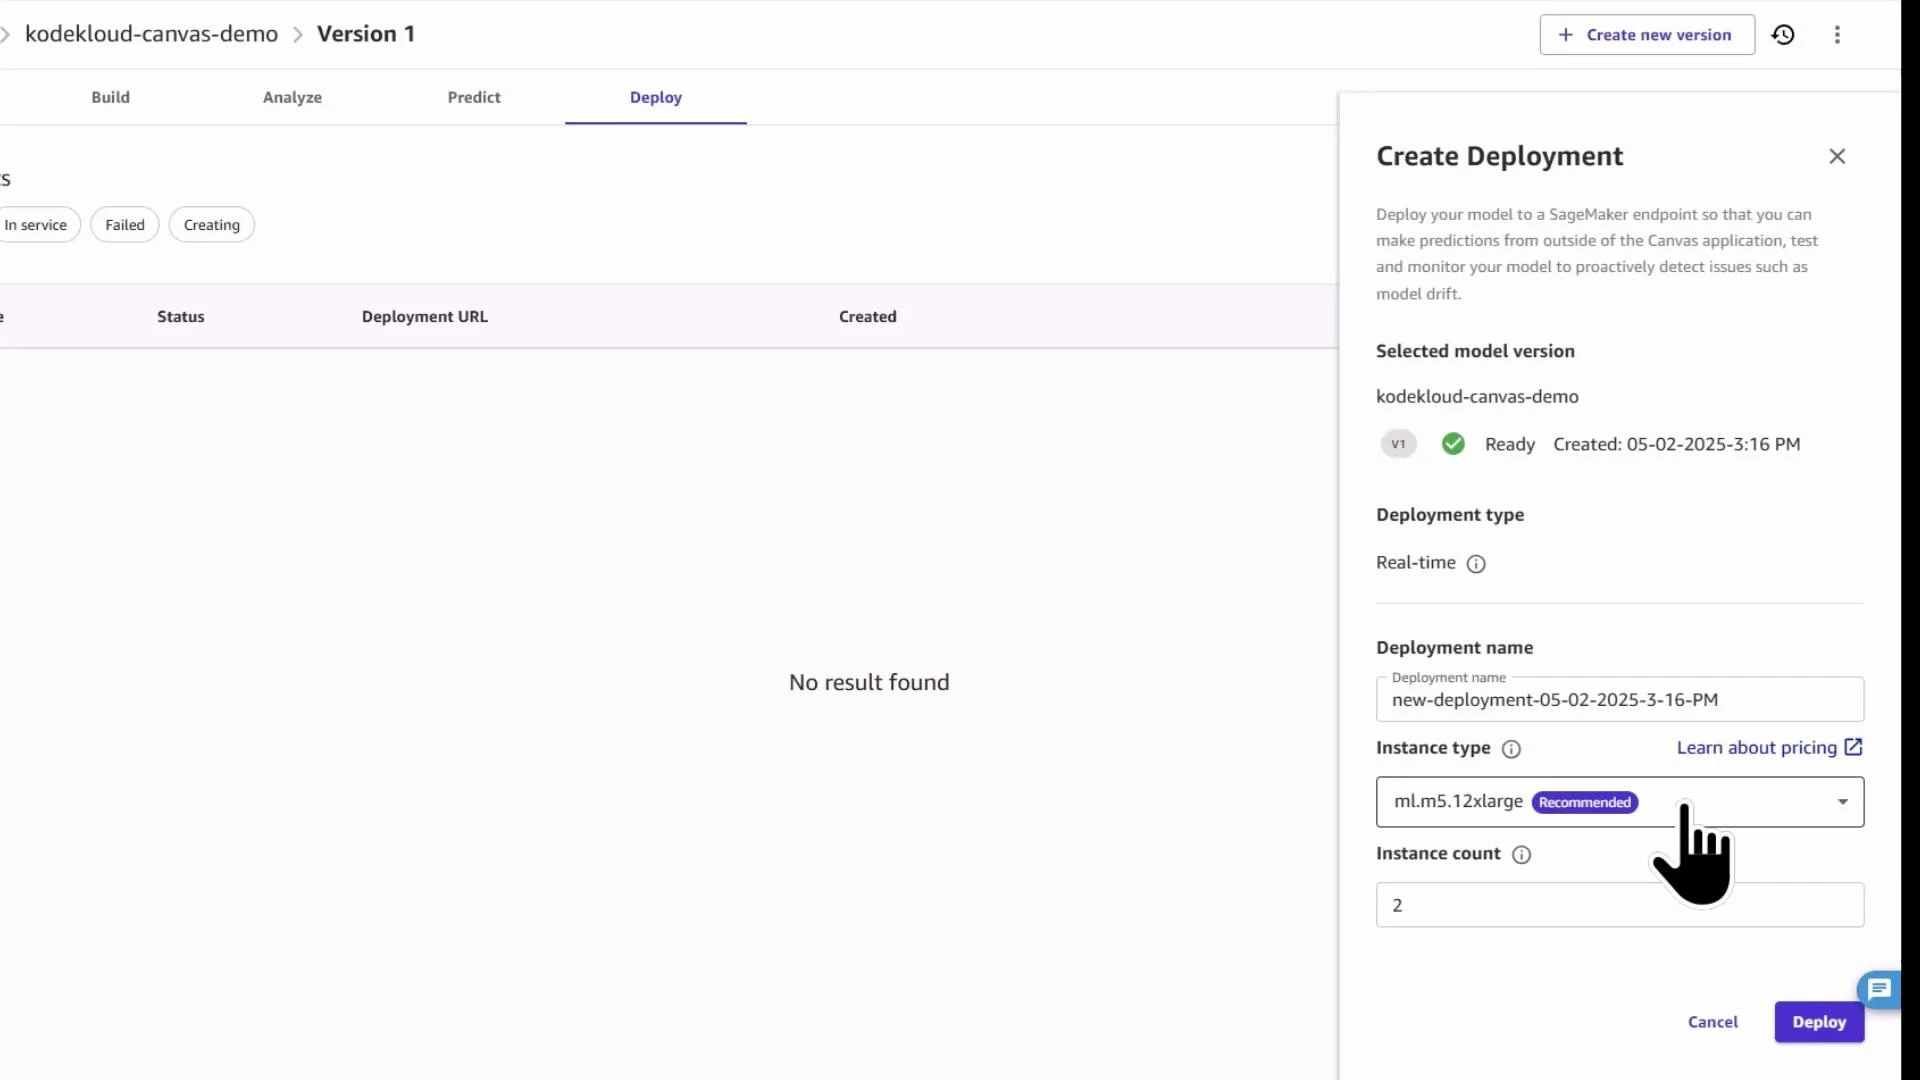
A web application screen showing a "Create Deployment" panel for deploying a model (selected model version, deployment type, instance type and count) with a Deploy button. The main page area is empty and displays "No result found."
Use Canvas deployments for quick serving and integration; for advanced production requirements (A/B testing, autoscaling, monitoring), integrate the Canvas artifacts into SageMaker Studio pipelines or the SDK.

Quick reference

StepPurposeRecommended action
Verify datasetEnsure preprocessing from Data Wrangler is correctCheck columns, types, and sample values in Canvas
Select model typeEnsure appropriate modeling approachExplicitly choose numeric/regression for continuous targets
Feature selectionReduce noise and leakageExclude free-text address; keep geolocation and key numeric variables
Quick BuildRun AutoML trainingReview preprocessing and training artifacts in Studio
DiagnoseImprove model qualityUse RMSE, feature importance, transforms, and external features
DeployServe predictionsCreate a Canvas deployment for quick endpoints; use Studio/SDK for advanced flows

Summary

  • Feed a Data Wrangler–processed dataset into SageMaker Canvas to speed model prototyping.
  • Set the correct problem type (numeric/regression) and review feature inclusion.
  • Use Quick Build to run Canvas AutoML, then inspect the generated SageMaker training job.
  • Evaluate metrics (RMSE/MSE) and feature importance to guide iterative improvements.
  • Test single or batch inference; deploy via Canvas when satisfied.
Further reading and references A future article will demonstrate how to use SageMaker processing jobs with Studio and the SDK to implement repeatable, production-ready preprocessing, data validation, and model training pipelines.

Watch Video