This hands-on demonstration shows how to add data-quality monitoring to a deployed SageMaker model using SageMaker Model Monitor. You’ll create a baseline job that computes statistics and suggested constraints for a baseline dataset, enable data capture on an endpoint, schedule a monitoring job that compares captured inference data to the baseline, generate inference traffic to populate capture, and inspect results. Goals:
  • Create a baseline for data quality using Model Monitor.
  • Deploy an endpoint with data capture enabled (sample inference requests/responses).
  • Schedule a monitoring job that compares captured data with the baseline.
  • Generate inference traffic to exercise data capture.
  • Inspect results and clean up resources when finished.
This demo is designed to run inside a SageMaker Studio Jupyter notebook.
A screenshot of an Amazon SageMaker JupyterLab interface showing a file browser on the left and a launcher on the right with Notebook, Console, and Other options. A cursor hovers over a notebook file named "house_price_model_monitor_demo_with_capture.ipynb" in the file pane.
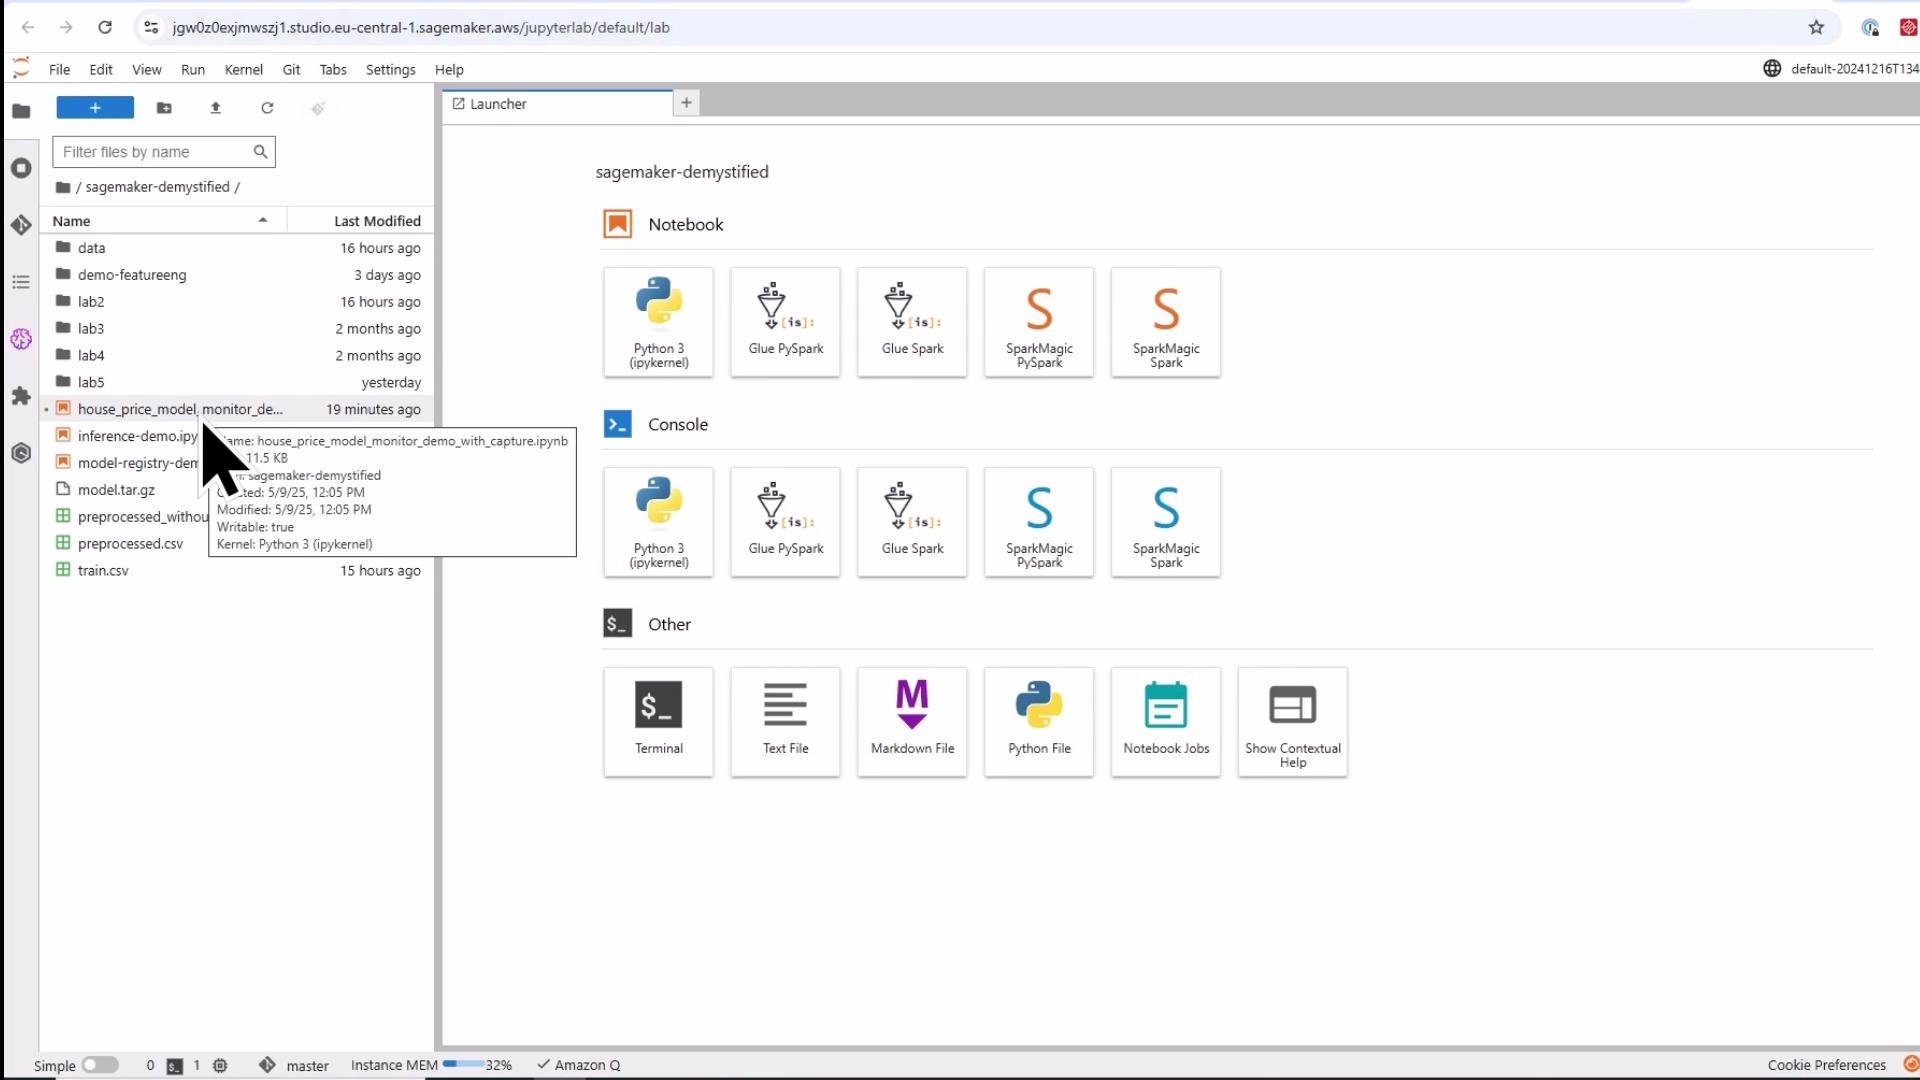
Prerequisites: run this notebook inside SageMaker Studio or an environment with the SageMaker Python SDK, boto3, and pandas installed. Ensure the executing IAM role has permissions for SageMaker, S3, and IAM (to create model/endpoint and read/write S3).

Overview of steps

  1. Setup imports, session, and S3 locations.
  2. Upload model artifact and prepare baseline data.
  3. Create an endpoint with Data Capture enabled.
  4. Create a DefaultModelMonitor and run a baseline job.
  5. Create a monitoring schedule.
  6. Generate inference traffic to produce captured data.
  7. Inspect captured data in S3.
  8. Clean up resources.

1) Setup: imports, session, S3 locations

Start by importing required SDKs and creating session/role variables. These values are used throughout the demo to manage S3 locations, create models/endpoints, and schedule monitoring.
# python
import sagemaker
from sagemaker import get_execution_role, Session

import boto3
import datetime
import pandas as pd

sagemaker_session = sagemaker.Session()
role = get_execution_role()
region = sagemaker_session.boto_region_name
s3_bucket = sagemaker_session.default_bucket()
s3_prefix = 'demo-model-monitor'

endpoint_name = 'endpoint-for-modelmonitor-demo'
Tip: choose a unique endpoint name for production usage to avoid collisions with other tests.

2) Upload model artifact and prepare baseline data

If your model artifact is already in S3, skip the upload step. Otherwise, upload your local model.tar.gz. Model Monitor expects you to explicitly specify the dataset format; in this demo we upload a CSV baseline without a header (the demo uses the training data as a baseline — in production, prefer representative inference traffic).
# python
# Upload the model artifact to S3
local_model_path = 'model.tar.gz'
model_s3_uri = sagemaker_session.upload_data(local_model_path, bucket=s3_bucket, key_prefix=s3_prefix)
print(f"Model artifact uploaded to: {model_s3_uri}")

# Prepare the CSV baseline (remove header if present)
df = pd.read_csv('preprocessed.csv')  # assumes a header exists
df.to_csv('preprocessed_without_header.csv', header=False, index=False)

# Upload the baseline/training data to S3
train_s3_uri = sagemaker_session.upload_data('preprocessed_without_header.csv', bucket=s3_bucket, key_prefix=s3_prefix)
print(f"Training data uploaded to: {train_s3_uri}")
Artifacts produced in S3 (examples):
ResourceExample S3 path
Model artifacts3:////model.tar.gz
Baseline CSVs3:////preprocessed_without_header.csv

3) Create endpoint with data capture enabled

Create a DataCaptureConfig to capture request and response payloads. Deploy the model with that configuration so inference traffic is sampled and stored to S3 for downstream monitoring.
# python
from sagemaker.model import Model
from sagemaker.model_monitor import DataCaptureConfig

# Configure data capture (capture both REQUEST and RESPONSE at 100% sampling)
data_capture_config = DataCaptureConfig(
    enable_capture=True,
    sampling_percentage=100,
    destination_s3_uri=f's3://{s3_bucket}/{s3_prefix}/data-capture',
    capture_options=['REQUEST', 'RESPONSE']
)

# Retrieve a container image URI for the (Linear Learner) algorithm
container_image_uri = sagemaker.image_uris.retrieve(framework='linear-learner', region=region)
print(f"SageMaker Linear Learner Image URI: {container_image_uri}")

model_artifact = f's3://{s3_bucket}/{s3_prefix}/model.tar.gz'

model = Model(
    image_uri=container_image_uri,
    model_data=model_artifact,
    role=role
)

predictor = model.deploy(
    initial_instance_count=1,
    instance_type='ml.m5.large',
    endpoint_name=endpoint_name,
    data_capture_config=data_capture_config
)
The deploy call creates the model, endpoint configuration, and endpoint. Verify in the SageMaker console that data capture is enabled and targets the S3 prefix you specified.
A screenshot of the Amazon SageMaker console showing the endpoint configuration page for "endpoint-for-modelmonitor-demo." It displays data-capture settings (enabled, 100% sampling, S3 location) and variant/production model details including instance type.

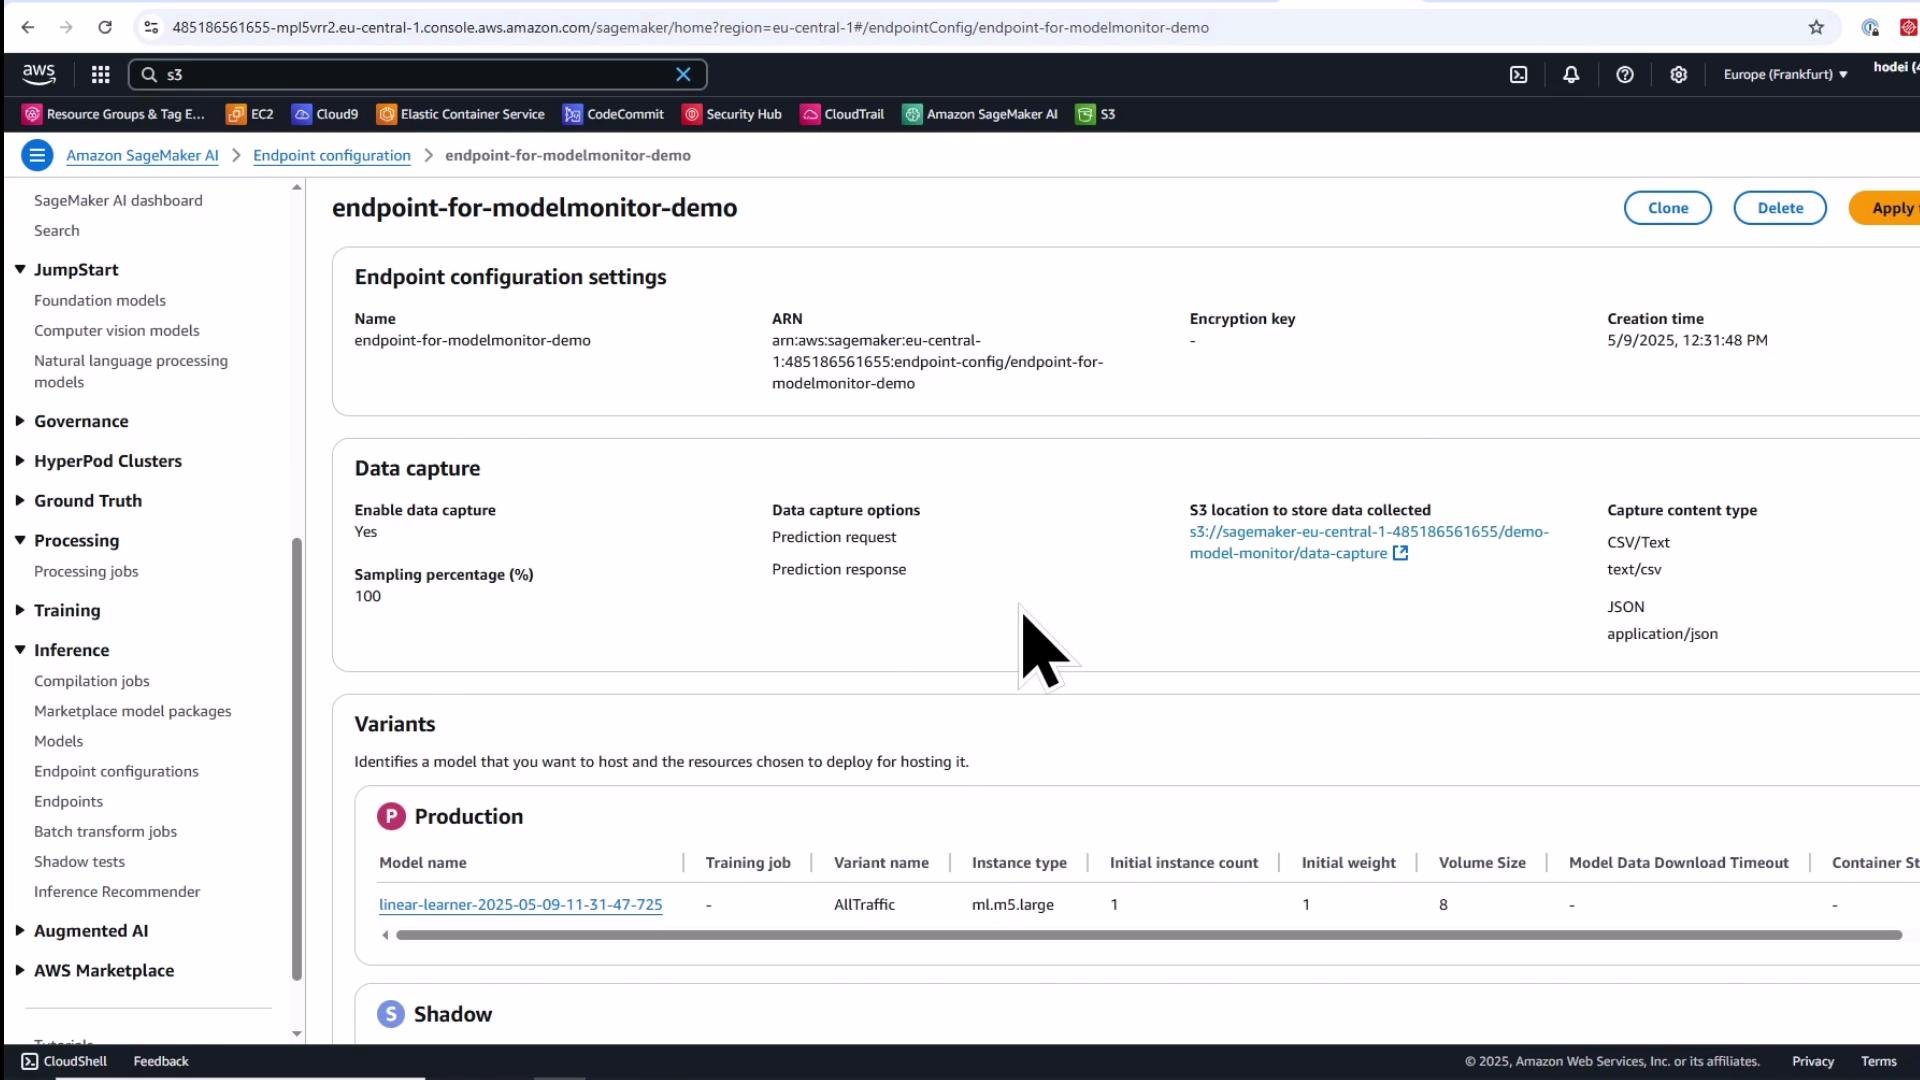
4) Create a DefaultModelMonitor and run a baseline job

A baseline job computes statistics and suggested constraints (constraints.json) from a baseline dataset. These artifacts define the expected distribution and data-quality checks for later scheduled monitoring.
# python
from sagemaker.model_monitor import DefaultModelMonitor

monitor = DefaultModelMonitor(
    role=role,
    instance_count=1,
    instance_type='ml.m5.large',
    volume_size_in_gb=20
)

baseline_job_name = 'house-price-baseline-' + datetime.datetime.now().strftime('%Y-%m-%d-%H-%M-%S')
baseline_data_uri = f's3://{s3_bucket}/{s3_prefix}/preprocessed_without_header.csv'

monitor.suggest_baseline(
    baseline_dataset=baseline_data_uri,
    dataset_format={'csv': {'header': False}},
    output_s3_uri=f's3://{s3_bucket}/{s3_prefix}/baselining',
    wait=True,
    job_name=baseline_job_name
)
Outcome:
  • S3 output (under the baselining prefix) includes:
    • statistics.json — per-feature statistics (mean, min, max, percentiles, distribution buckets)
    • constraints.json — suggested constraints for data quality (e.g., completeness, bounds)
Model Monitor runs these analyses using a specialized processing container (the Model Monitor analyzer). Inspect the JSON files in S3 to review statistics and suggested constraints.

5) Create a monitoring schedule

Create a monitoring schedule to run regularly and compare the captured inference data with the baseline statistics and constraints. The schedule can run daily, hourly, or follow a custom cron expression.
# python
from sagemaker.model_monitor import CronExpressionGenerator

schedule_name = 'house-price-monitor-schedule'

monitor.create_monitoring_schedule(
    monitor_schedule_name=schedule_name,
    endpoint_input=endpoint_name,
    output_s3_uri=f's3://{s3_bucket}/{s3_prefix}/monitoring-output',
    statistics=monitor.baseline_statistics(),
    constraints=monitor.suggested_constraints(),
    schedule_cron_expression=CronExpressionGenerator.daily(),
)

# Print the schedule details via the SDK
print(monitor.describe_schedule())
You can also get a compact schedule summary via boto3:
# python
client = boto3.client('sagemaker')
response = client.describe_monitoring_schedule(MonitoringScheduleName=schedule_name)

print("Status:", response.get('MonitoringScheduleStatus'))
expr = response.get('MonitoringScheduleConfig', {}).get('ScheduleConfig', {}).get('ScheduleExpression')
print("Schedule Expression:", expr)
print("Last Run:", response.get('LastMonitoringExecutionSummary', {}).get('ScheduledTime'))
Example output:
Status: Scheduled
Schedule Expression: cron(0 0 ? * * *)
Last Run: None
When the schedule runs it will:
  • Read .jsonl captured files from your data-capture S3 prefix.
  • Compute statistics for the captured dataset.
  • Compare these statistics against the baseline’s statistics and constraints.
  • Produce violation reports and monitoring output under the monitoring-output S3 prefix.

6) Generate inference traffic (to produce captured data)

Invoke the endpoint to produce request/response pairs that will be captured. Note that captured files are buffered and delivered to S3 periodically — expect a short delay before files appear.
Data capture delivery to S3 is not real-time. Expect a short delay (often a few minutes) before captured data appears in the S3 destination.
Example invocation (make sure the CSV format matches your model’s feature expectations):
# python
sagemaker_runtime = boto3.client('sagemaker-runtime')

# Example CSV input (must match the model's expected features)
input_data = '51.6215527,-0.2466031,2.0,6.0,517.0,3.0,289000.0,27.393649289299,255000.0,37.01298701298701,285000.0,1354000.0,1.0,0.0,1.0,0.0'

response = sagemaker_runtime.invoke_endpoint(
    EndpointName=endpoint_name,
    ContentType='text/csv',
    Body=input_data
)

prediction = response['Body'].read().decode('utf-8')
print(f'Predicted house price: {prediction}')
Sample response (algorithm-dependent):
Predicted house price: {"predictions":[{"score":1789161.25}]}
Send several requests if you want more captured data for monitoring jobs to analyze.

7) Inspect captured data in S3

After delivery, captured files are available under the data-capture S3 prefix as JSON Lines (.jsonl). Each line contains the request and response payloads (structured according to the capture options).
Screenshot of the AWS S3 console showing a Sagemaker bucket folder with one .jsonl object listed and a large mouse cursor pointer. The file was last modified May 9, 2025 and is 633.0 B in size.
The scheduled monitoring job will read these .jsonl files, compute statistics, compare them with the baseline statistics/constraints, and write violation reports and metrics to the monitoring output S3 prefix.

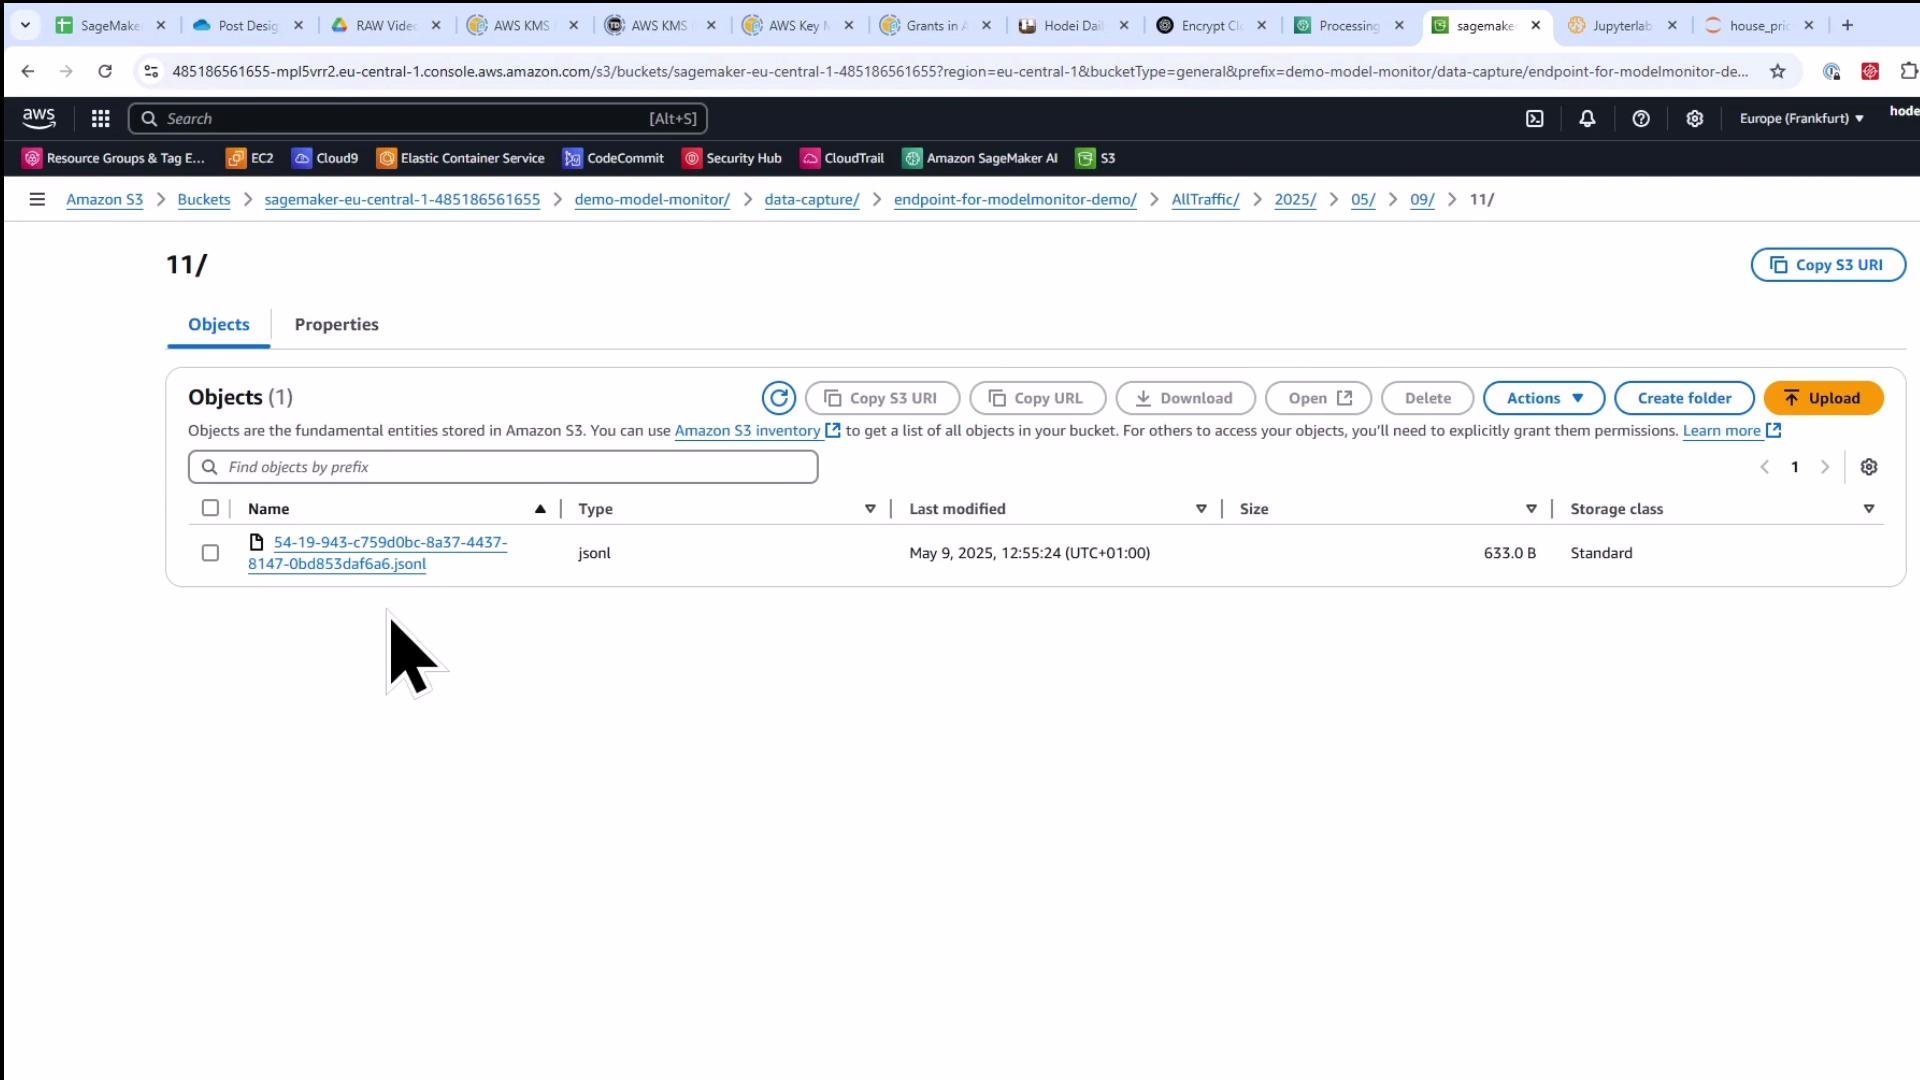
8) Clean up resources

When you finish the demo, delete the monitoring schedule and endpoint(s) to avoid ongoing charges. There can be a short propagation delay after deleting the schedule before you can delete the associated endpoint configuration — if deletion fails, wait a minute and retry.
# python
# Delete the monitoring schedule
client.delete_monitoring_schedule(MonitoringScheduleName=schedule_name)
print("Deleted monitoring schedule:", schedule_name)

# Delete endpoints and endpoint configs (be careful: this deletes all endpoints listed)
endpoints = client.list_endpoints(MaxResults=100)['Endpoints']

for ep in endpoints:
    ep_name = ep['EndpointName']
    print(f"Deleting endpoint: {ep_name}")

    # Describe endpoint to get the endpoint config name
    endpoint_desc = client.describe_endpoint(EndpointName=ep_name)
    endpoint_config_name = endpoint_desc['EndpointConfigName']

    # Delete endpoint
    client.delete_endpoint(EndpointName=ep_name)

    # Delete endpoint config
    print(f"Deleting endpoint config: {endpoint_config_name}")
    client.delete_endpoint_config(EndpointConfigName=endpoint_config_name)

print("Cleanup complete.")
Important: If you delete the monitoring schedule immediately before deleting endpoints, the endpoint-config relationship deletion may take a short time to propagate. If you receive an error, wait a minute and retry the endpoint/config deletion.

Summary and best practices

  • Baseline job: builds statistics and suggested constraints for a baseline dataset. Use representative inference traffic for best results in production.
  • Data capture: configure an endpoint to sample request/response payloads and store them in S3. Tune sampling percentage to balance cost and detection sensitivity.
  • Monitoring schedule: regularly compare captured inference data to baseline statistics/constraints to detect data quality drift and anomalies.
  • Model Monitor uses a dedicated processing container to compute statistics and constraints; the outputs are JSON artifacts you can inspect and version.
  • Production tips:
    • Use representative inference data for baselines (not necessarily training data).
    • Tune sampling and schedule frequency based on traffic volume and cost.
    • Add alerting or integration with your incident management for violations.
This completes the demonstration of adding SageMaker Model Monitor data-quality monitoring to a deployed endpoint. Explore additional Model Monitor features (model explainability, custom checks, multi-metric alerts) as needed.

Watch Video