Observability goes beyond collecting metrics and logs — it’s about understanding whether systems and ML models are behaving normally and producing correct outcomes. Good observability combines platform and infrastructure signals (for availability and latency) with model-centric signals (for data quality, drift, and fairness).
Overview
  • Ensure models continue to perform as expected in production.
  • Detect issues such as model drift, data-quality problems, and performance regressions.
  • Combine two complementary approaches:
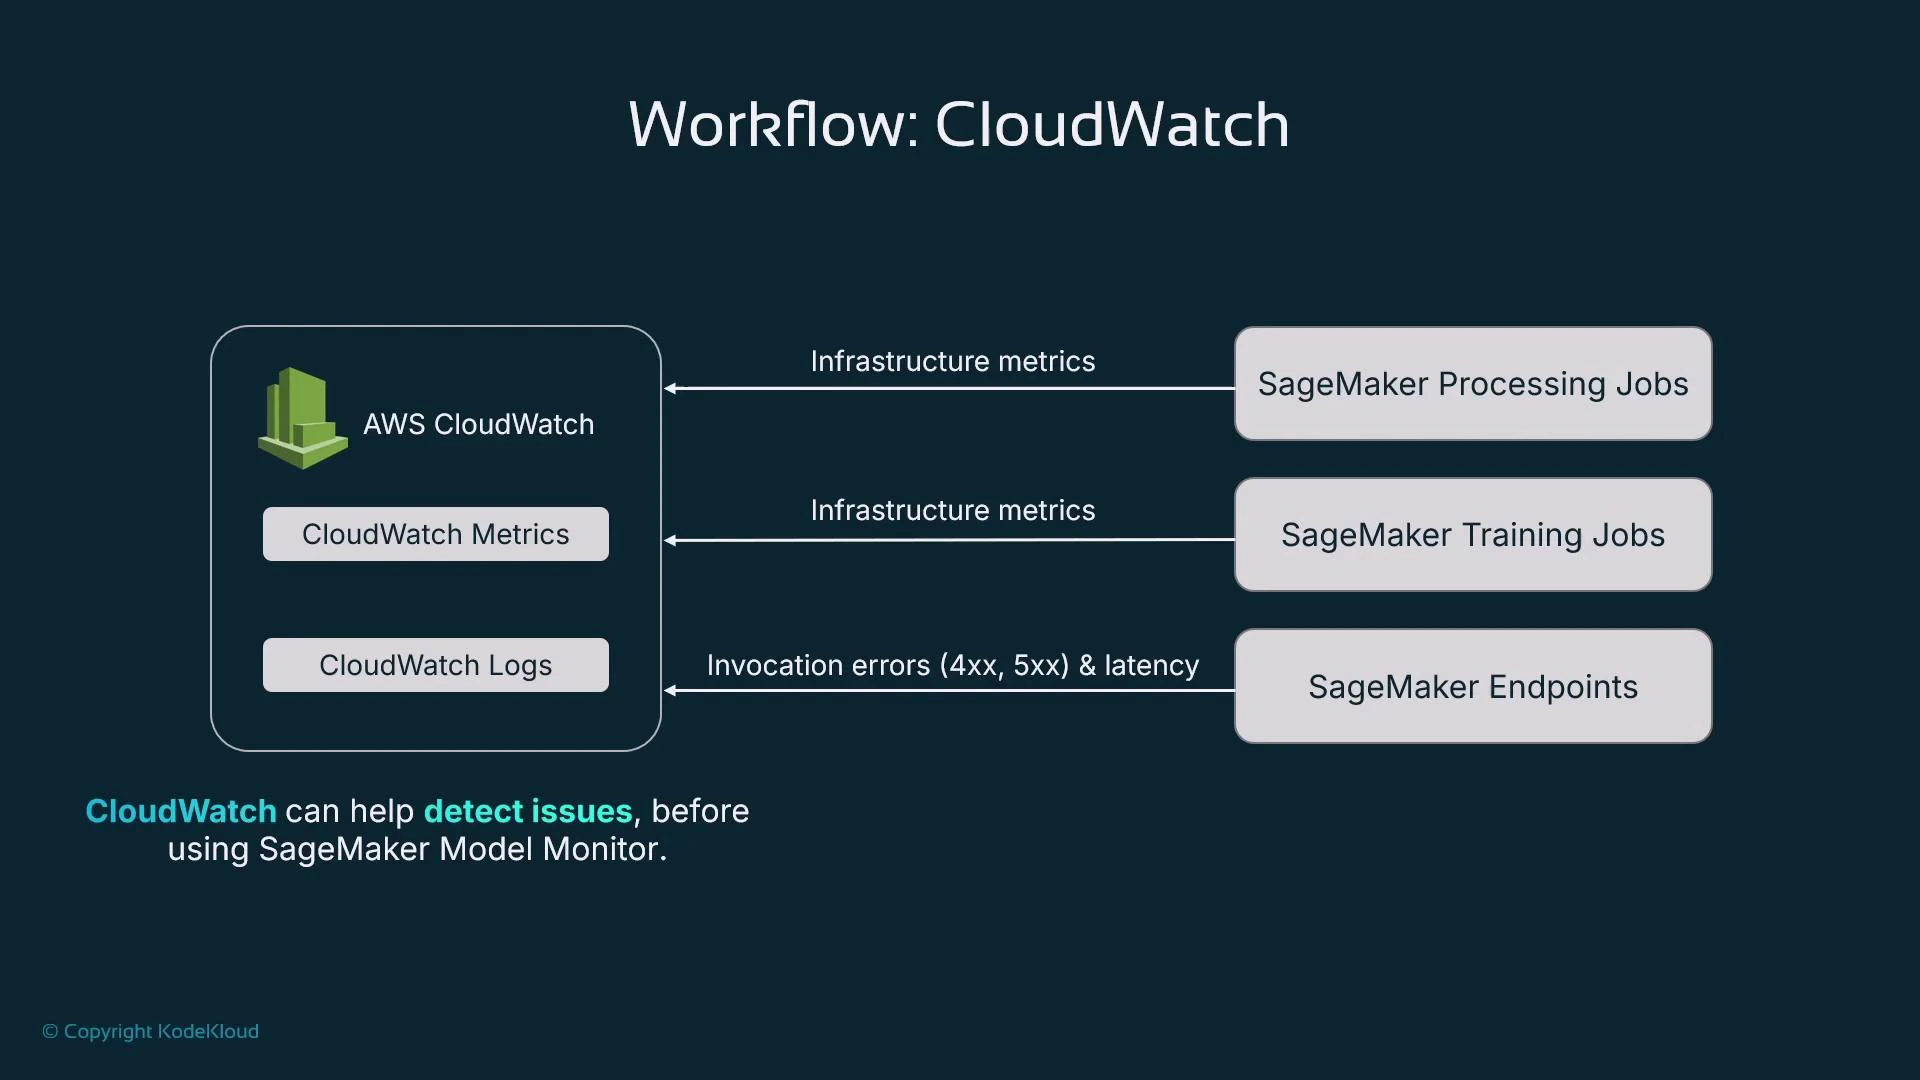
    1. AWS CloudWatch — infrastructure- and service-level metrics and logs.
    2. SageMaker Model Monitor — model-centric monitoring for data quality, drift, and bias.
We will examine how CloudWatch and SageMaker Model Monitor provide two perspectives on a deployed model: infrastructure health and model health. Two perspectives for determining if a model is working well
  1. Infrastructure health
  • A deployed model runs on managed compute (for example, a SageMaker endpoint). If the instance is undersized, inference can suffer from CPU/GPU/memory or I/O contention.
  • Monitor resource utilization and latency to ensure the deployment meets your SLA and scaling requirements.
  1. Model health
  • Beyond infrastructure: confirm the model continues to make correct predictions.
  • Detect distribution shifts by comparing inference inputs to the training data distribution (data drift).
  • Monitor predictions for biased outcomes across subgroups (for example, by demographic attributes).
  • Track feature attributions and model explainability signals to detect changes in what the model relies on.
To answer infrastructure-level questions use AWS CloudWatch. To answer model-behavior questions use SageMaker Model Monitor (or third-party monitoring). CloudWatch is always available for AWS-hosted resources because AWS services emit many metrics and logs automatically.
A diagram titled "Workflow: CloudWatch" showing AWS CloudWatch (CloudWatch Metrics and CloudWatch Logs) sending infrastructure metrics to SageMaker Processing and Training Jobs, and sending invocation errors (4xx, 5xx) and latency to SageMaker Endpoints. The slide notes that CloudWatch can help detect issues before using SageMaker Model Monitor.
CloudWatch costs can be negligible in test/dev but grow in production. Many models, multiple instance types, autoscaling, and high throughput increase metrics and logs volume — estimate throughput and budget for CloudWatch metrics, custom metrics, and log ingestion/retention.
AWS CloudWatch in the AWS Management Console In CloudWatch you’ll typically use two areas heavily for model hosting and training: Metrics and Logs. Metrics
  • The Metrics view displays time-series metrics emitted by AWS services in the selected region.
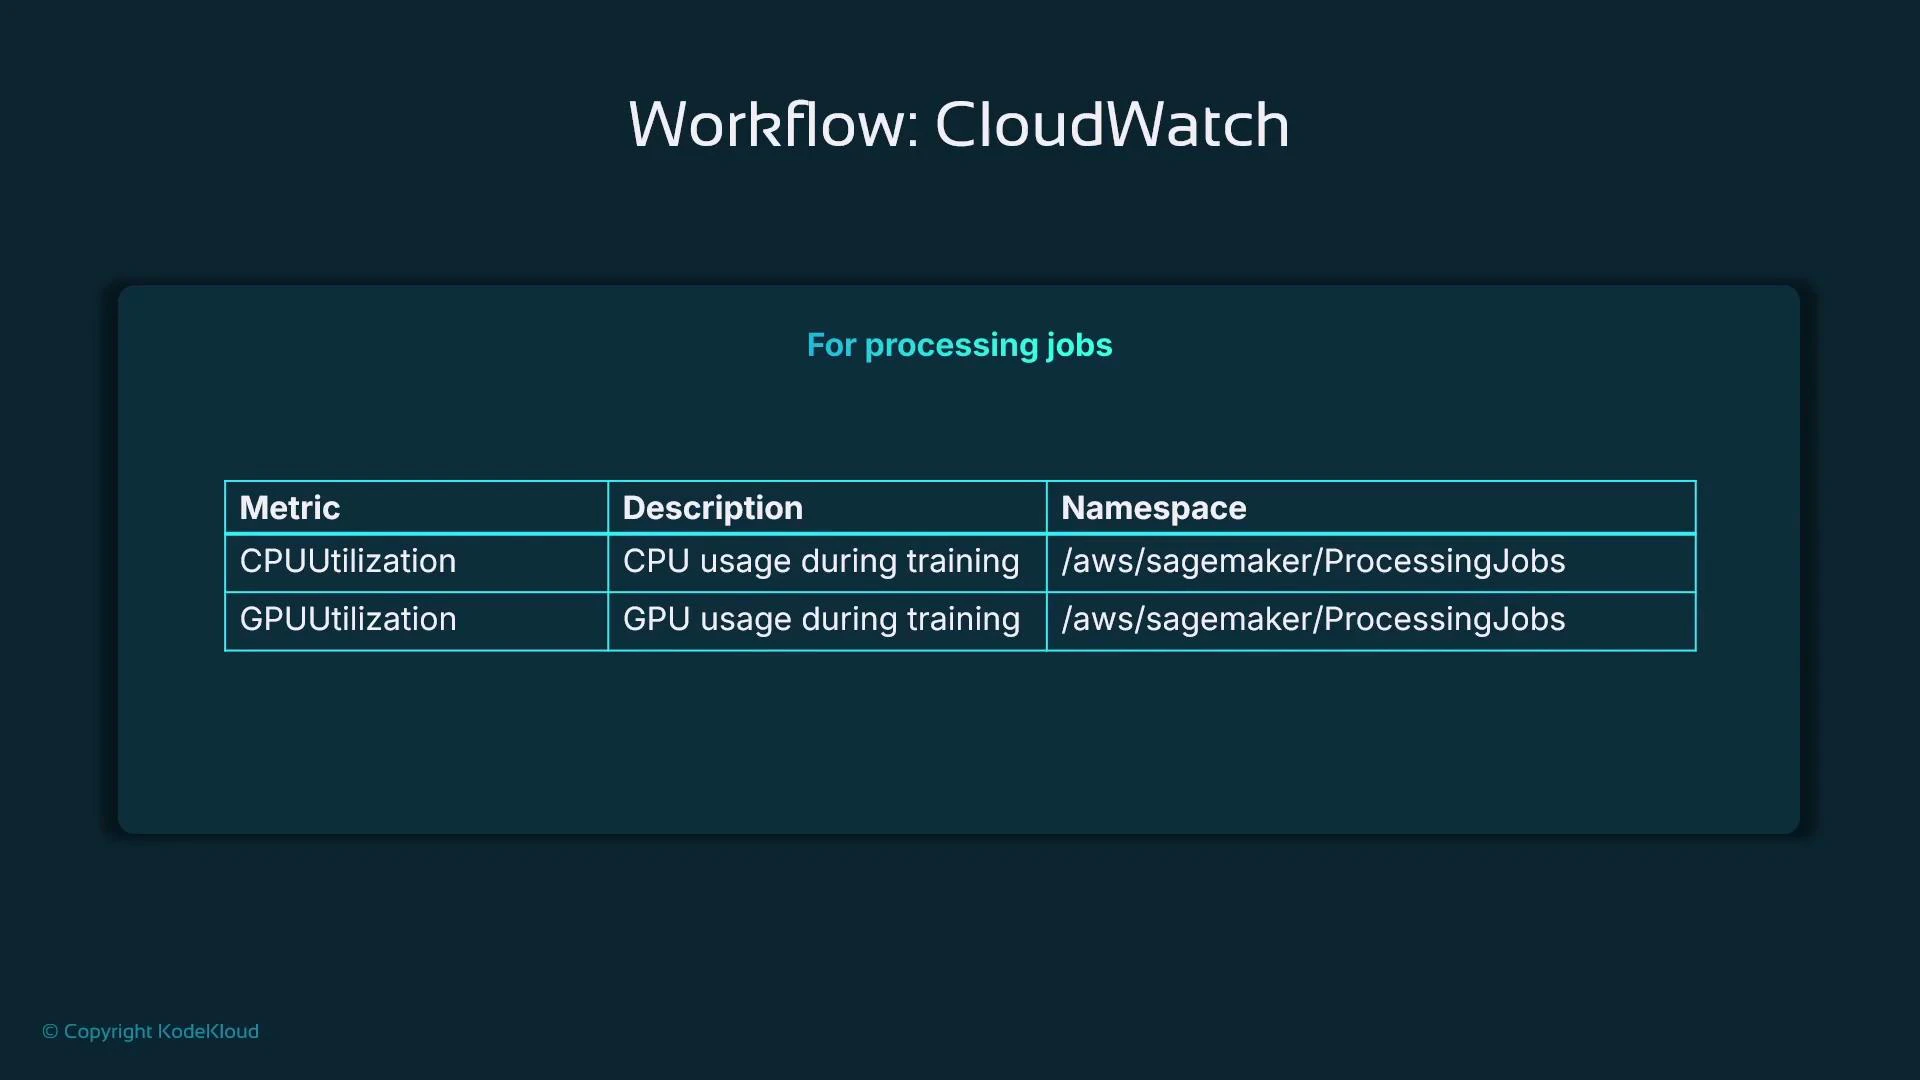
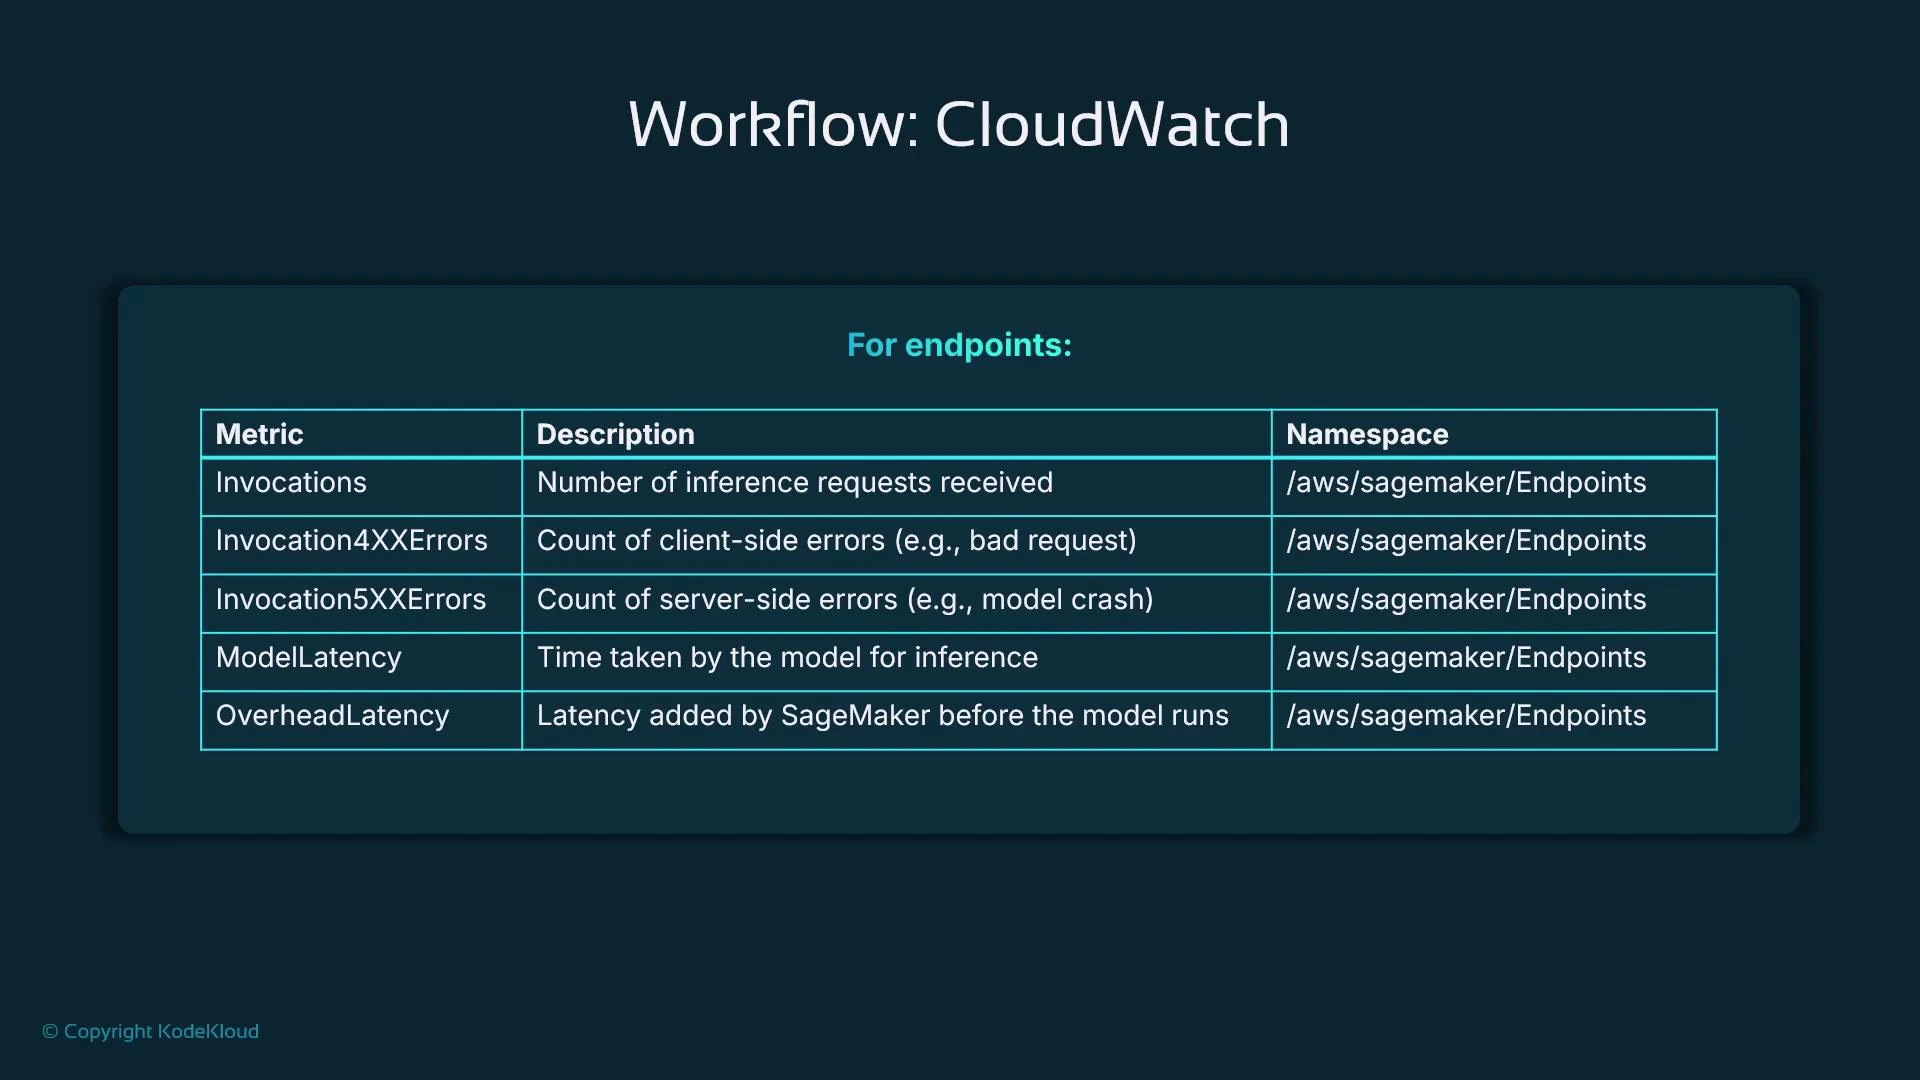
  • Metrics are organized into namespaces such as /aws/sagemaker/TrainingJobs. Learn namespace and metric naming so you can filter and chart relevant signals.
  • For SageMaker endpoints, training jobs, and processing jobs you can chart CPU, GPU, disk, invocation counts/errors, and latency. Use the UI to select metrics and zoom into time ranges for troubleshooting.
Common metrics by SageMaker resource
Resource TypeKey MetricsPurpose / Use Case
Endpoint (SageMaker)InvocationCount, Invocation4XXErrors, Invocation5XXErrors, ModelLatency, OverheadLatencyTrack traffic, detect client/server errors, isolate model vs system latency
Training jobCPUUtilization, GPUUtilization, DiskUtilizationValidate instance sizing (compute/GPU/memory/I/O) and detect bottlenecks
Processing jobCPUUtilization, GPUUtilization, DiskUtilization, InstanceCountTune instance type and determine if distributed processing is needed
Example: viewing endpoint metrics (region-specific)
  • Typical SageMaker endpoint metrics: CPUUtilization, MemoryUtilization (when available), InvocationCount, Invocation4XXErrors, Invocation5XXErrors, ModelLatency, and OverheadLatency.
  • Select one or more metrics in the console to plot trends and spikes over different time ranges.
Metrics for training jobs
  • CPUUtilization and GPUUtilization show whether the chosen instance type is appropriate. Very high GPU utilization may indicate a need for more GPUs or larger GPU instances.
  • DiskUtilization can reveal I/O bottlenecks and suggest different storage or instance families.
  • Note: memory utilization for some managed training jobs may not be available unless you install an agent or expose it explicitly.
A slide titled "Workflow: CloudWatch" showing a table of CloudWatch metrics for SageMaker training jobs — CPUUtilization, GPUUtilization, and DiskUtilization — all using the namespace /aws/sagemaker/TrainingJobs.
Metrics for processing jobs
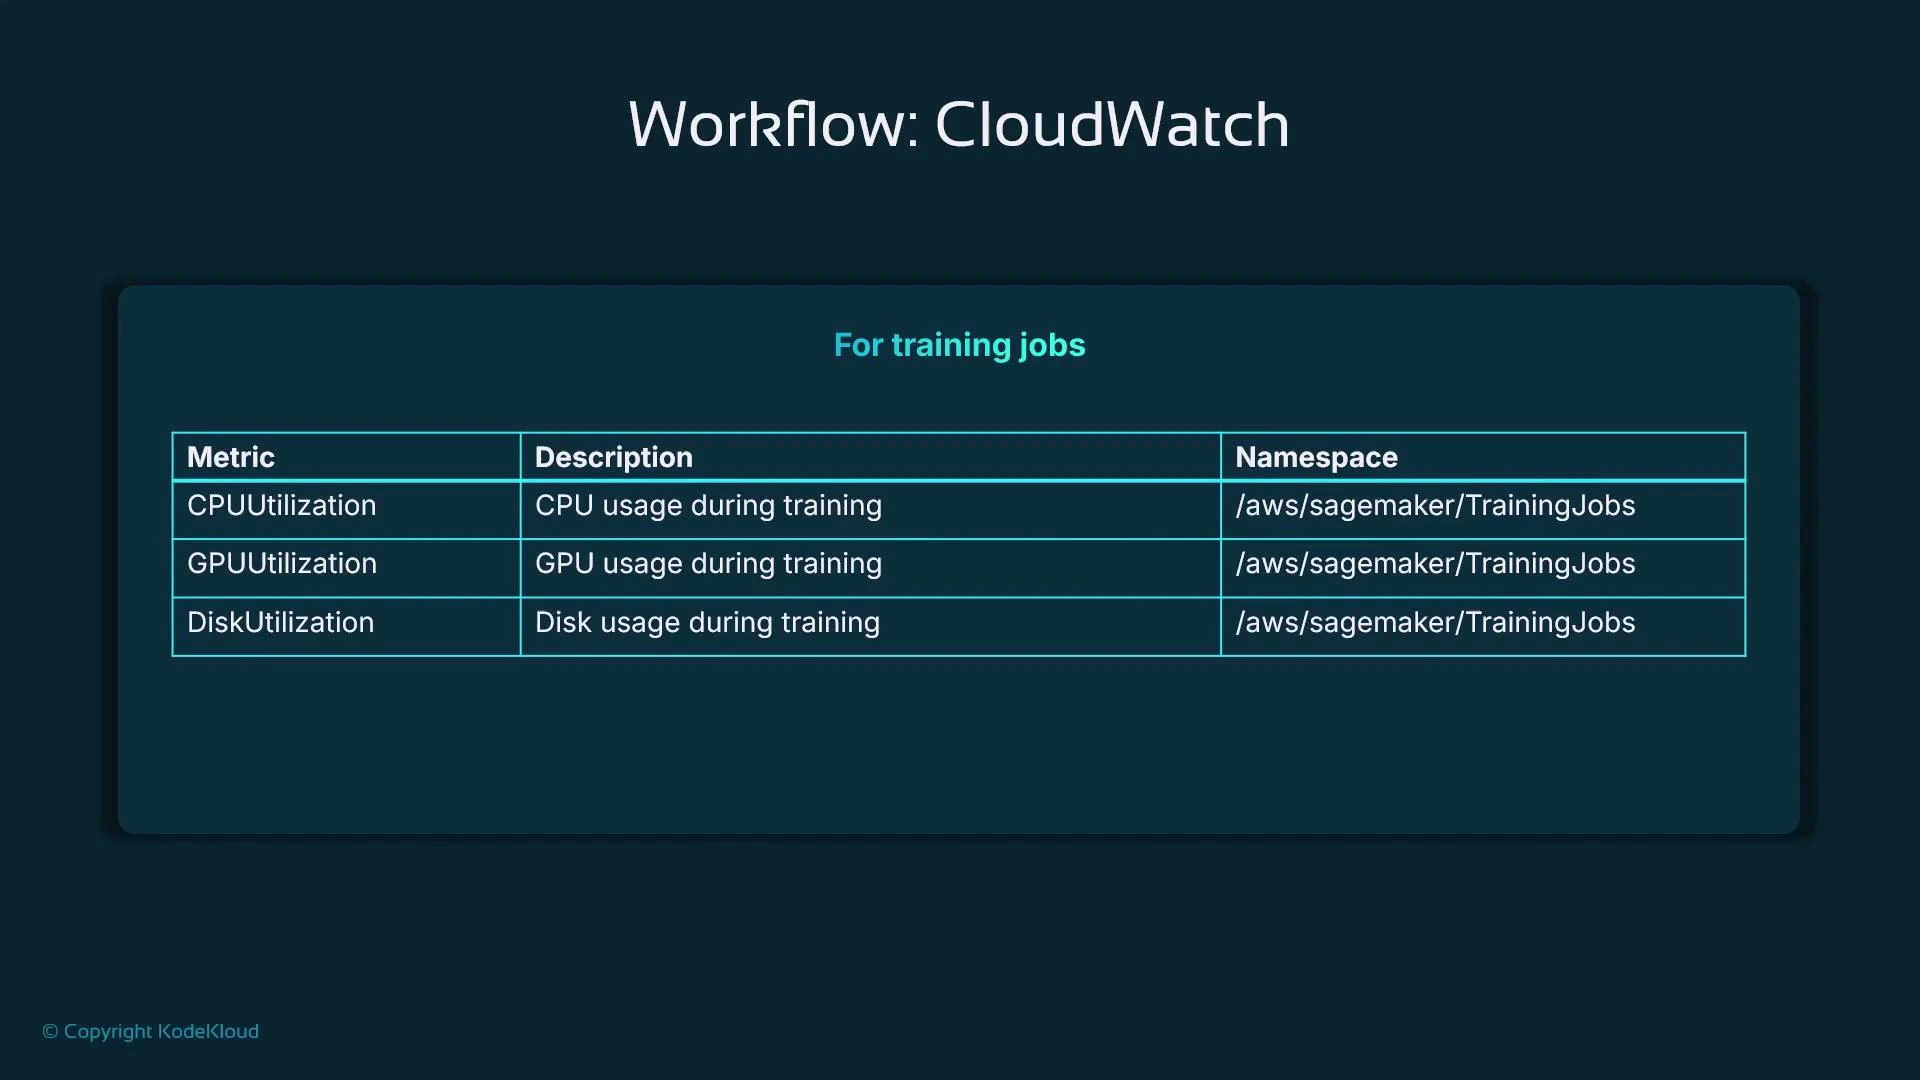
  • Monitor CPUUtilization, GPUUtilization (if applicable), and DiskUtilization to determine the best instance type and whether to use multiple instances.
  • Track InstanceCount and throughput when a job is distributed to understand scalability and cost trade-offs.
A slide titled "Workflow: CloudWatch" showing metrics for processing jobs. The table lists CPUUtilization and GPUUtilization with descriptions "CPU/GPU usage during training" and the namespace "/aws/sagemaker/ProcessingJobs."
Endpoint monitoring with AWS CloudWatch
  • CloudWatch metrics for SageMaker endpoints help determine:
    • Latency and whether it’s caused by the model (ModelLatency) or by system overhead (OverheadLatency).
    • Traffic patterns for scaling decisions.
    • Invocation errors (4xx indicate client-side issues, 5xx indicate server-side issues).
  • Use ModelLatency to measure inference time inside the model container and OverheadLatency to quantify platform/network overhead.
HTTP error guidance
Error TypeLikely CauseRecommended Actions
Invocation4XXErrorsBad requests or malformed payloads from clientValidate request schema, add request validation, log failures
Invocation5XXErrorsServer resource exhaustion or model crashesInspect logs, scale instances, check memory/CPU, redeploy model
A presentation slide titled "Workflow: CloudWatch." It displays a table of SageMaker endpoint CloudWatch metrics (Invocations, Invocation4XXErrors, Invocation5XXErrors, ModelLatency, OverheadLatency) with short descriptions and the namespace (/aws/sagemaker/Endpoints).
CloudWatch Logs
  • AWS services can push logs into CloudWatch Logs. Log groups contain log streams and events — filter to the groups you need (for example, search for “endpoint”).
  • The CloudWatch log viewer displays each log event with a timestamp and supports filtering by text or pattern (e.g., error, timeout) and expanding structured fields.
Example — log events (CloudWatch log viewer)
Log events
You can use the filter bar below to search for and match terms, phrases, or values in your log events. Learn more about filter patterns

Filter events - press enter to search  Clear  1m  30m  1h  12h  Custom  UTC timezone  Display

Timestamp | Message

No older events at this moment. Retry
2025-02-12T16:43:36.073Z  Docker entrypoint called with argument(s): serve
2025-02-12T16:43:38.400Z  Running default environment configuration script
2025-02-12T16:43:40.470Z  [02/12/2025 16:43:38 INFO 140565462996800] Memory profiler is not enabled by the environment variable ENABLE_PROFILER.
2025-02/12/2025 16:43:41.761Z  /opt/amazon/lib/python3.8/site-packages/mxnet/model.py:97: SyntaxWarning: "is" with a literal. Did you mean "=="? if num_device is 1 and 'dist' not in kvstore:
2025-02/12/2025 16:43:41.761Z  /opt/amazon/lib/python3.8/site-packages/scipy/optimize/_shgo.py:495: SyntaxWarning: "is" with a literal. Did you mean "=="? if cons['type'] is 'ineq':
2025-02/12/2025 16:43:45.259Z  /opt/amazon/lib/python3.8/site-packages/scipy/optimize/_shgo.py:743: SyntaxWarning: "is not" with a literal. Did you mean "!="? if len(self.X_min) is not 0:
2025-02/12/2025 16:43:45.259Z  [02/12/2025 16:43:45 WARNING 140565462996800] Loggers have already been setup.
2025-02/12/2025 16:43:45.509Z  [02/12/2025 16:43:45 INFO 140565462996800] worker started
2025-02/12/2025 16:43:45.509Z  [02/12/2025 16:43:45 INFO 140565462996800] loaded entry point class algorithm.serve.server_config:config_api
2025-02/12/2025 16:43:45.509Z  [02/12/2025 16:43:45 INFO 140565462996800] loading entry points
2025-02/12/2025 16:43:45.509Z  [02/12/2025 16:43:45 INFO 140565462996800] loaded request iterator application/json
2025-02/12/2025 16:43:45.509Z  [02/12/2025 16:43:45 INFO 140565462996800] loaded request iterator application/jsonlines
2025-02/12/2025 16:43:45.509Z  [02/12/2025 16:43:45 INFO 140565462996800] loaded request iterator application/x-recordio-protobuf
2025-02/12/2025 16:43:45.509Z  [02/12/2025 16:43:45 INFO 140565462996800] loaded request iterator text/csv
2025-02/12/2025 16:43:45.759Z  [02/12/2025 16:43:45 INFO 140565462996800] loaded response encoder application/json
2025-02/12/2025 16:43:45.759Z  [02/12/2025 16:43:45 INFO 140565462996800] loaded response encoder application/jsonlines
2025-02/12/2025 16:43:45.759Z  [02/12/2025 16:43:45 INFO 140565462996800] loaded response encoder application/x-recordio-protobuf
2025-02/12/2025 16:43:45.759Z  [02/12/2025 16:43:45 INFO 140565462996800] loaded response encoder text/csv
2025-02/12/2025 16:43:45.759Z  [02/12/2025 16:43:45 INFO 140565462996800] loaded entry point class algorithm:model
CloudWatch Alarms
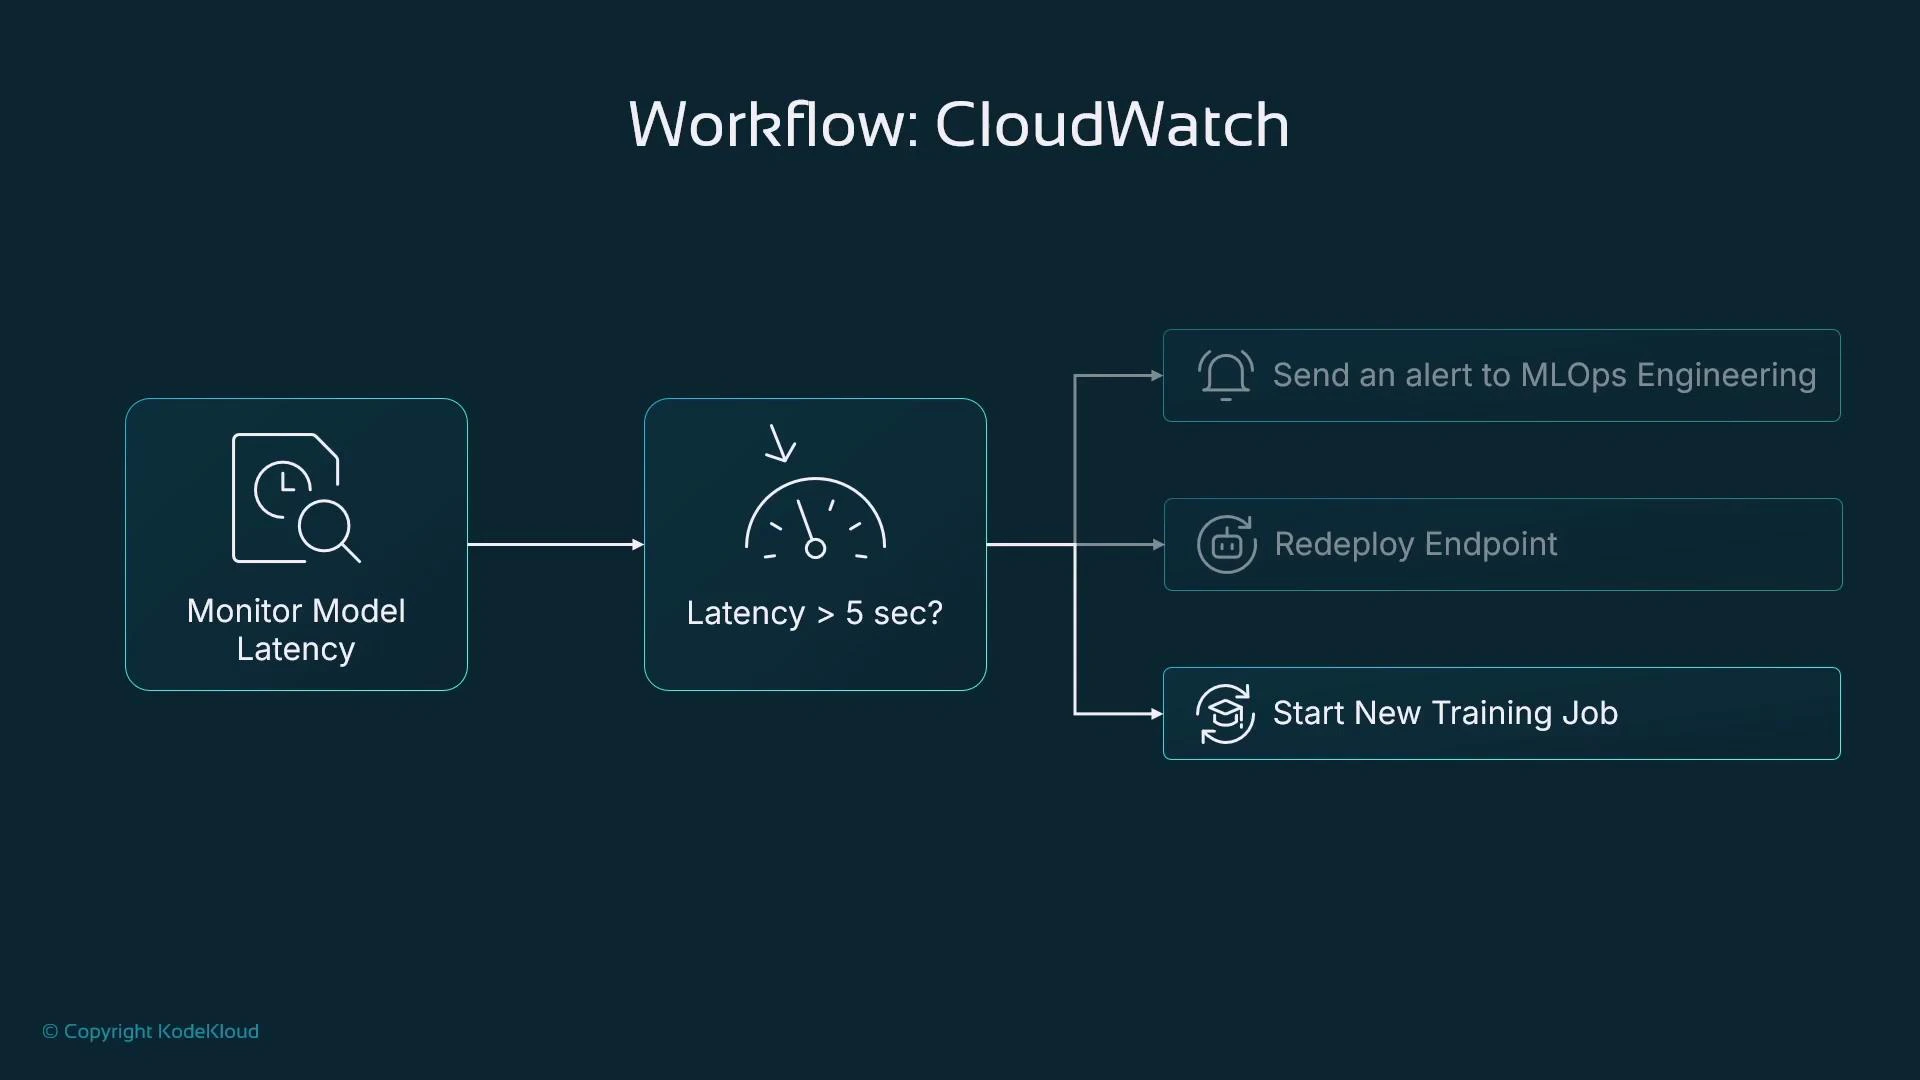
  • Alarms allow you to define thresholds on metrics and take automated actions when those thresholds are crossed.
  • Alarm actions can notify via SNS, invoke a Lambda, trigger a Step Function, or integrate with other automation for remediation.
Example alarm workflow for latency
  • Monitor ModelLatency and create an alarm if latency > 5 seconds.
  • Possible alarm actions:
    • Notify the MLOps team (SNS email/SMS).
    • Trigger an automated redeploy of the endpoint (via Lambda/Step Function).
    • Kick off a retraining pipeline if drift or data-quality issues are detected.
A CloudWatch workflow diagram showing monitoring of model latency that checks if latency exceeds 5 seconds. If it does, the flow can send an alert to MLOps, redeploy the endpoint, or start a new training job.
Next steps and recommendations
  • Use CloudWatch for infrastructure and platform signals (availability, latency, resource utilization) and SageMaker Model Monitor for model-level signals (data quality, drift, bias).
  • Capture inference inputs and outputs with Model Monitor to enable automated data quality checks, drift detection, and bias detection pipelines.
  • Combine metrics, logs, and model-monitoring signals to build a robust observability stack: use CloudWatch for alerting and automation; use Model Monitor for model performance and fairness insights.
Links and references
  • AWS CloudWatch
  • SageMaker Model Monitor documentation (search “SageMaker Model Monitor” in AWS docs)
  • Kubernetes Basics (for containerized workloads and sidecars)

Watch Video