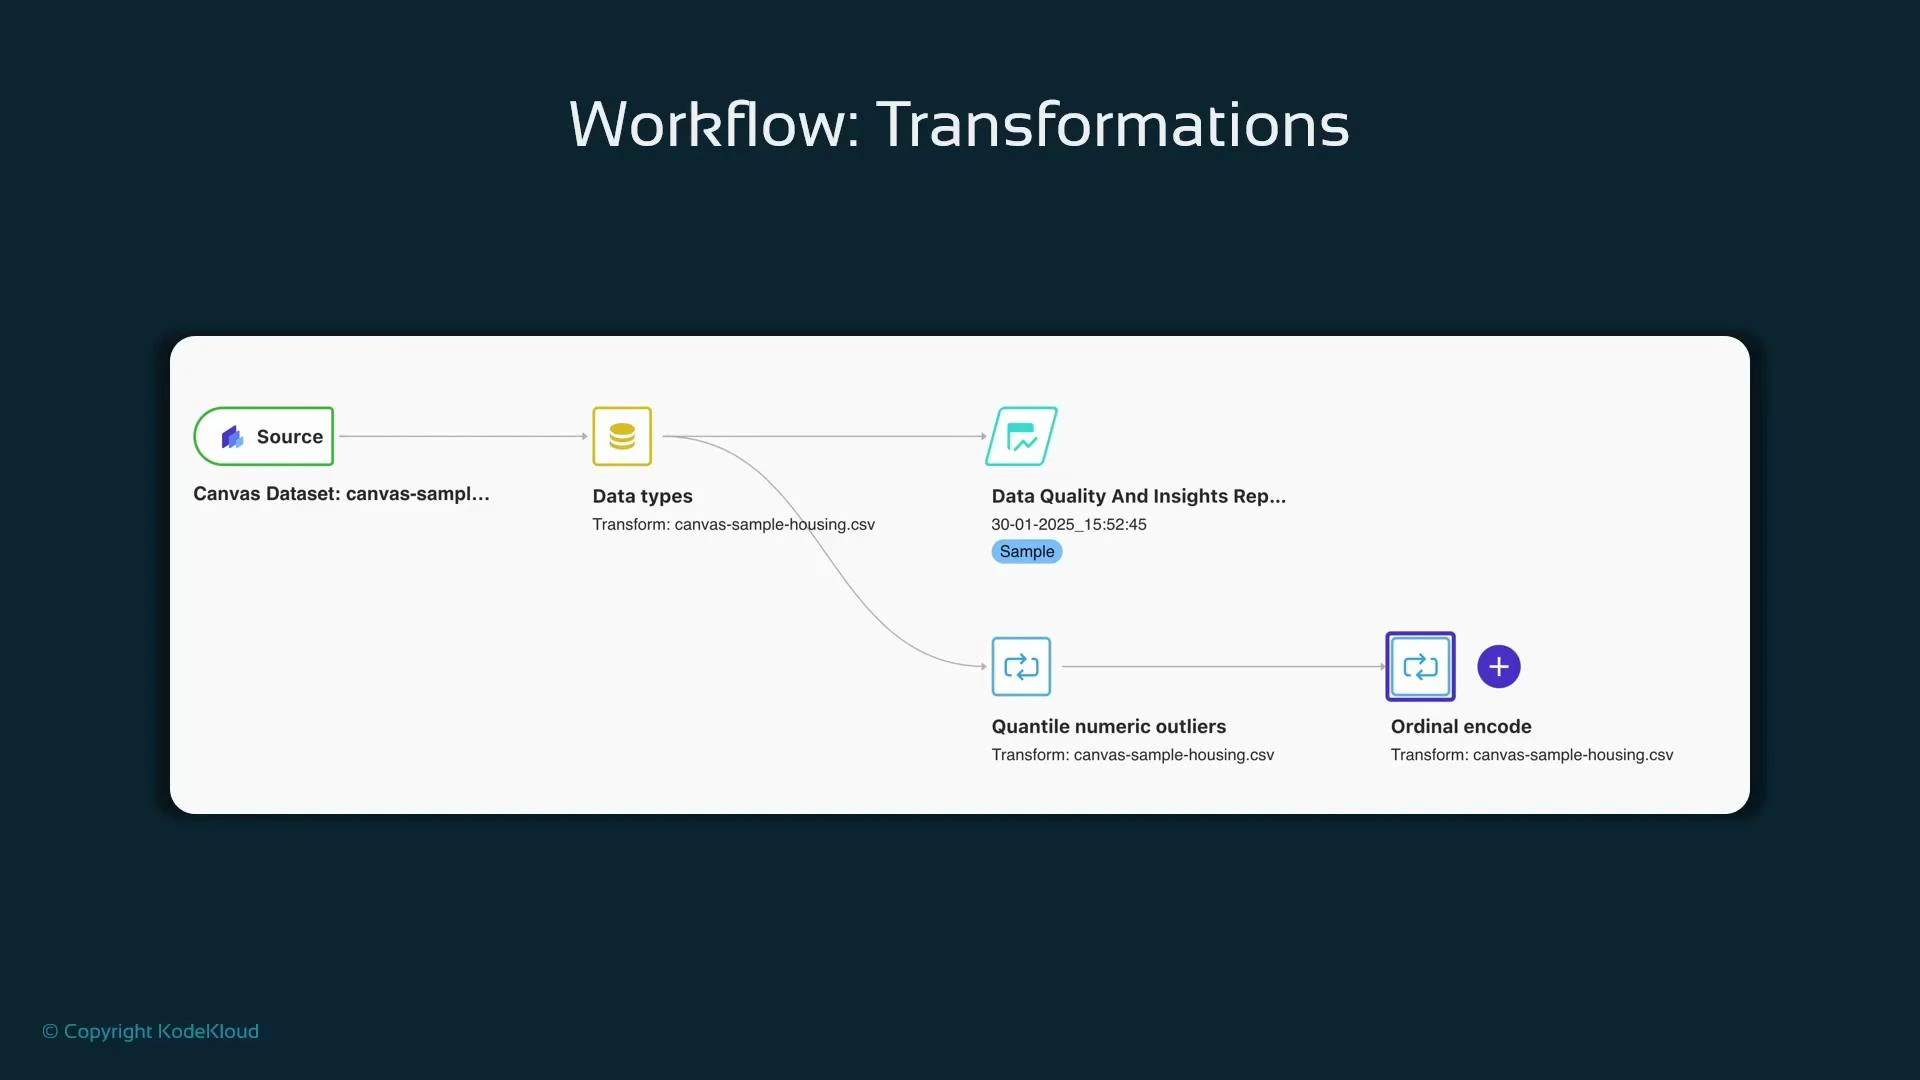
- Drop irrelevant identifiers and high-cardinality fields first.
- Clip or cap extreme values (e.g., quantile numeric outliers).
- Impute missing values (mean/median for numeric, mode for categorical).
- Apply encoders: ordinal encode for ordered categories, one-hot for nominal categories.
- Scale numeric features if required by downstream models.
- Add an Export node at the end of the flow to save the prepared dataset.
- Data Wrangler supports exporting transformed datasets to Amazon S3.
- Optionally generate a reproducible Jupyter Notebook containing Python code that matches the visual transforms: useful for hand-off to ML engineers (note: the generated notebook can be verbose).
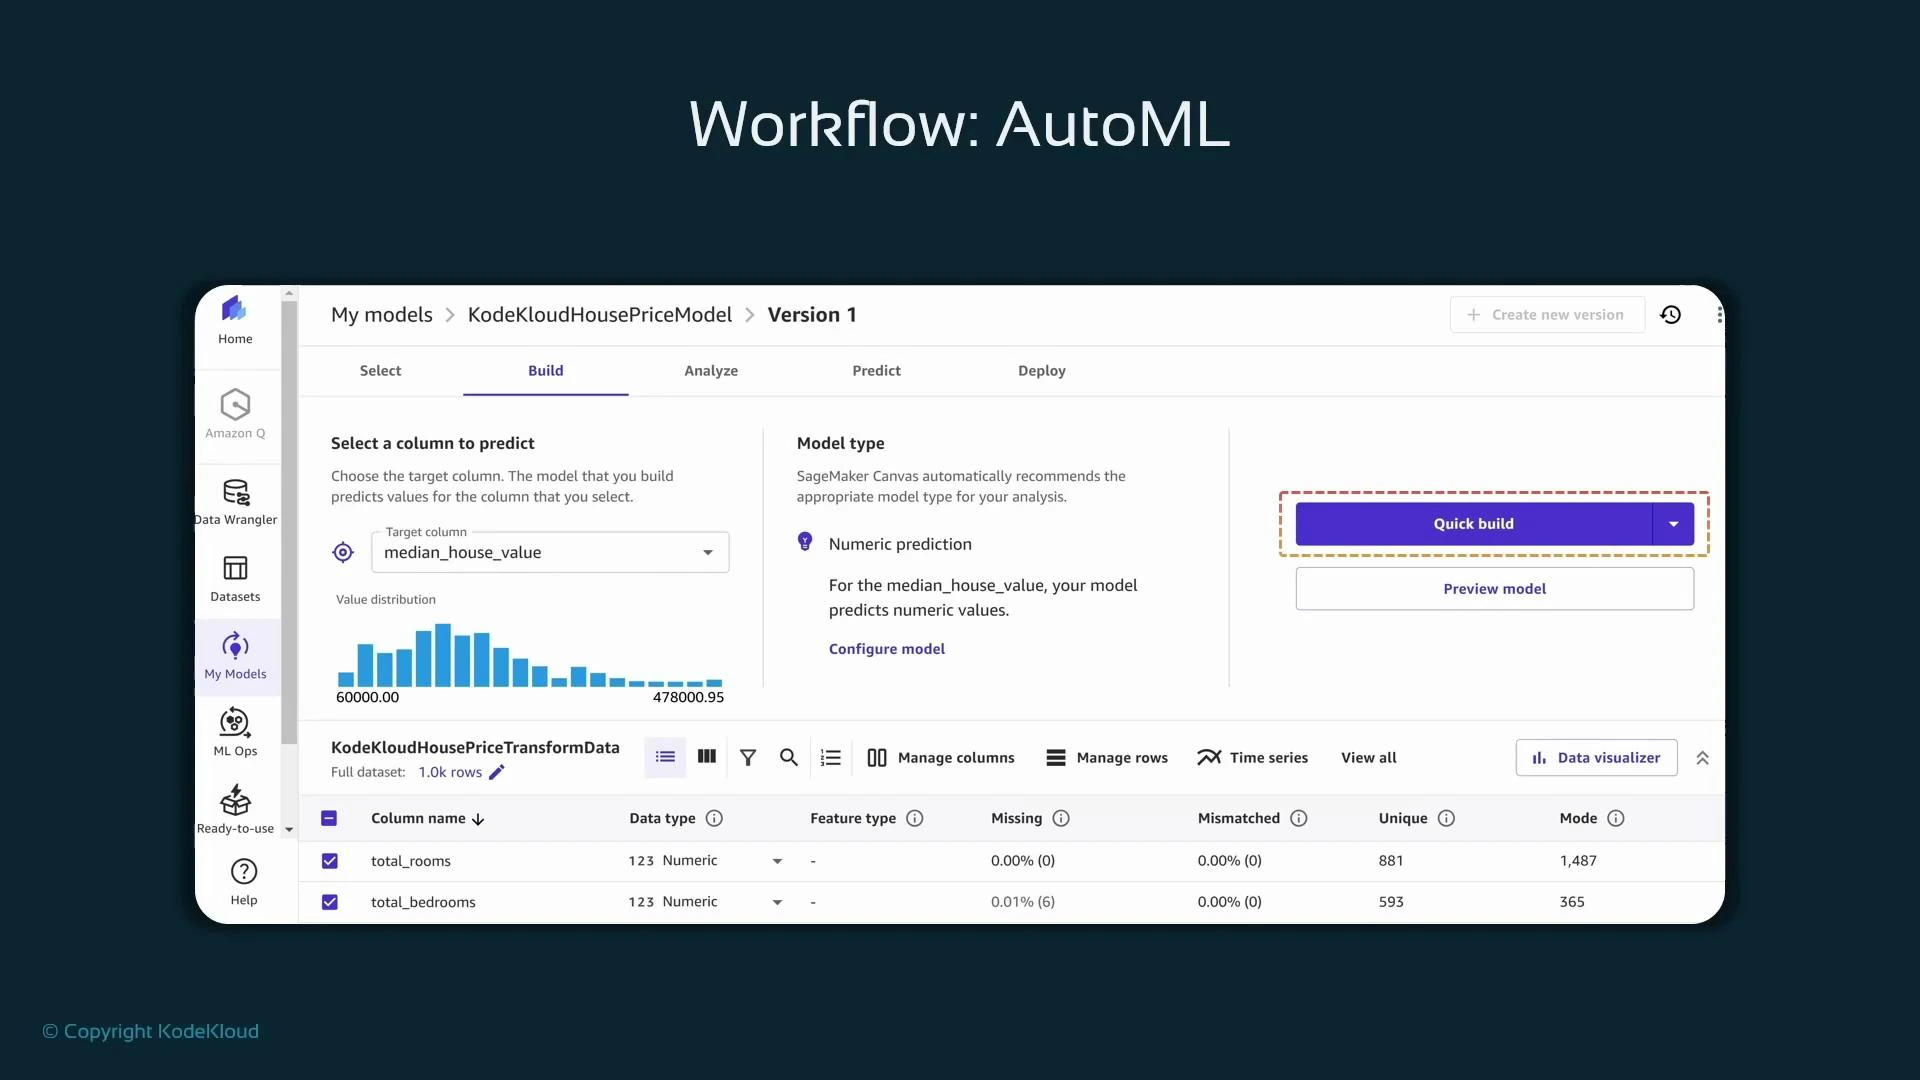
With a cleaned, transformed dataset you can use SageMaker Canvas AutoML to build models without writing code. From the Canvas UI you select the exported dataset, name the model, and choose the problem type. For the housing example, the target column
median_house_value signals a regression problem. Canvas uses pre-sized compute and automatic algorithm selection plus automated hyperparameter handling to produce candidate models.
When Canvas starts an AutoML build, it creates a standard SageMaker training job under the hood:
- The job name typically includes the prefix “canvas”.
- Training job details include source S3 locations, output artifact location, and the container/algorithm used.
- You can inspect these jobs in SageMaker Studio under Jobs → Training.
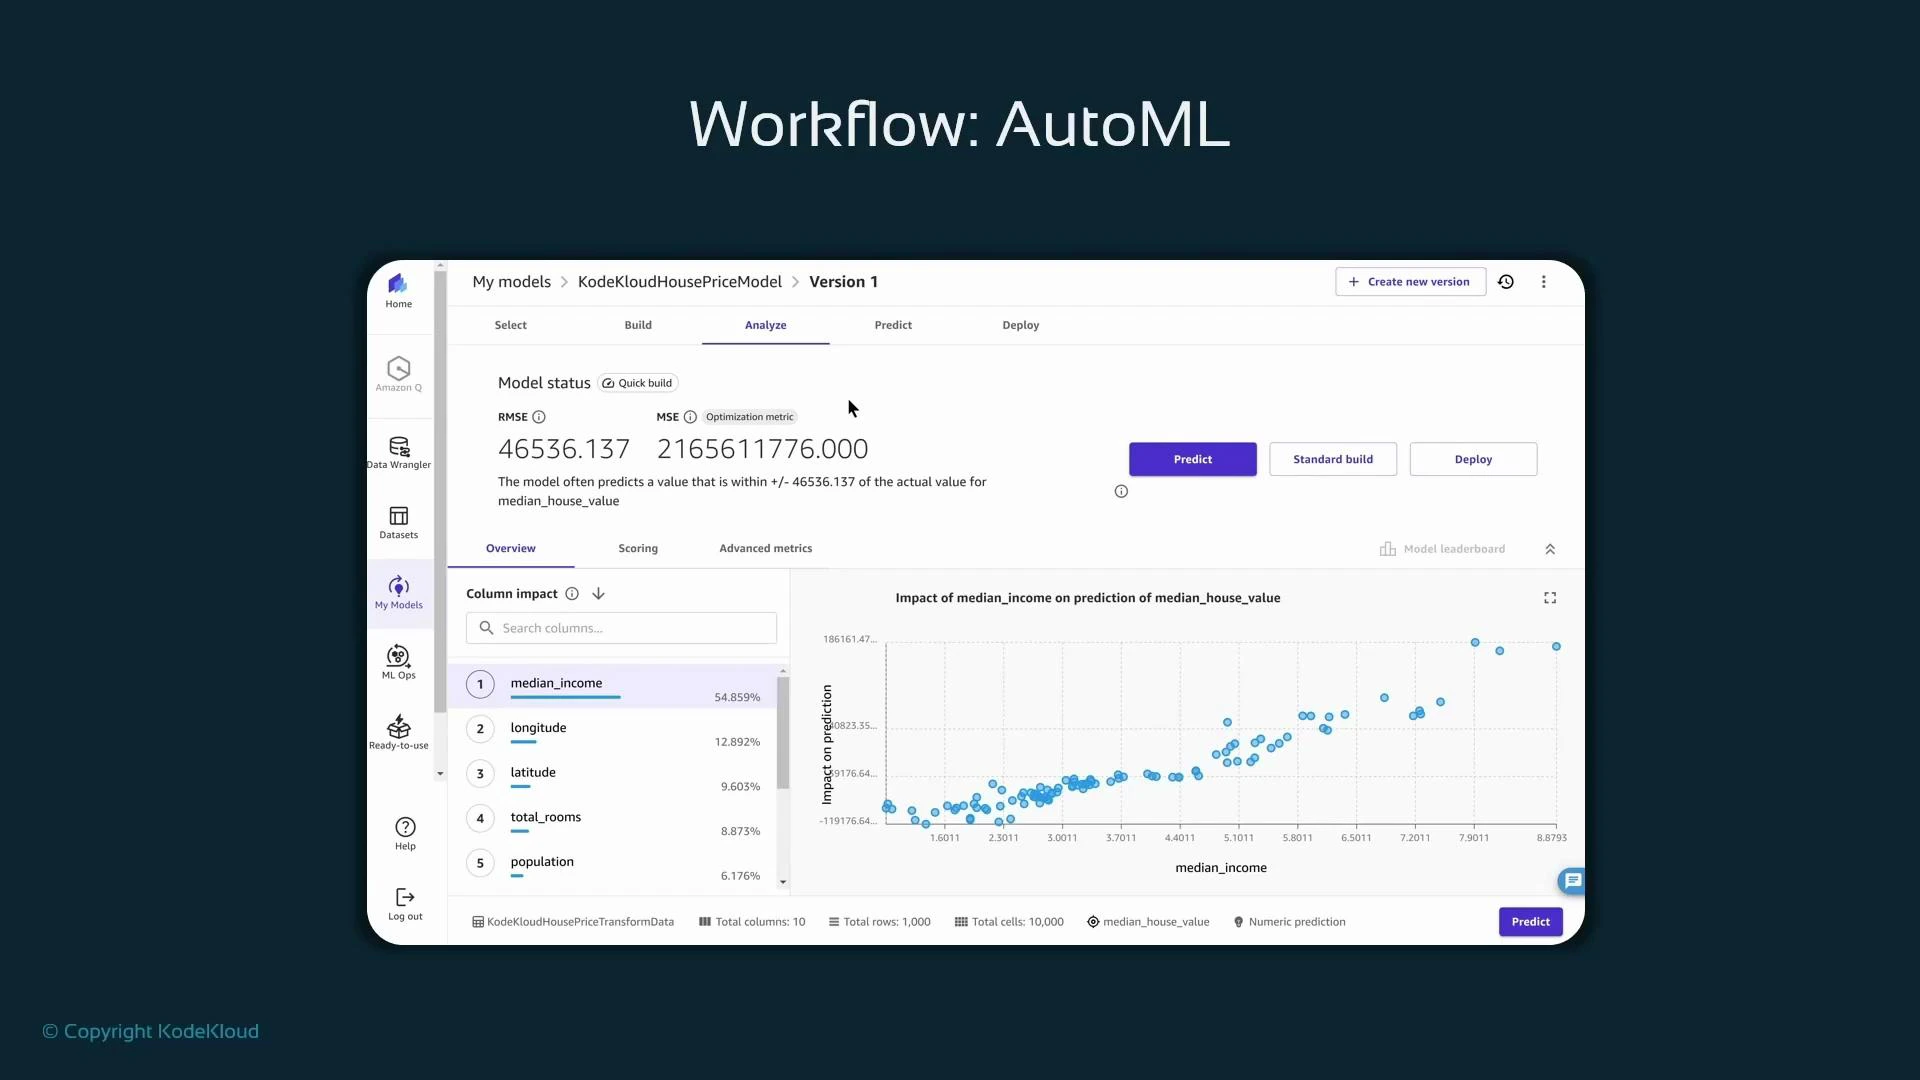
- For regression, view RMSE (root mean squared error) and MSE, which summarize average prediction error magnitude. Lower RMSE generally indicates a better fit.
- Canvas shows per-feature impact (feature importance) and interactive visualizations (scatterplots, partial dependence–style views) to help you understand how features influence predictions.
- Use quick-build for rapid evaluation, one-off predictions with manual input, or perform a standard/manual build for longer searches.
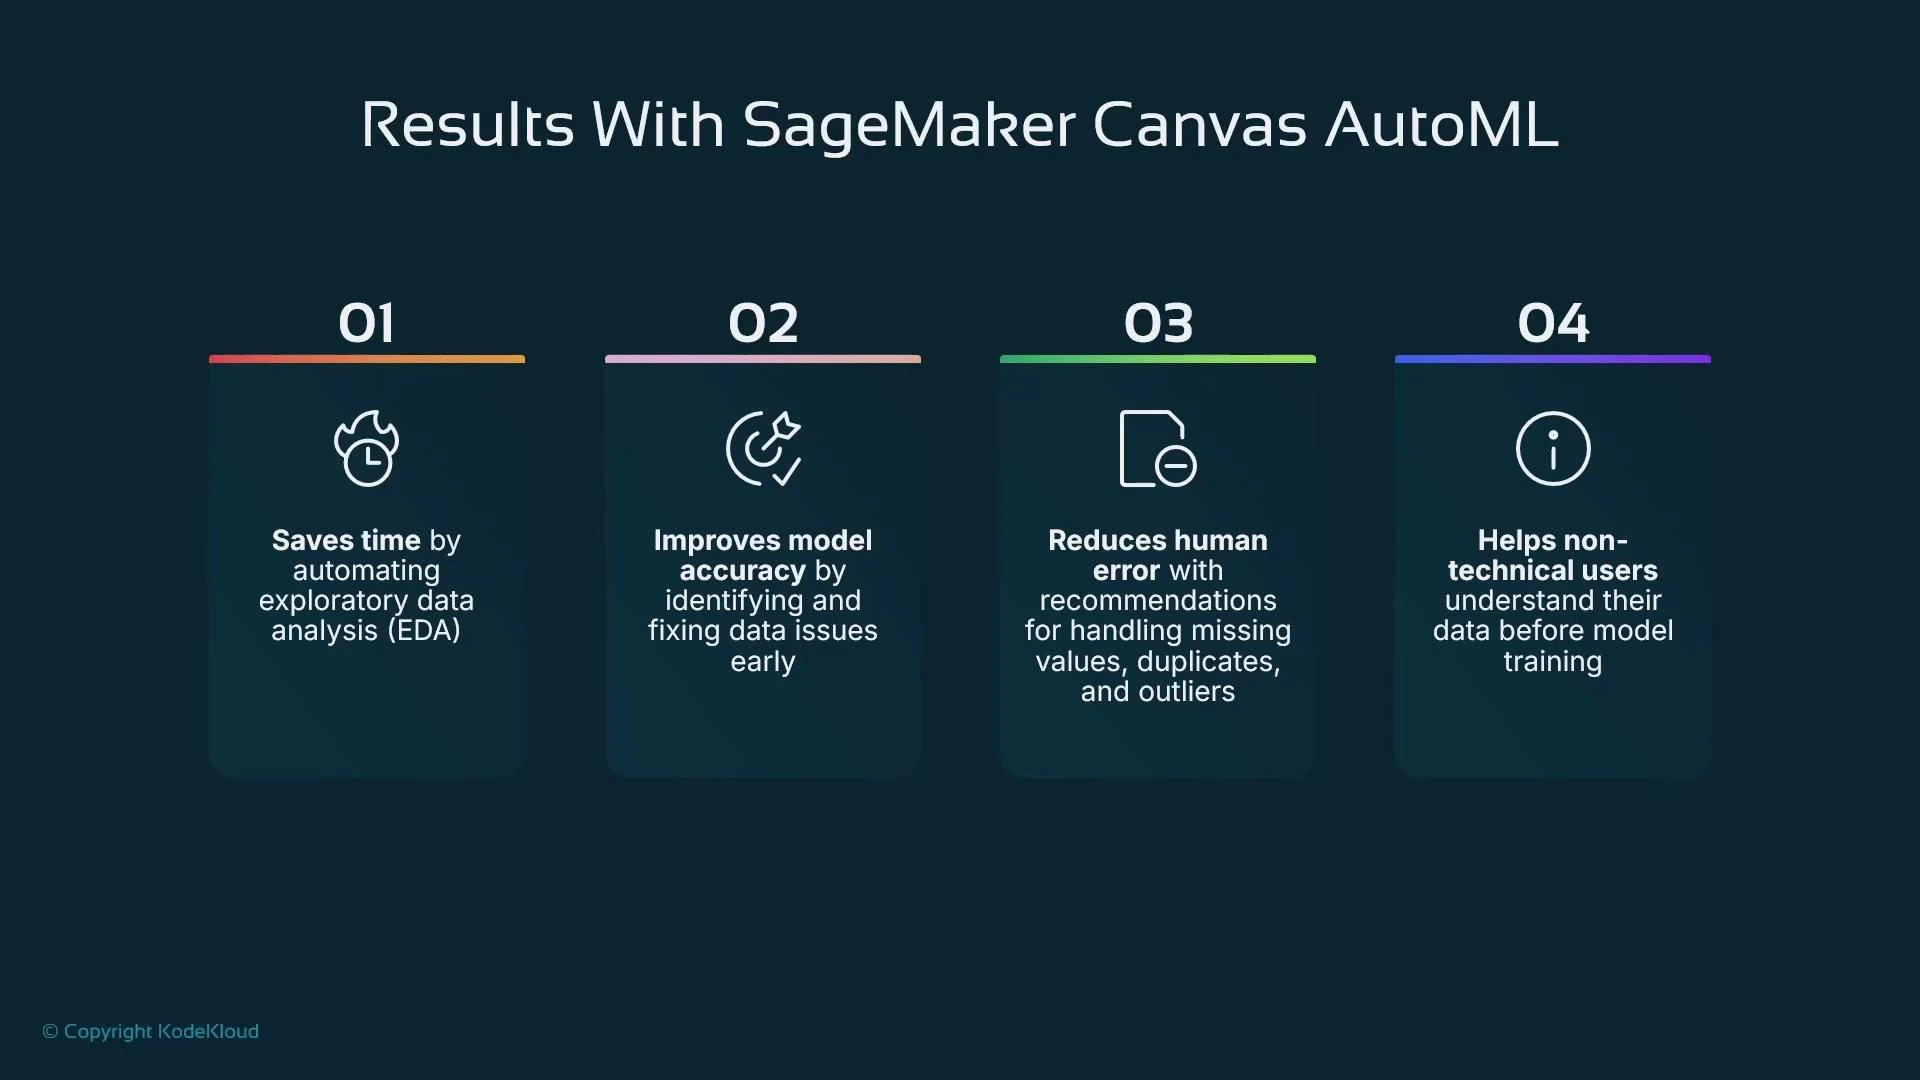
- Low-code end-to-end flow for data preparation, AutoML model building, and deployment.
- Auto preprocessing, basic encoding, and cleaning (with finer-grain control available via Data Wrangler).
- Automated model selection and basic explainability (feature impact and visual diagnostics).
- One-click deployment to a SageMaker endpoint (real-time inference) or batch predictions.
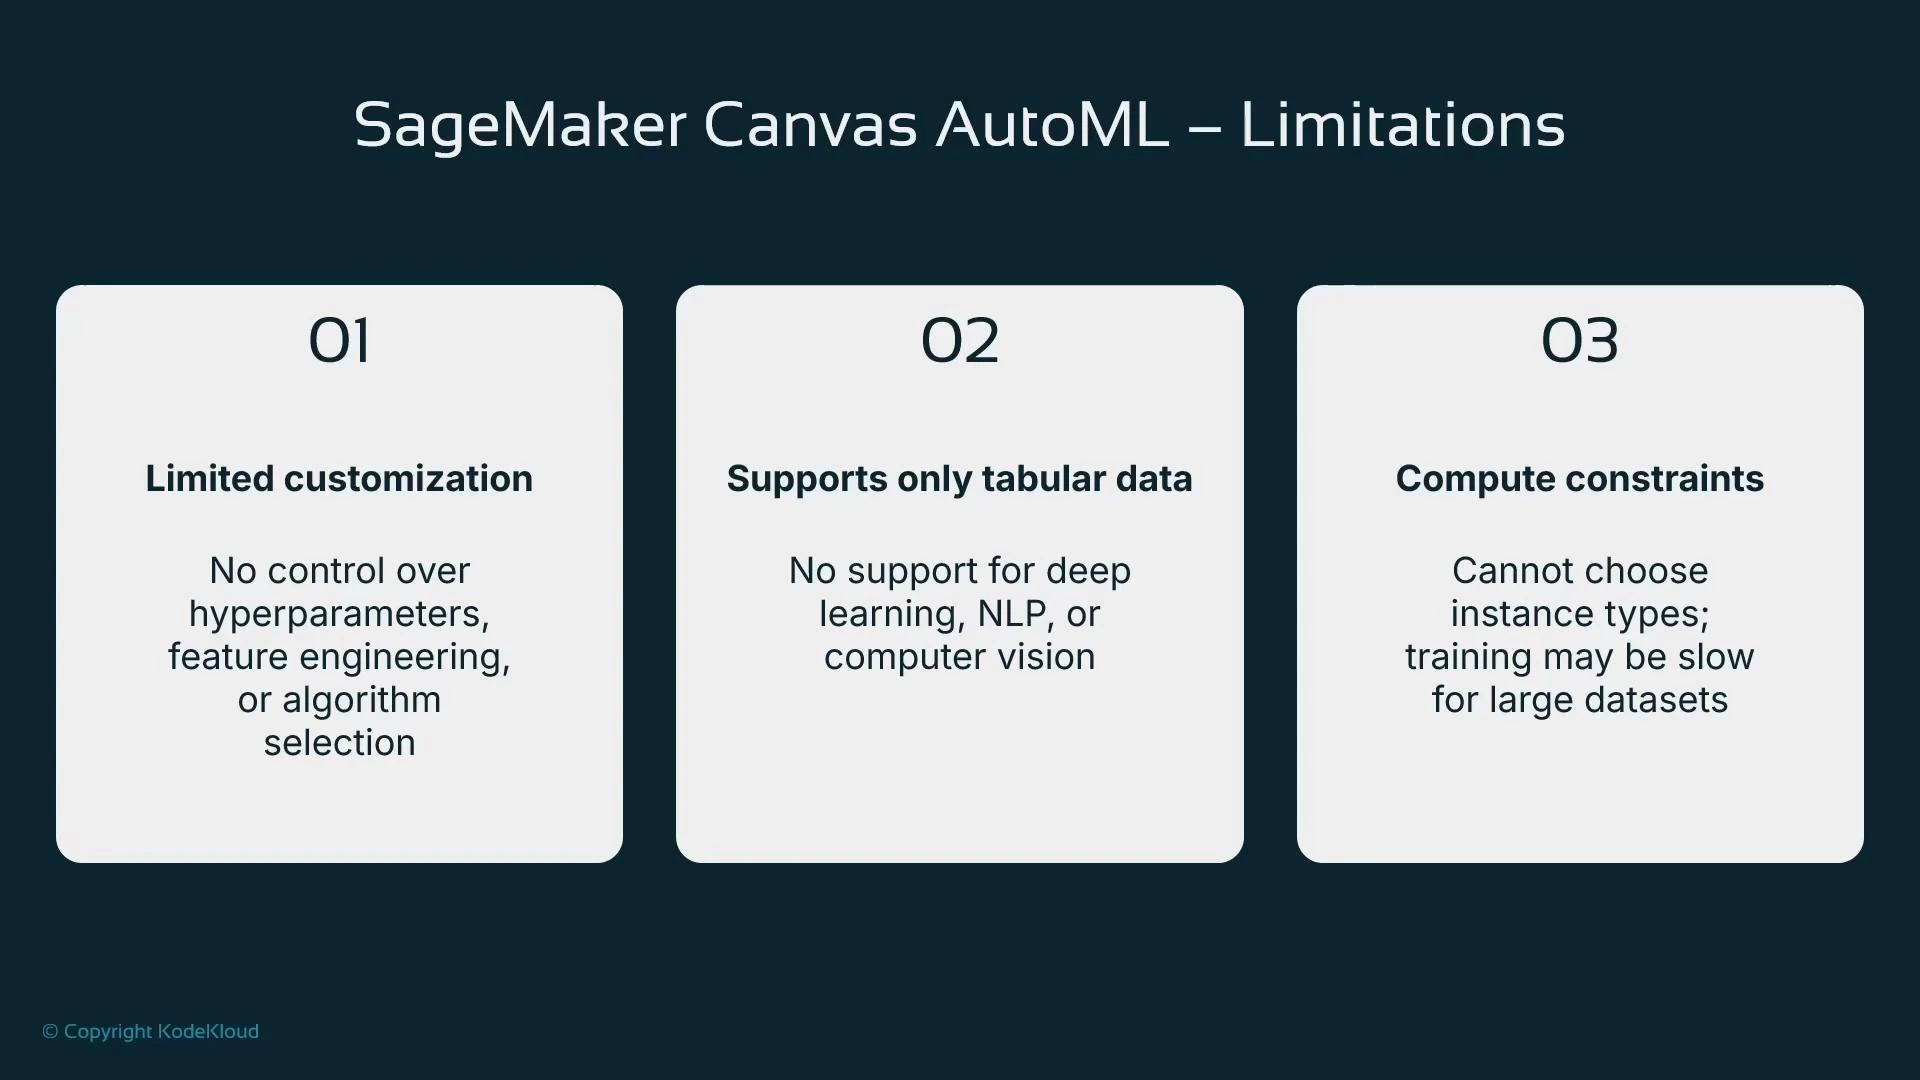
- Limited customization: you cannot pick specific algorithms or fully control hyperparameters from the Canvas UI.
- Focus on tabular data: Canvas is optimized for common tabular problems (regression, classification, forecasting); for deep learning, NLP, or vision use SageMaker code-first workflows.
- Limited compute control: Canvas chooses instance sizing; it may not be optimal for very large datasets or specialized hardware.
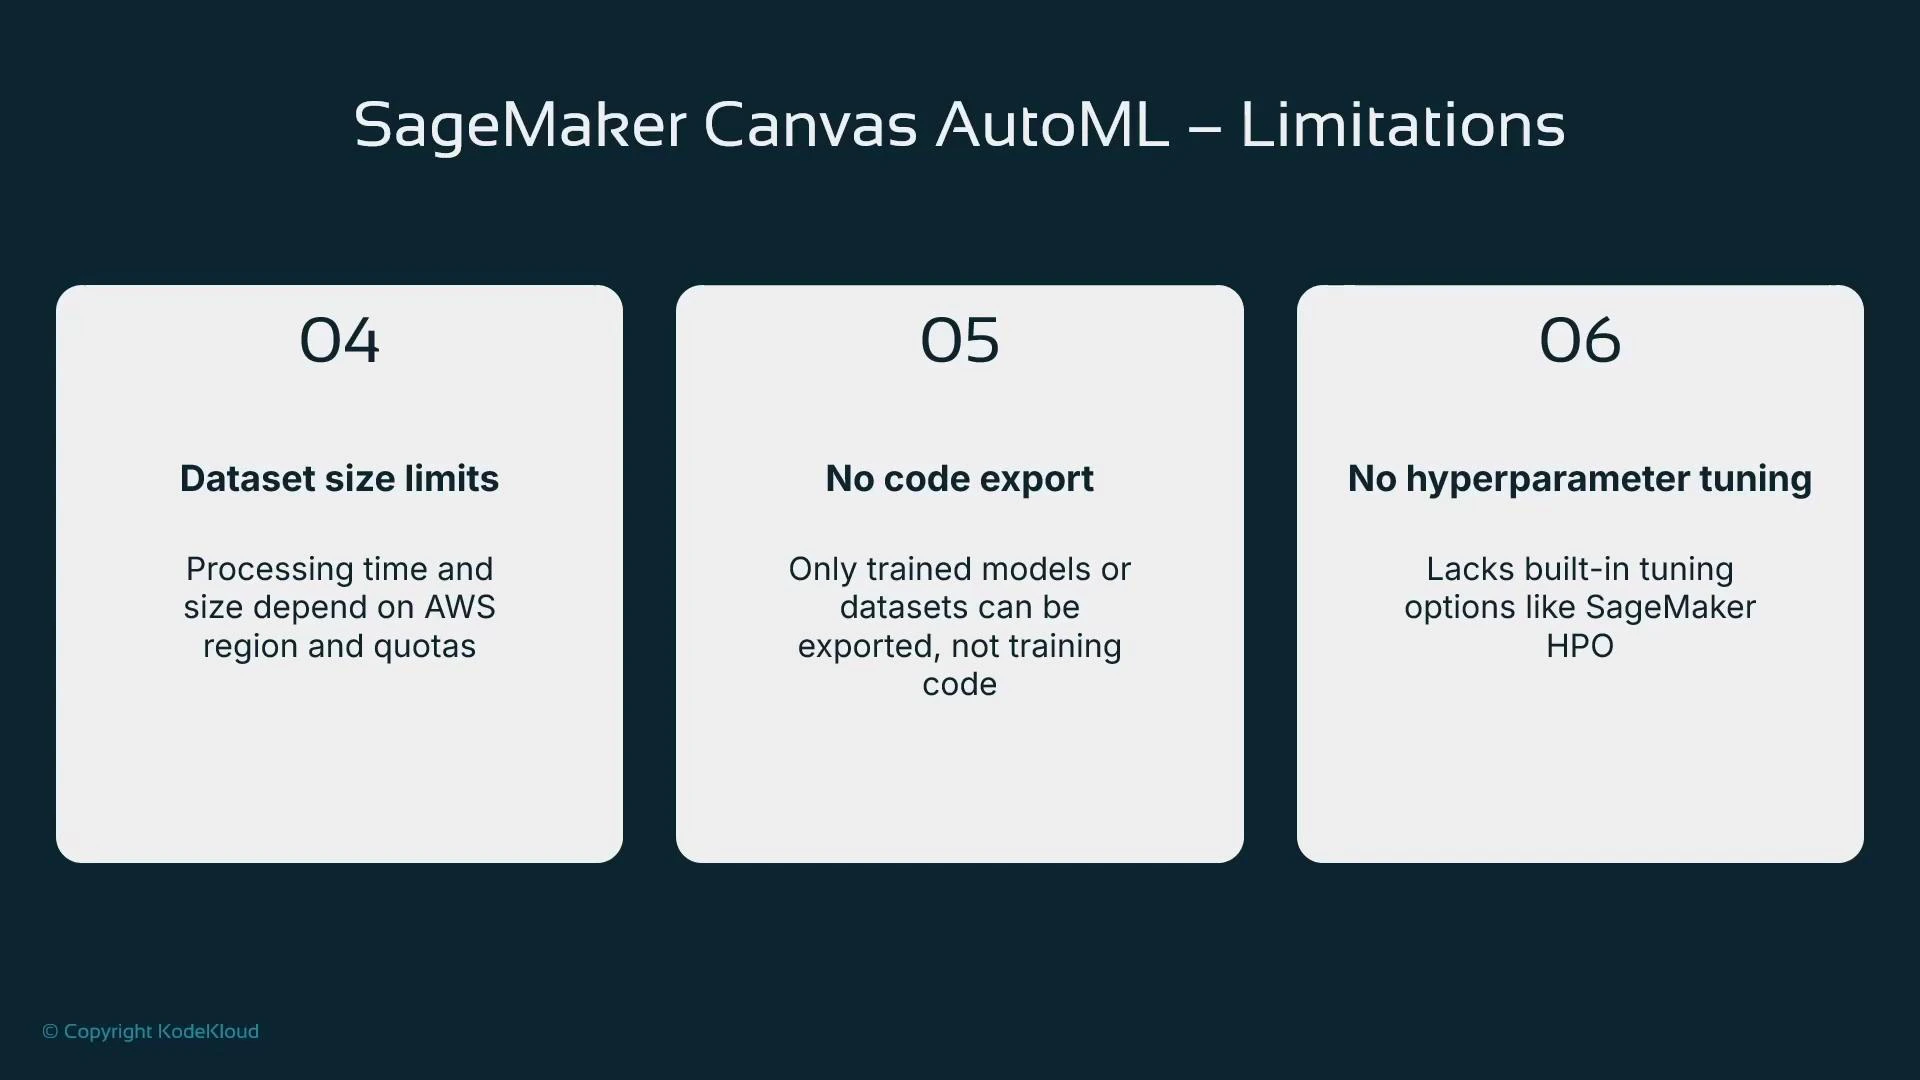
- No training code export: Data Wrangler can export transformation code, but Canvas does not expose AutoML training code.
- No built-in hyperparameter tuning management; use SageMaker hyperparameter tuning jobs for advanced HPO.
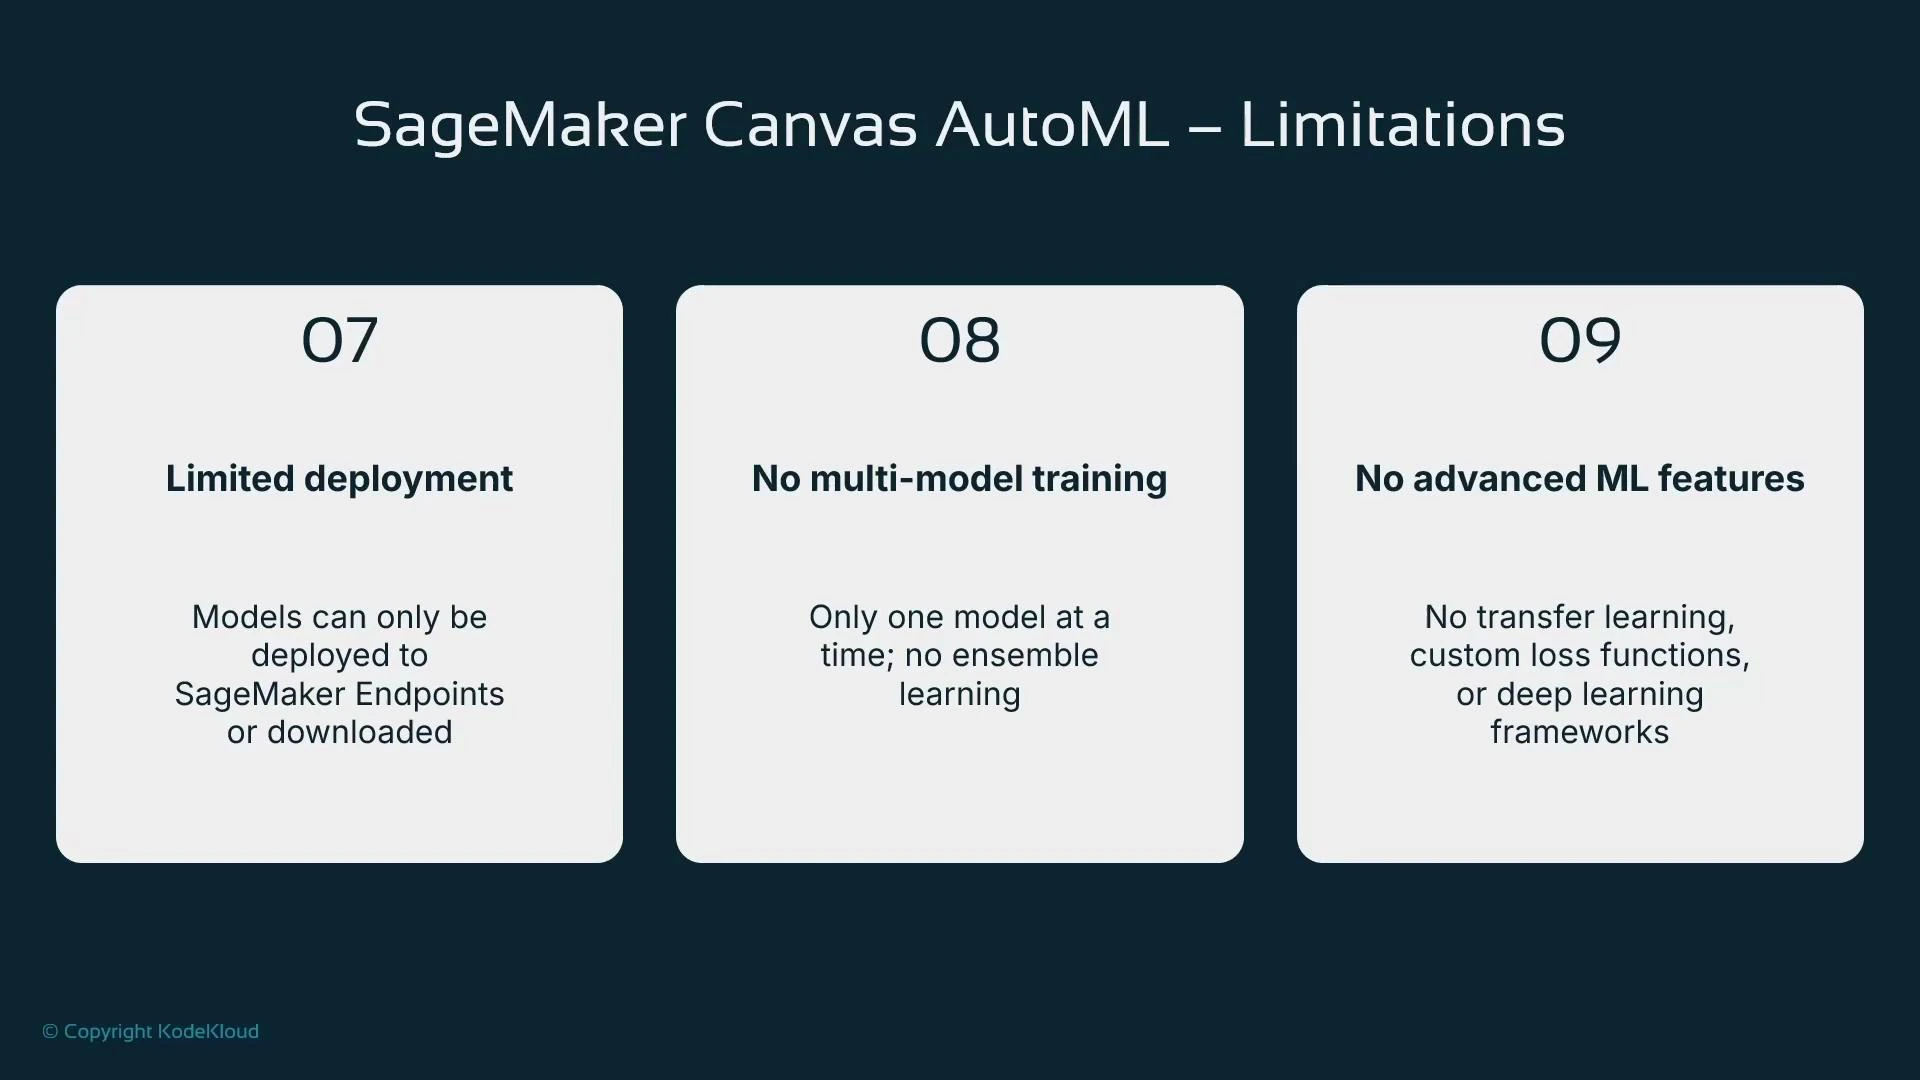
- Deployment is primarily to SageMaker endpoints; alternative hosting and custom inference setups require additional steps.
- No multi-model ensemble training or advanced ML features (transfer learning, custom loss functions) within Canvas.
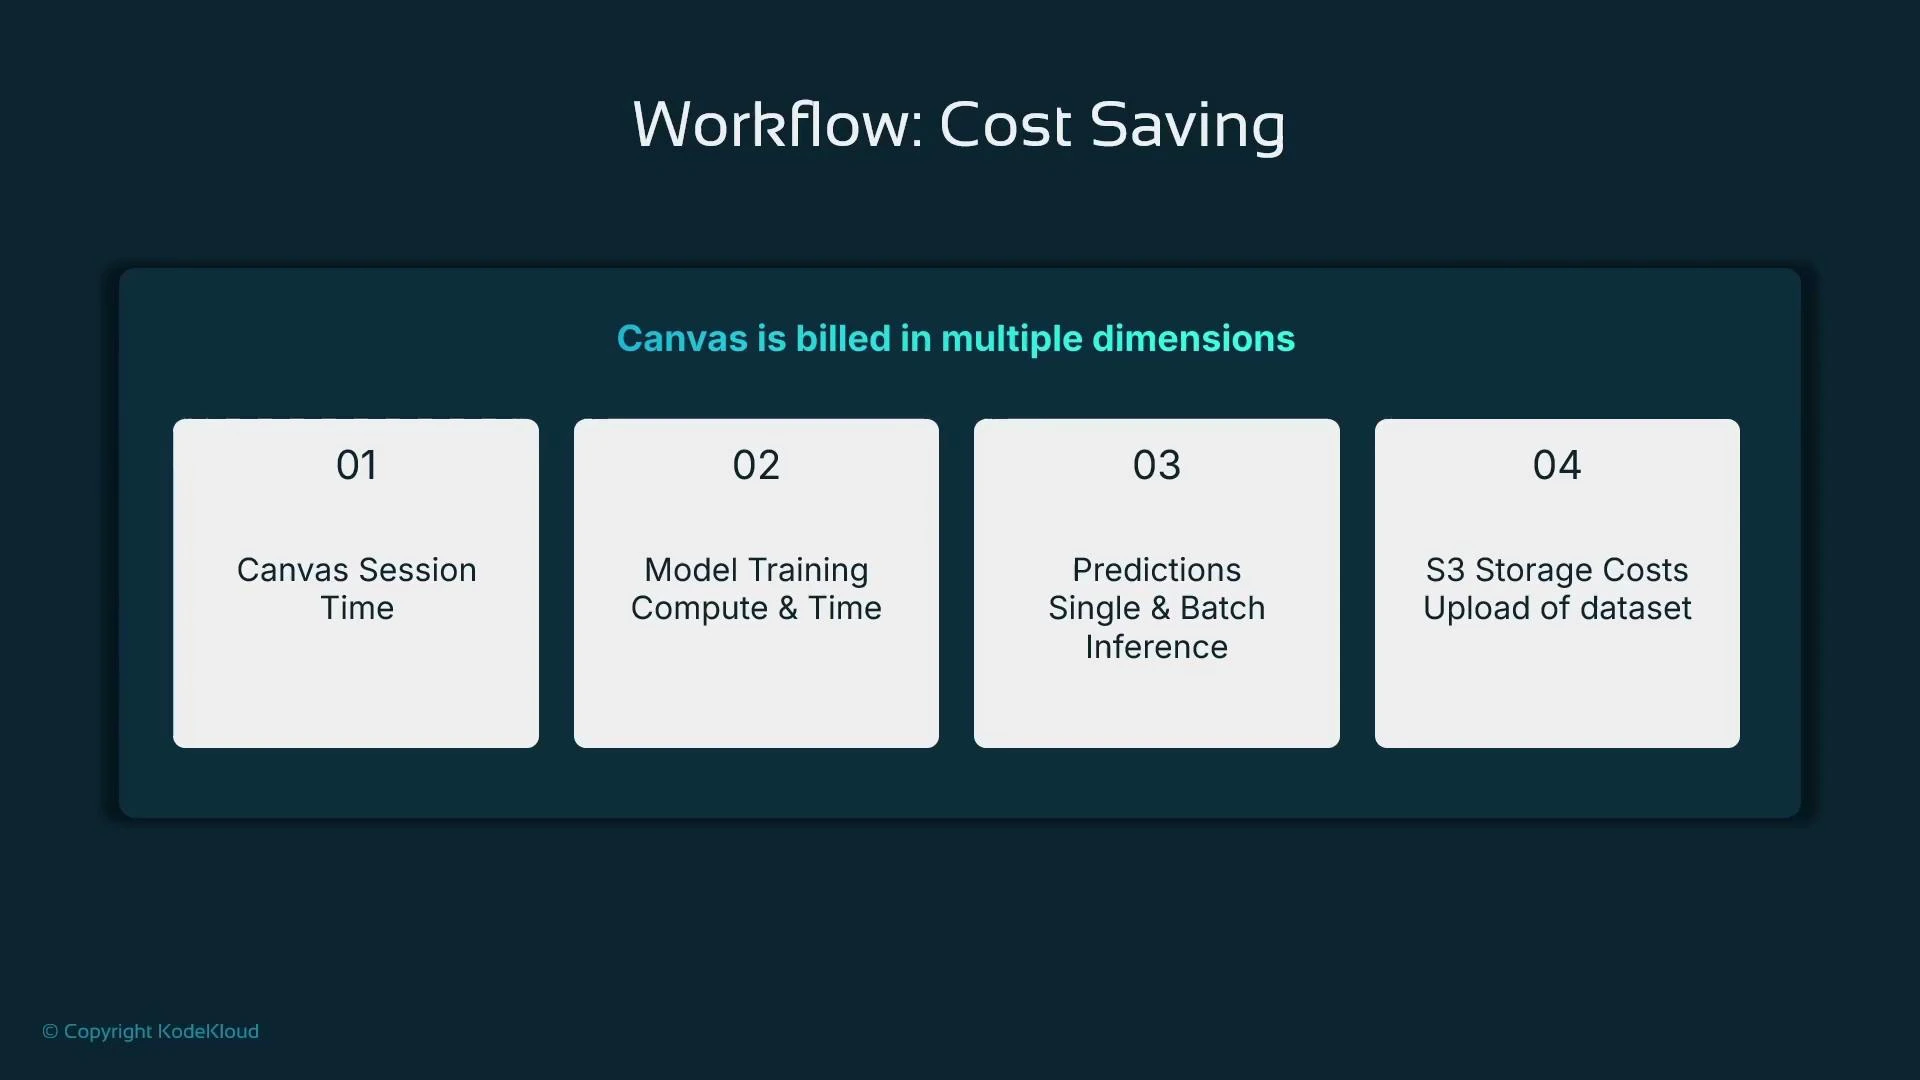
- Canvas session time: Canvas sessions are billed while the managed instance is running. Typical rates vary by region; leaving sessions idle can accumulate cost.
- Training jobs: SageMaker training costs (instance hours, instance types) apply to each training job Canvas creates.
- Inference: Real-time endpoints are billed while running; batch transform jobs are billed per-job.
- Storage: S3 storage for datasets and artifacts is billed at standard S3 pricing.
- Clean up: Stop and delete any running training jobs, batch jobs, endpoints, or unnecessary S3 objects to avoid ongoing charges.
Shutting down the Canvas session does not automatically stop all resources provisioned during the session. Check for running training jobs, deployed endpoints, and stored datasets in S3—these continue to incur charges until you terminate or delete them.
- SageMaker Canvas is a low-code UI that integrates Data Wrangler for visual data preparation, offers AutoML model building, and supports managed deployment to SageMaker endpoints.
- Data Wrangler has hundreds of built-in transforms (one-hot encoding, scaling, imputation, column drop, outlier clipping) you can chain to prepare data for training.
- Canvas AutoML automates model selection and training and provides basic explainability, but trades off detailed control (algorithm selection, HPO, training code).
- After training you can run immediate predictions or deploy a model with a single click to a managed endpoint.
- Monitor and manage resources (Canvas sessions, training jobs, endpoints, S3 storage) to control cost.
- An introduction to SageMaker Canvas as a low-code interface for tabular data prep, AutoML model building, and managed deployment.
- How Data Wrangler (integrated with Canvas) helps prepare data with many built-in transformations and a Data Quality and Insights report.
- How Canvas AutoML automates model selection and provides basic explainability, while limiting low-level control and advanced ML workflows.
- The importance of careful data preparation to improve model accuracy.
- Billing and operational considerations for Canvas and SageMaker resources.
- Amazon SageMaker Canvas overview: https://docs.aws.amazon.com/sagemaker/latest/dg/canvas.html
- Data Wrangler documentation: https://docs.aws.amazon.com/sagemaker/latest/dg/data-wrangler.html
- SageMaker training jobs: https://docs.aws.amazon.com/sagemaker/latest/dg/how-it-works-training.html