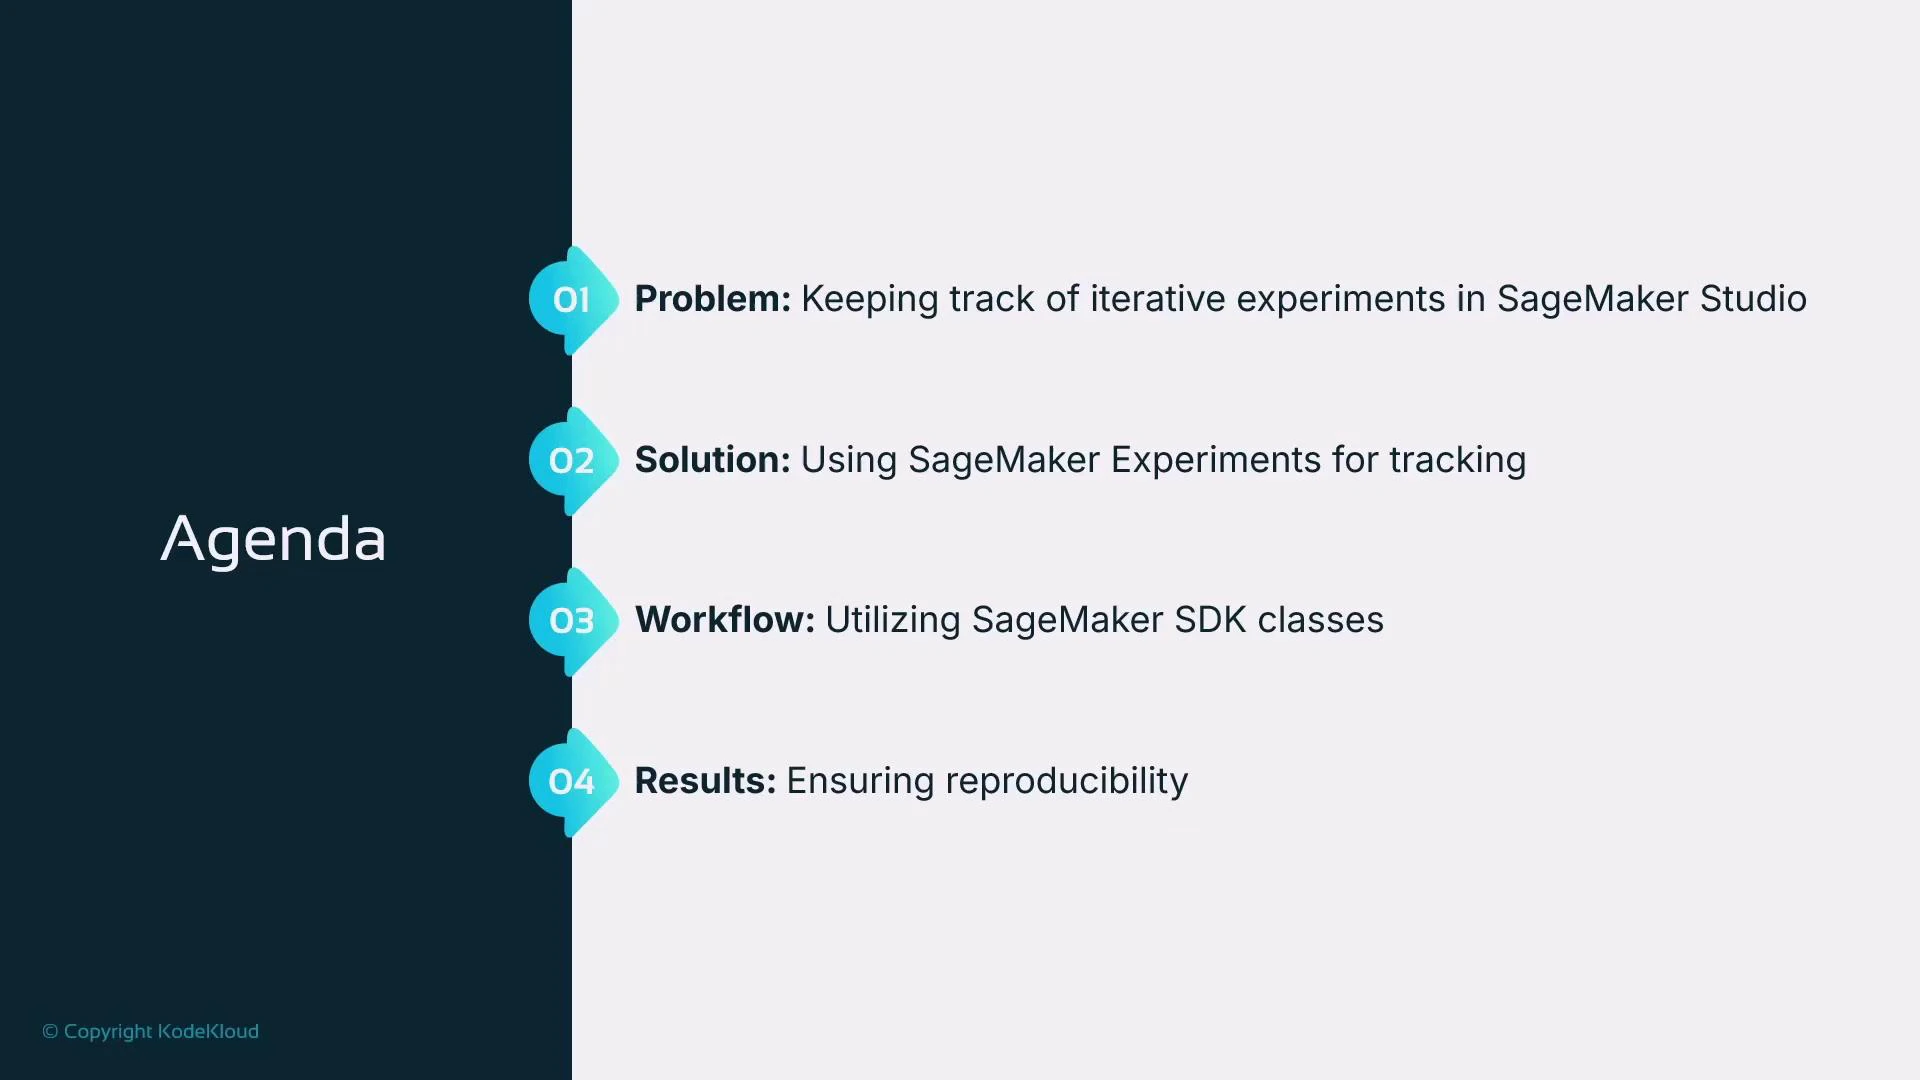
- The problem of tracking iterative experiments in SageMaker Studio.
- How SageMaker Experiments helps with tracking and reproducibility.
- A code-first workflow using the SageMaker SDK.
- How to capture and compare runs to reproduce results.
The problem: many iterative experiments, poor traceability
Data scientists and ML engineers routinely run multiple experiments that differ by:- Model type (e.g., RandomForest, XGBoost)
- Hyperparameters and optimization schedules
- Feature engineering or preprocessing pipelines
- Dataset versions or label corrections
- Experiment 1: RandomForest with scaling and PCA
- Experiment 2: XGBoost without scaling with a different learning rate
- Experiment 3: XGBoost with alternate hyperparameters and feature set
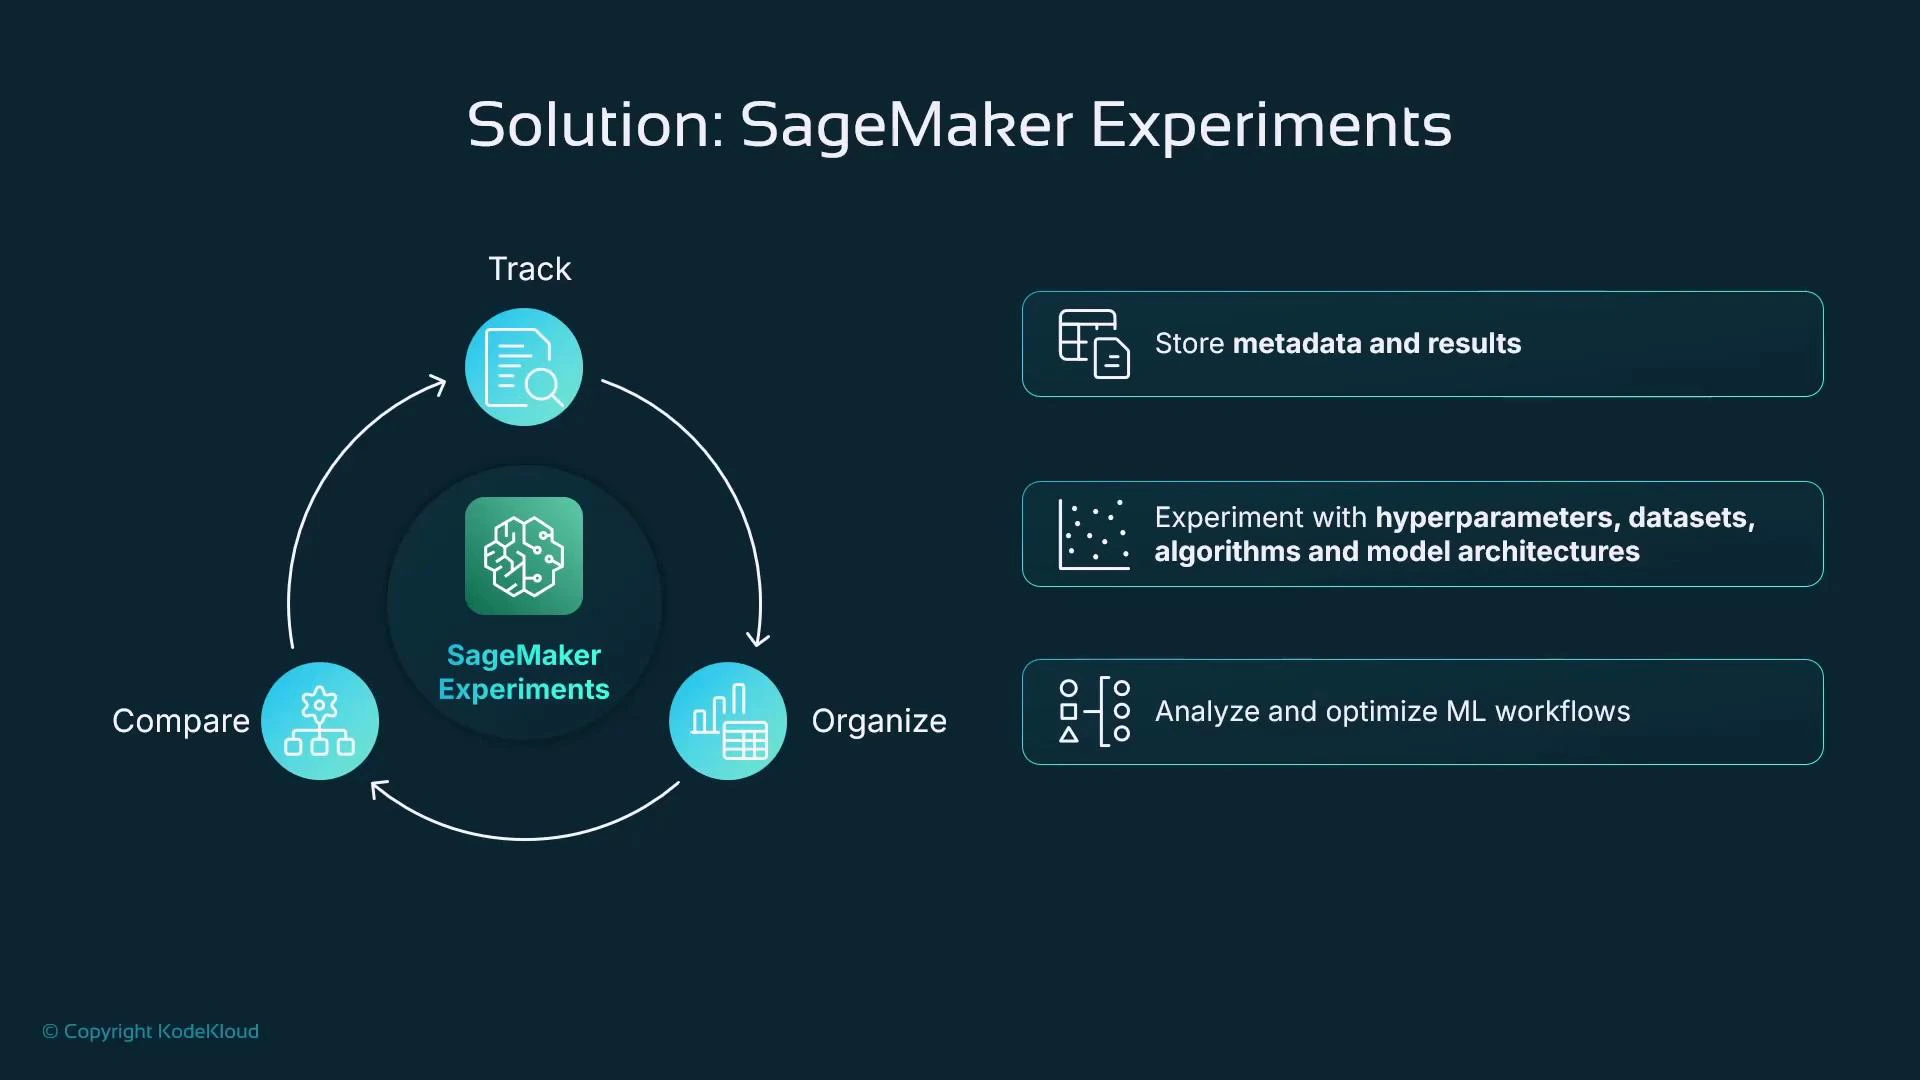
Solution: experiment management with SageMaker Experiments
SageMaker Experiments provides a built-in mechanism to record metadata, hyperparameters, metrics, and artifacts for each run so you can compare, analyze, and reproduce experiments. Note: AWS Studio experiences are evolving. Some newer Studio versions surface MLflow integration or other experiment UIs instead of the native SageMaker Experiments dashboard. Confirm your Studio configuration and roadmap when selecting a tracking approach for long-term projects.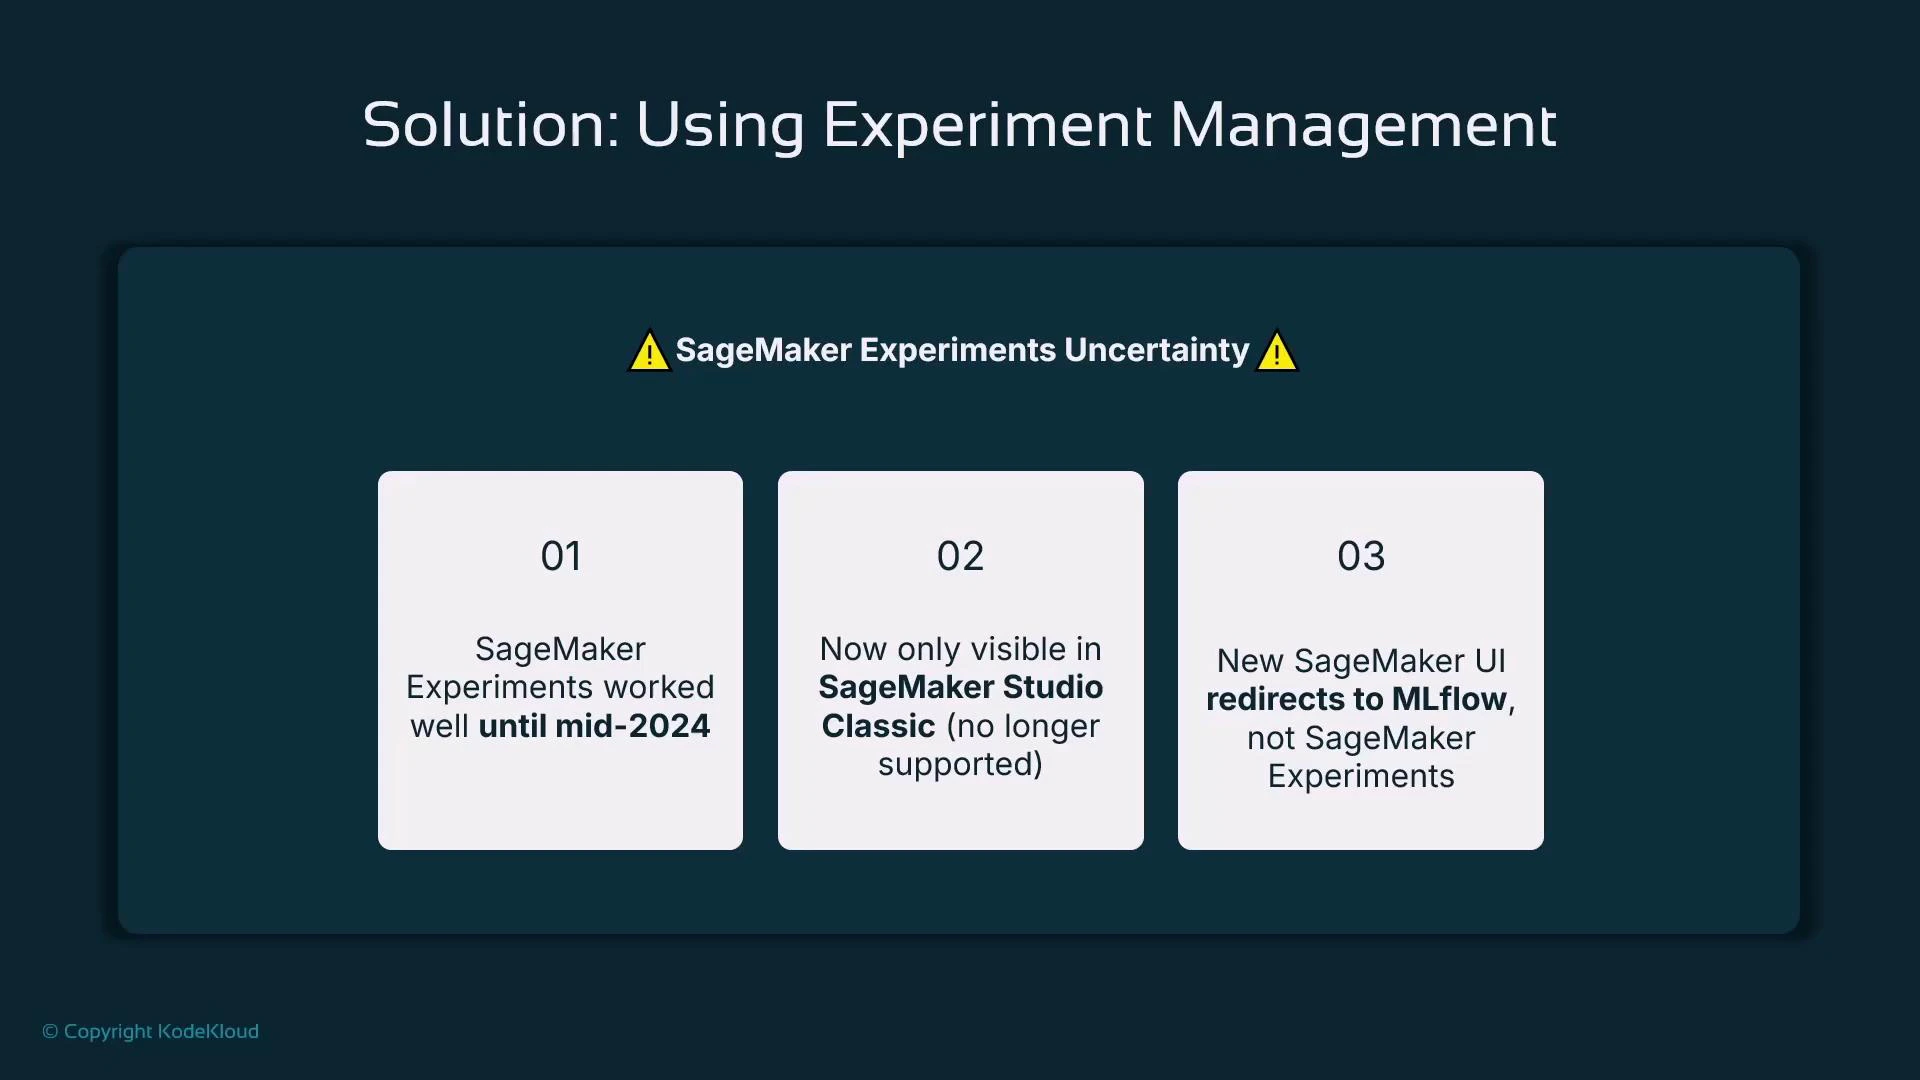
SageMaker Studio Classic continues to expose the original SageMaker Experiments UI, but newer Studio experiences increasingly surface MLflow or third‑party integrations. Consider this when choosing an experiment-management tool for long‑term projects.
Why use experiment management?
- Automatically capture algorithm/container versions, hyperparameters, dataset identifiers, and training artifacts.
- Compare metrics and visualize trends across runs.
- Reproduce successful runs by restoring the recorded inputs and hyperparameters.
- Filter and analyze many runs (for example, show only runs with RMSE < X).
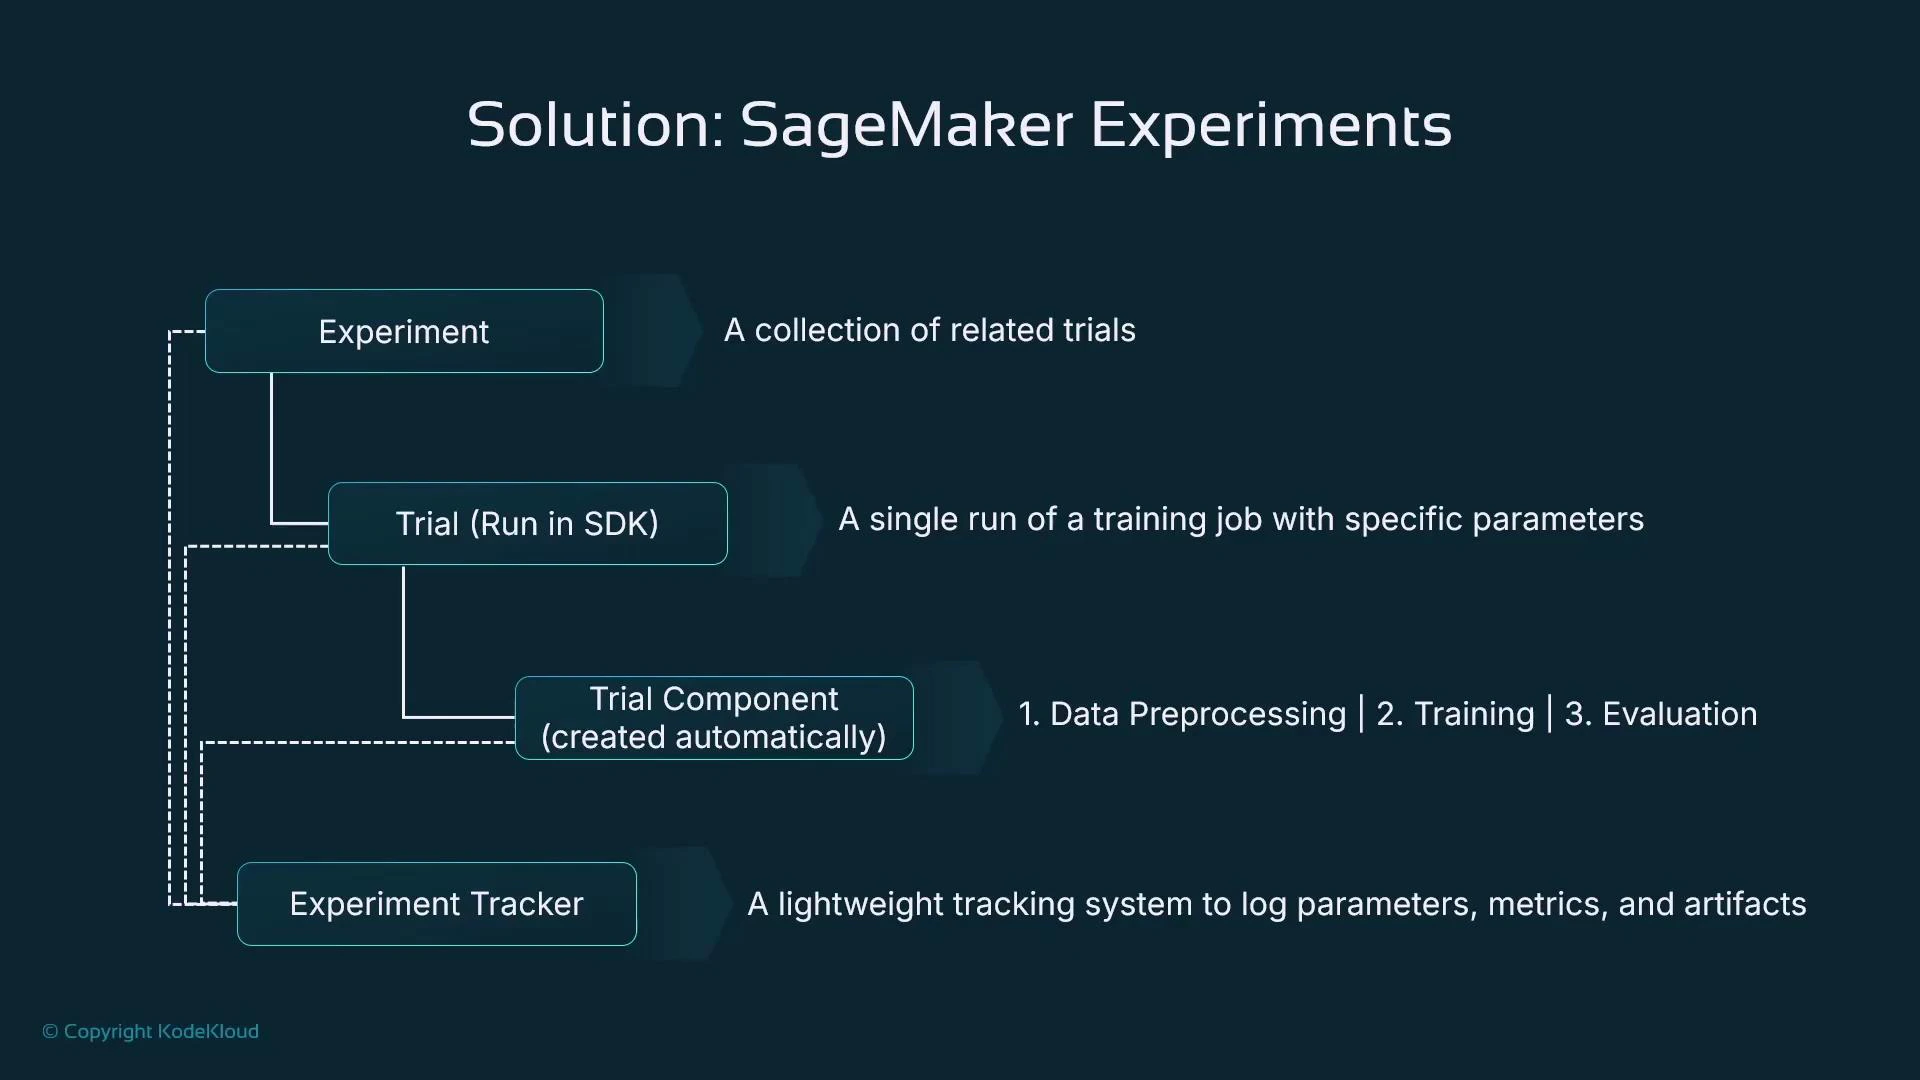
SageMaker Experiments: structure and terminology
SageMaker organizes experiment metadata with a small set of hierarchical objects:
The experiment tracker manages relationships between these objects and provides hierarchical organization for artifacts, parameters, and metrics.
Using the SDK — a code-first workflow
Below is a concise example that demonstrates the typical pattern:- Create an Experiment and Trial.
- Open a Run context.
- Log parameters and metrics.
- Execute a training job inside the Run so that SageMaker automatically associates the training job as a trial component.
- Always call estimator.fit(…) inside the Run context. That ensures the training job becomes a trial component and training metadata are captured automatically.
- The SDK often captures container image, algorithm name, and training-job identifiers for you; explicitly logging hyperparameters and custom metrics improves clarity and searchability.
- Use algorithm-appropriate hyperparameter names (e.g., XGBoost uses “eta” and “num_round”).
Where do results appear?
SageMaker stores experiment metadata and metrics in the backend. Visualization availability depends on your Studio experience:- SageMaker Studio Classic: exposes the original SageMaker Experiments visual dashboard with charts and comparison views.
- Newer Studio experiences: may surface MLflow or other experiment UIs; consider integrating MLflow or a third-party tool if you rely on a consistent UI.
If you depend on Studio UI visualizations, verify which experiment-tracking UI your Studio instance exposes. Many teams adopt MLflow or tools like Weights & Biases for a stable, long‑term visualization and collaboration experience.
- Visualize metrics across trials (line charts, bar charts).
- Compare multiple runs with side-by-side metric views and confusion matrices.
- Filter runs by metric thresholds or parameter values to find promising experiments quickly.
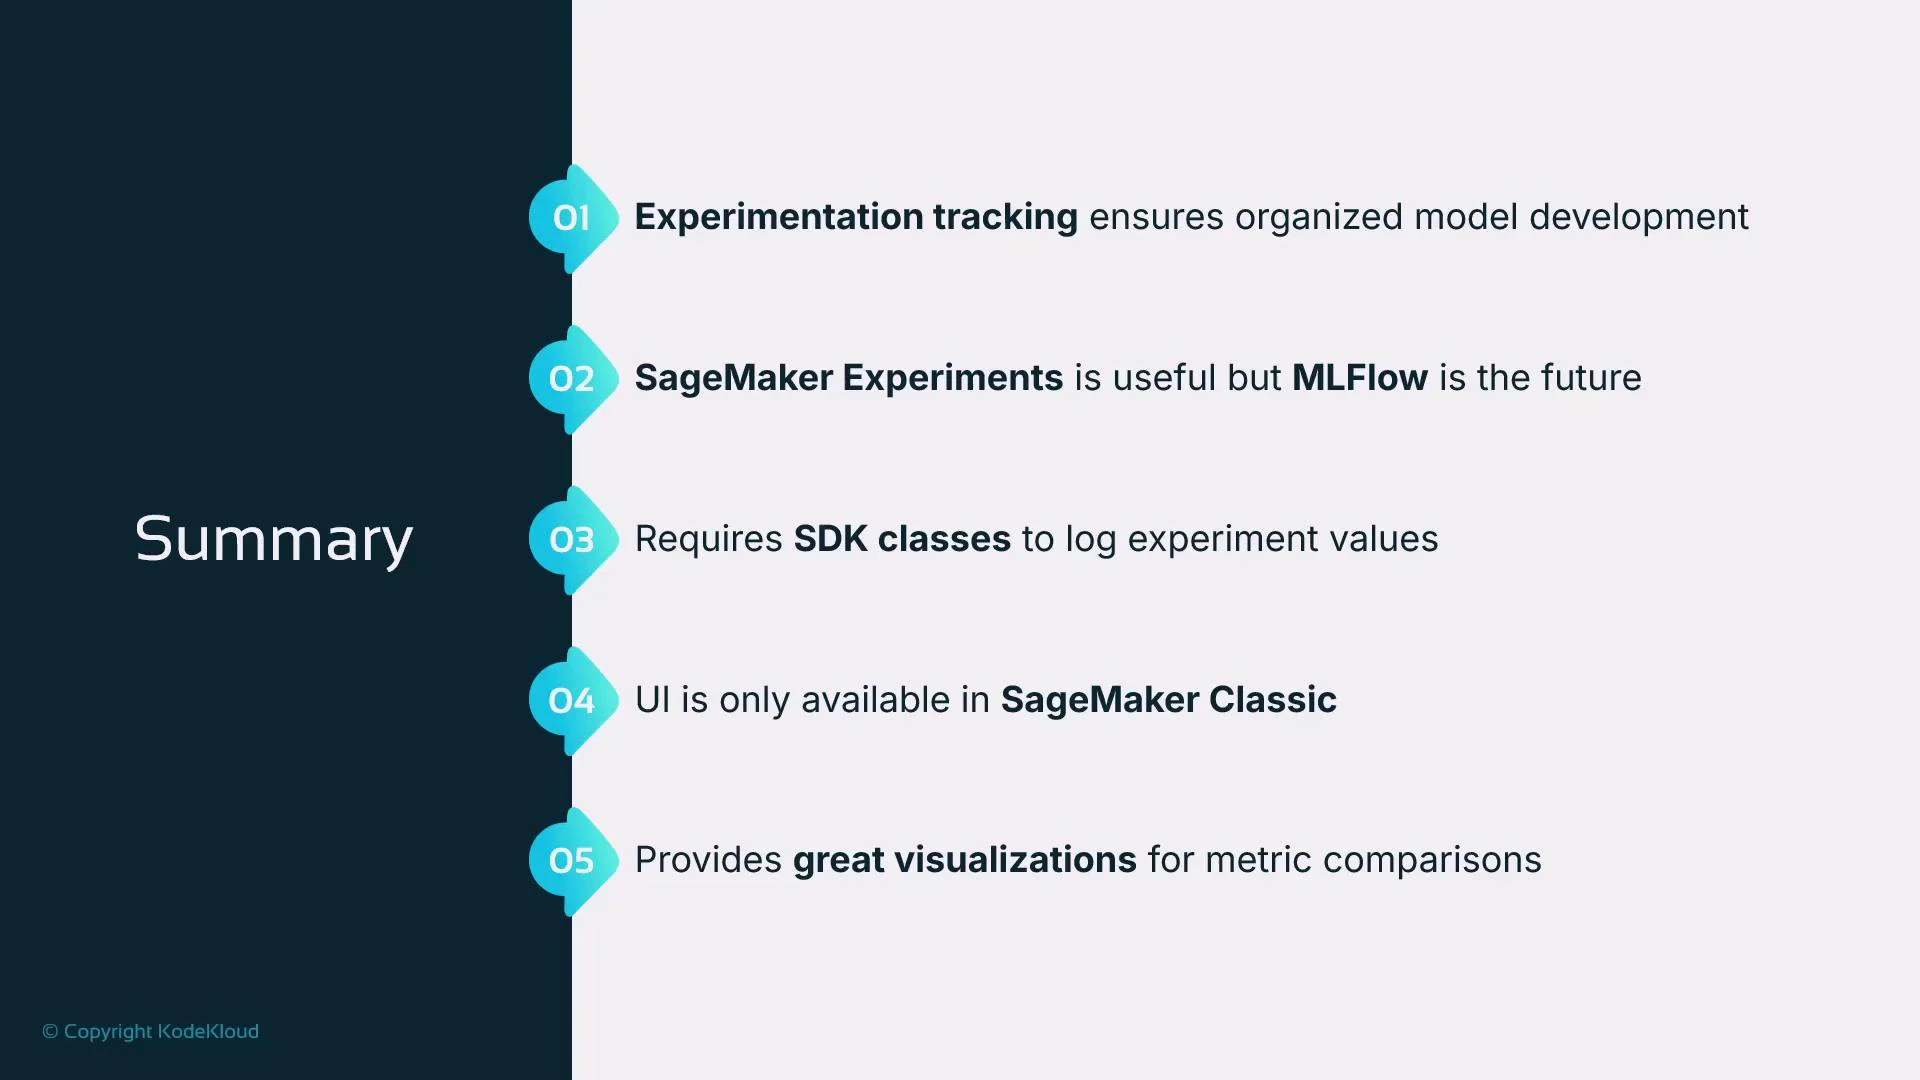
Summary and recommended next steps
- Experiment tracking is essential to organize model development and to make results reproducible.
- SageMaker Experiments (via the SDK) provides a hierarchical model: Experiment → Trial (use Run contexts) → Trial Component.
- Execute training and evaluation jobs inside Run contexts to automatically capture hyperparameters, metrics, and artifacts.
- Because Studio experiences are evolving, evaluate whether to use the native SageMaker Experiments UI, MLflow, or a third-party tool depending on your long-term needs for UI continuity and collaboration.
- SageMaker Experiments docs: https://docs.aws.amazon.com/sagemaker/latest/dg/sagemaker-experiments.html
- MLflow: https://mlflow.org/
- Weights & Biases: https://wandb.ai/
- Neptune: https://neptune.ai/
- TensorBoard: https://www.tensorflow.org/tensorboard