Let’s explore AnalysisTemplates and AnalysisRuns in Argo Rollouts and how they add automated, data-driven gates to your deployments. Imagine an e-commerce site where the shopping cart microservice is critical. A Kubernetes readiness probe only tells you whether the container started — not whether the new version actually behaves correctly under load or user flows. Analysis in Argo Rollouts answers those deeper questions automatically:
  • Is the new version causing more payment failures?
  • Is the add-to-cart flow slower for users?
  • Is the new version crashing or restarting in the background?
AnalysisTemplates and AnalysisRuns let Argo Rollouts act like an automated QA engineer: measuring live signals, evaluating pass/fail conditions, and deciding whether a rollout should proceed or be rolled back.
  • AnalysisTemplate: a reusable, parameterized blueprint that defines what to measure and how to evaluate results.
  • AnalysisRun: a live execution of an AnalysisTemplate that performs the checks and produces a verdict that the Rollout controller observes.
Because AnalysisTemplates are reusable, you can author a single test (for example, an HTTP 5xx rate check) and apply it consistently across shopping cart, login, and search services to enforce uniform quality gates. Why use Analysis in Rollouts?
  • Automate canary validation and reduce human error.
  • Gate promotion based on real metrics instead of simple liveness/readiness.
  • Persist AnalysisRun results for audits and post-mortem debugging.
A flow diagram titled "Argo Rollout Progression Through Analysis" showing rollout stages: Revision 1 with V1 replicas, Revision 2 with V2 canaries being scaled up, an Analysis step with an AnalysisRun and checks, and a final Promotion where V2 is scaled up and V1 scaled down.
How AnalysisTemplates work An AnalysisTemplate is a reusable, parameterized blueprint for health checks. Key fields include:
  • spec.arguments: template inputs (e.g., service name, namespace) so a single template can be reused.
  • spec.metrics: a list of checks. Each metric selects a provider (Prometheus, HTTP, Job) and defines sampling and evaluation controls:
    • For Prometheus: a PromQL query (can reference args).
    • count and interval: number of samples and time between them (e.g., 3 samples, 20s apart).
    • failureLimit: how many failed samples are tolerated before the metric is considered failed.
    • successCondition: an expression evaluated against the query result.
AnalysisTemplates let you centralize test logic. Use args to keep queries generic and portable across environments.
Common metric providers and use cases
Resource TypeUse CaseExample
Prometheus metricMeasure latency, error rate, success ratePromQL query for 5xx rate over last 2m
HTTP webhookExercise an internal endpoint and validate responseCall healthcheck or integration endpoint
Kubernetes JobRun a temporary pod that executes an end-to-end scriptSimulate add-to-cart and checkout flows
Example: Prometheus-based AnalysisTemplate Below is a template that measures HTTP success rate using Prometheus. It accepts service-name and namespace as arguments and runs the PromQL query 3 times, 20s apart. The metric fails if success is below 99% (allowing one failed sample).
apiVersion: argoproj.io/v1alpha1
kind: AnalysisTemplate
metadata:
  name: api-performance-check
spec:
  args:
  - name: service-name
  - name: namespace
  metrics:
  - name: check-success-rate
    provider:
      prometheus:
        address: http://prometheus.kube-prometheus-stack.svc.cluster.local:9090
        query: |
          sum(rate(http_requests_total{service_name="{{args.service-name}}",namespace="{{args.namespace}}",code!~"5.*"}[2m]))
          /
          sum(rate(http_requests_total{service_name="{{args.service-name}}",namespace="{{args.namespace}}"}[2m]))
    count: 3
    interval: 20s
    failureLimit: 1
    successCondition: result >= 0.99
Ensure Argo Rollouts has network access to your Prometheus server (the provider address) and that Prometheus is configured to retain the required metrics at the desired scrape interval. Misconfigured queries or unreachable endpoints will cause AnalysisRuns to fail.
How AnalysisRuns integrate with rollouts When a rollout needs to validate a new version, Argo Rollouts creates an AnalysisRun from the referenced AnalysisTemplate. The AnalysisRun:
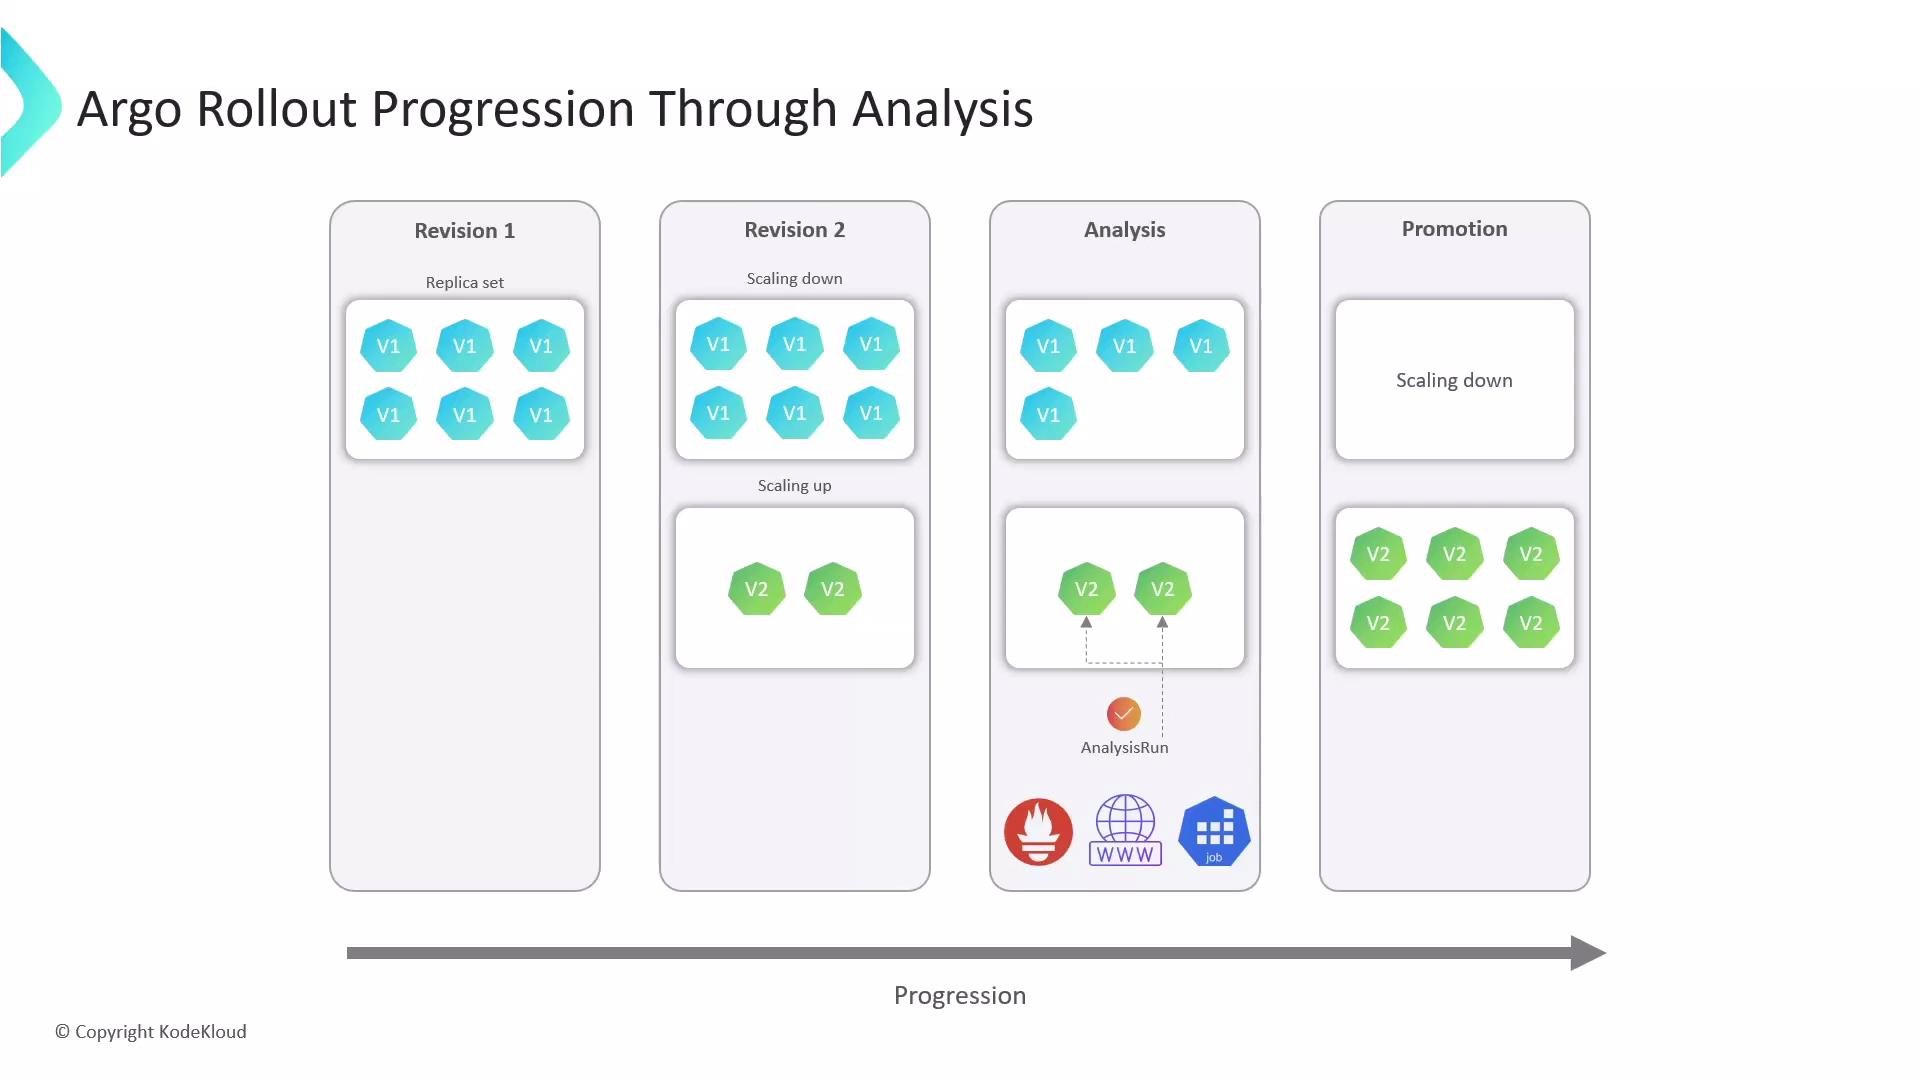
  • Executes the configured checks (PromQL, HTTP, or Jobs).
  • Reports status: Running, Succeeded, Failed.
  • Stores a verdict and logs for later inspection.
  • Is watched by the Rollout controller, which will proceed, pause, or roll back based on the verdict.
Because AnalysisRuns persist, they provide valuable data for debugging and auditing failed promotions. Background analysis vs inline analysis You can use an AnalysisTemplate in two main modes:
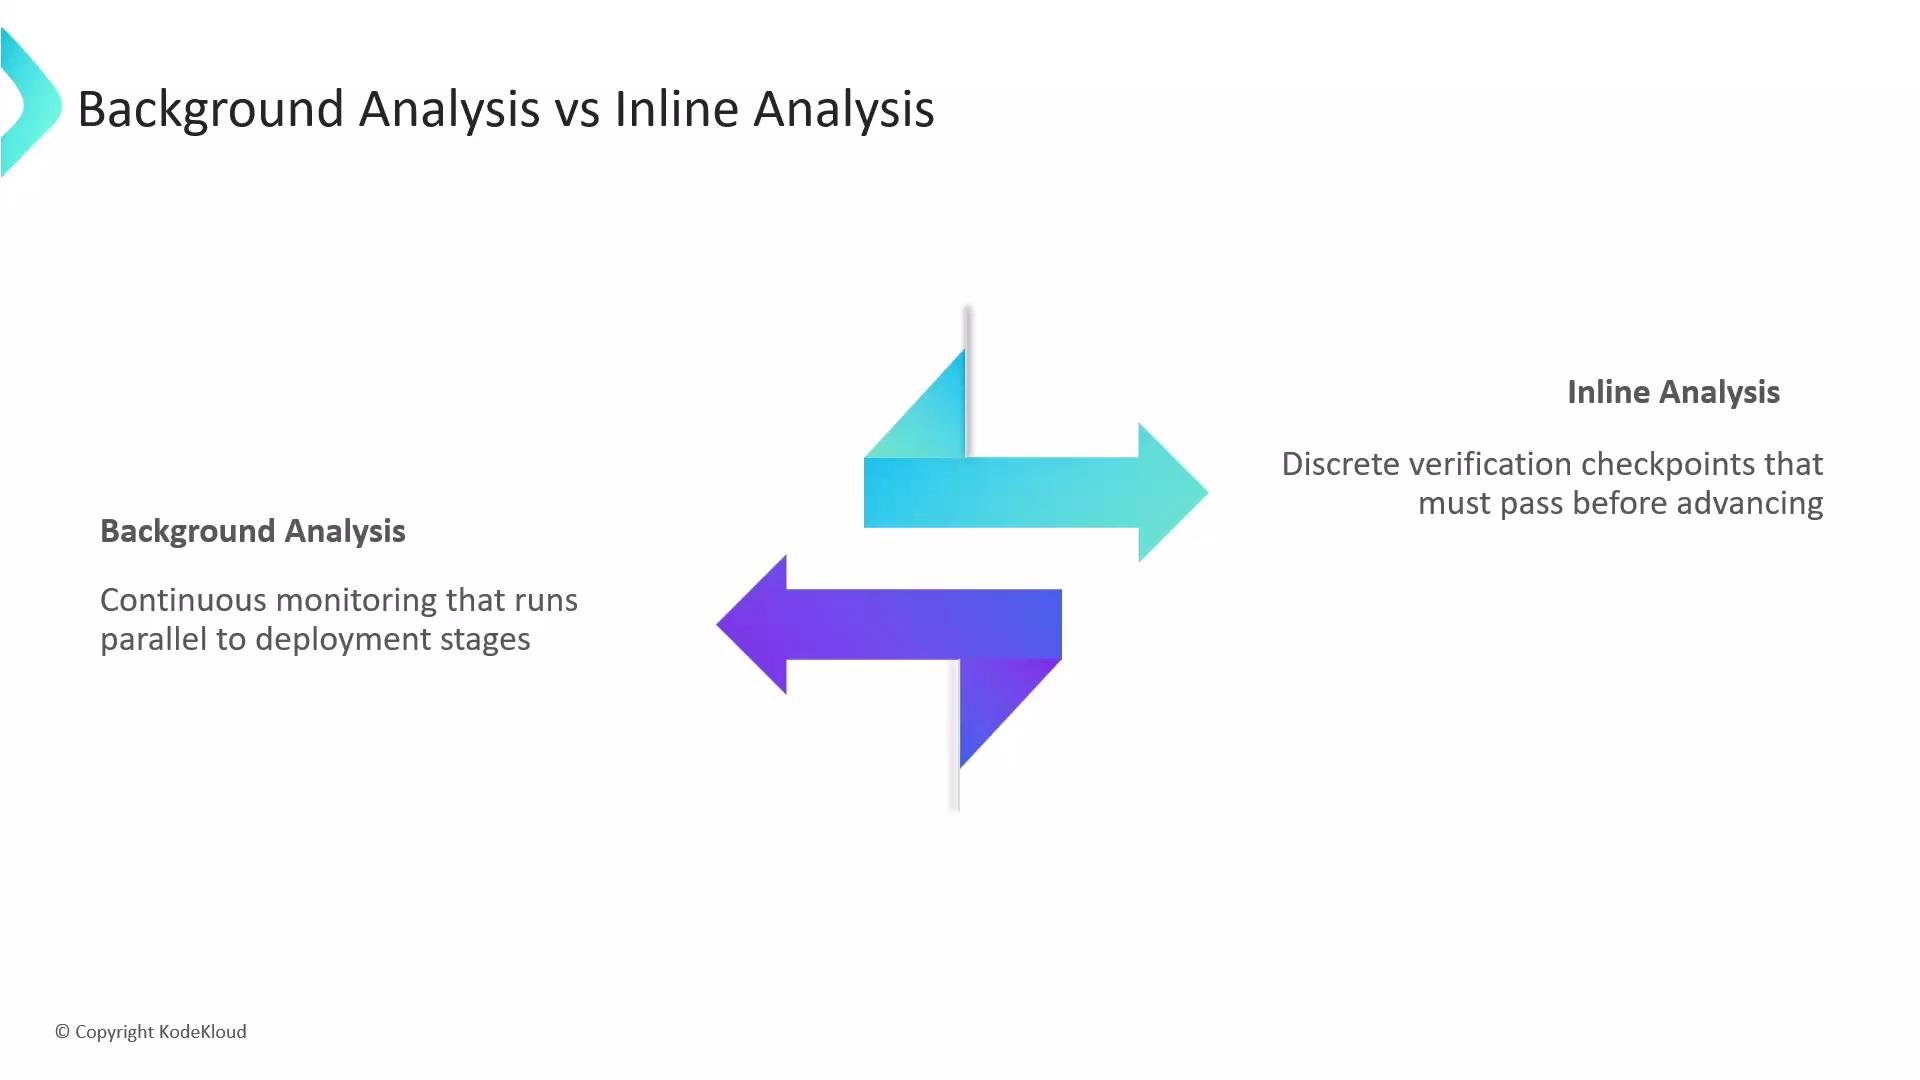
  • Background analysis (continuous monitoring):
    • Runs continuously in the background while the rollout progresses.
    • Does not block rollout steps; runs in parallel.
    • If it fails, the rollout can be marked degraded and reverted.
  • Inline analysis (blocking verification):
    • Runs as an explicit step in the rollout steps list.
    • The rollout waits for the analysis to finish before proceeding.
    • If it fails, the rollout halts and typically rolls back immediately.
Example: background analysis in a canary rollout This variant increases canary weight by 20% every 10 minutes while a background AnalysisRun begins at step 2 and monitors the canary continuously.
apiVersion: argoproj.io/v1alpha1
kind: Rollout
metadata:
  name: api-app
spec:
  replicas: 6
  selector:
    matchLabels:
      app: api-app
  template:
    metadata:
      labels:
        app: api-app
    spec:
      containers:
      - name: api-app
        image: example/api-app:latest
  strategy:
    canary:
      analysis:
        templates:
        - templateName: api-performance-check
        startingStep: 2
        args:
        - name: service-name
          value: app-svc.default.svc.cluster.local
        - name: namespace
          value: default
      steps:
      - setWeight: 20
      - pause: {duration: 10m}
      - setWeight: 40
      - pause: {duration: 10m}
      - setWeight: 60
      - pause: {duration: 10m}
      - setWeight: 80
      - pause: {duration: 10m}
Example: inline analysis as a blocking step Here, the rollout sends 20% traffic to the canary, pauses 5 minutes, then runs the AnalysisTemplate as a blocking analysis step before proceeding.
apiVersion: argoproj.io/v1alpha1
kind: Rollout
metadata:
  name: api-app
spec:
  replicas: 6
  selector:
    matchLabels:
      app: api-app
  template:
    metadata:
      labels:
        app: api-app
    spec:
      containers:
      - name: api-app
        image: example/api-app:latest
  strategy:
    canary:
      steps:
      - setWeight: 20
      - pause: {duration: 5m}
      - analysis:
          templates:
          - templateName: api-performance-check
            args:
            - name: service-name
              value: app-svc.default.svc.cluster.local
            - name: namespace
              value: default
A presentation slide titled "Background Analysis vs Inline Analysis" that contrasts background continuous monitoring with inline discrete verification, illustrated by a pair of opposing teal and purple arrows in the center.
Blue/Green: pre-promotion and post-promotion analysis Blue/Green rollouts offer two critical analysis touchpoints:
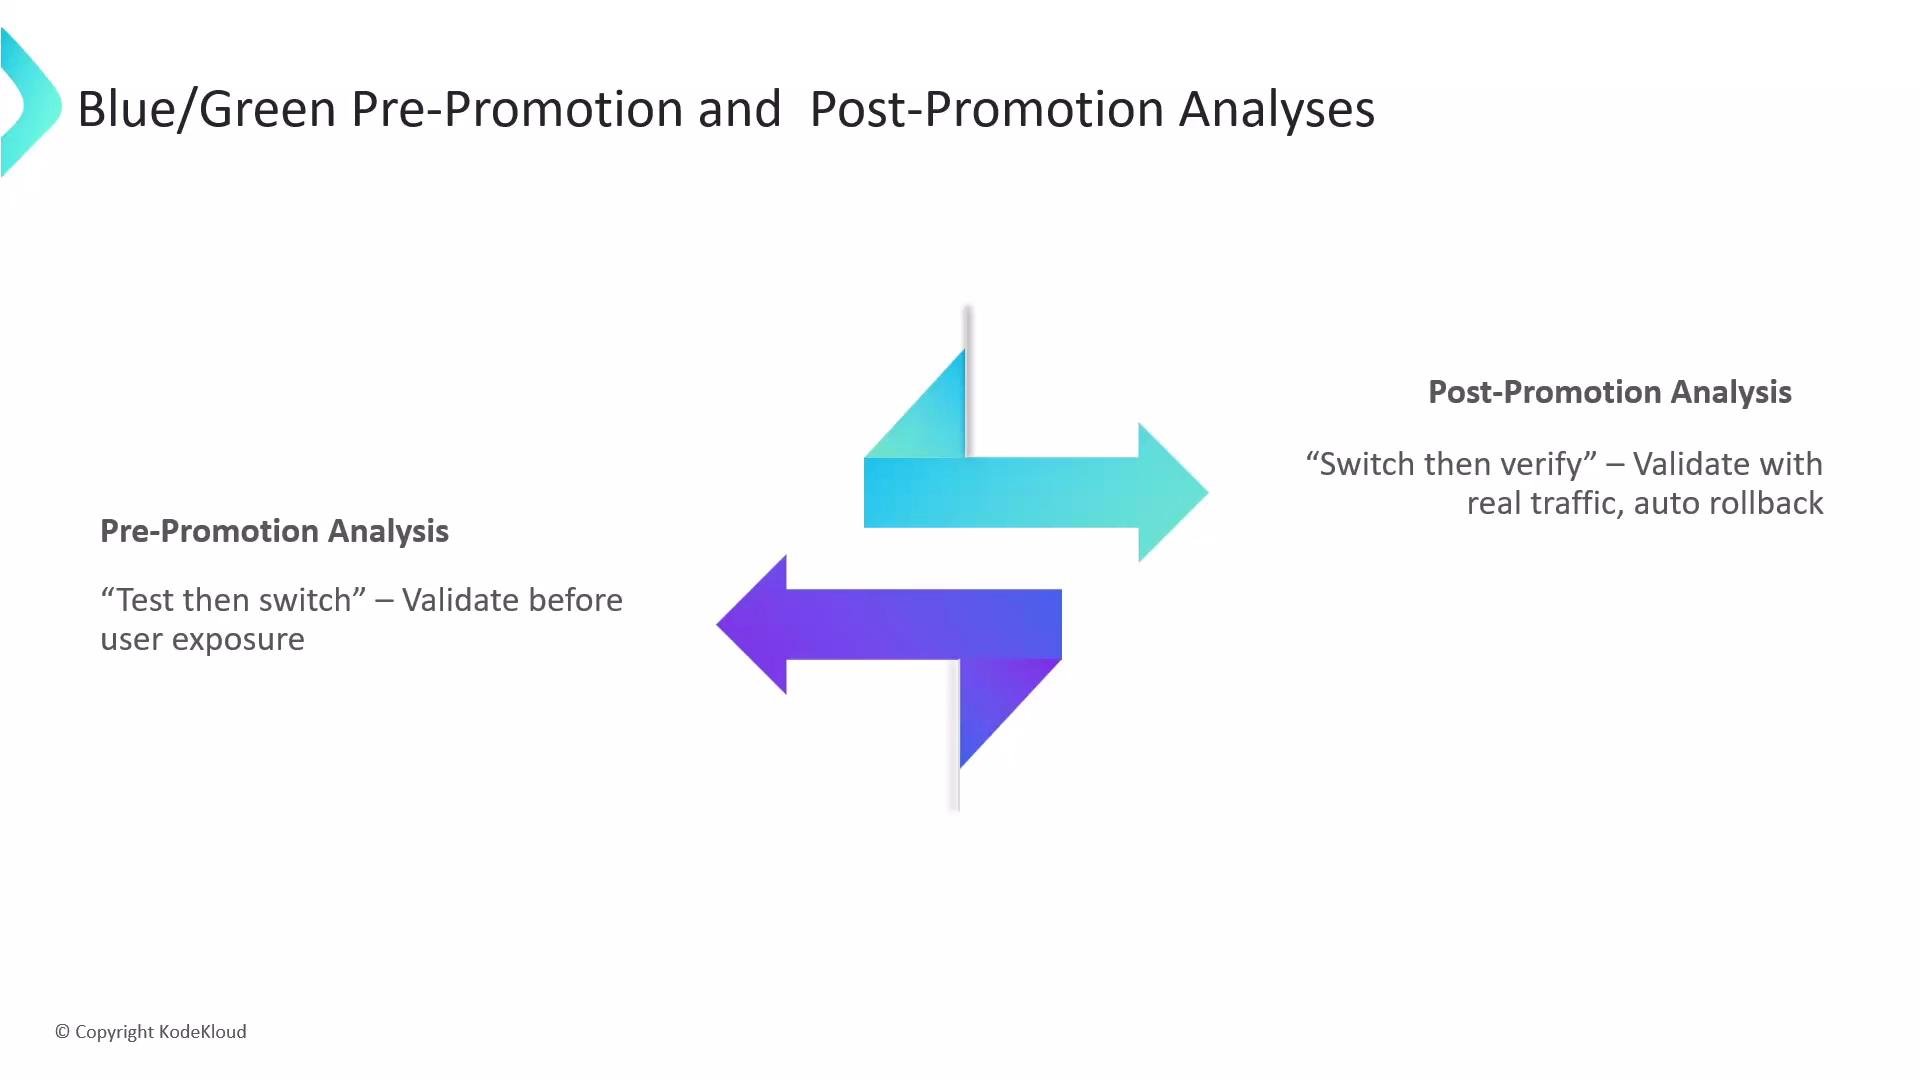
  • Pre-promotion analysis (test-then-switch): validate the preview replica set before routing live traffic to it.
  • Post-promotion analysis (switch-then-verify): validate the active replica set after switching traffic, enabling automatic rollback if problems appear.
Pre-promotion analysis (test-then-switch)
  • The preview replica set is validated in isolation.
  • Traffic switching is blocked until the pre-promotion AnalysisRun succeeds.
  • If it fails, traffic never shifts to the new preview version.
Example pre-promotion analysis:
apiVersion: argoproj.io/v1alpha1
kind: Rollout
metadata:
  name: api-app
spec:
  replicas: 6
  selector:
    matchLabels:
      app: api-app
  template:
    metadata:
      labels:
        app: api-app
    spec:
      containers:
      - name: api-app
        image: example/api-app:latest
  strategy:
    blueGreen:
      activeService: active-svc
      previewService: preview-svc
      prePromotionAnalysis:
        templates:
        - templateName: api-performance-check
          args:
          - name: service-name
            value: preview-svc.default.svc.cluster.local
          - name: namespace
            value: default
Post-promotion analysis (switch-then-verify)
  • After the switch, the new active version is validated under real traffic.
  • If post-promotion analysis fails, the rollout can automatically revert traffic to the previous stable version.
  • Use scaleDownDelaySeconds to keep the previous version around for a short time to make rollback faster.
Example post-promotion analysis:
apiVersion: argoproj.io/v1alpha1
kind: Rollout
metadata:
  name: api-app
spec:
  replicas: 6
  selector:
    matchLabels:
      app: api-app
  template:
    metadata:
      labels:
        app: api-app
    spec:
      containers:
      - name: api-app
        image: example/api-app:latest
  strategy:
    blueGreen:
      activeService: active-svc
      previewService: preview-svc
      scaleDownDelaySeconds: 600 # 10 minutes
      postPromotionAnalysis:
        templates:
        - templateName: api-performance-check
          args:
          - name: service-name
            value: preview-svc.default.svc.cluster.local
          - name: namespace
            value: default
A presentation slide titled "Blue/Green Pre-Promotion and Post-Promotion Analyses" showing a teal right-pointing arrow and a purple left-pointing arrow. It contrasts Pre-Promotion ("Test then switch" — validate before user exposure) with Post-Promotion ("Switch then verify" — validate with real traffic, auto rollback).
Verdicts, persistence, and debugging
  • AnalysisRun objects persist in the cluster and include metric results, timestamps, and logs.
  • Use AnalysisRun history for audits and root-cause analysis of failed rollouts.
  • The Rollout controller watches AnalysisRun verdicts and acts automatically (promote, continue, or rollback).
Summary
  • AnalysisTemplate: reusable blueprint defining checks (Prometheus, HTTP, Job) and pass/fail logic.
  • AnalysisRun: live execution of a template that produces a verdict used by the Rollout controller.
  • Use background analysis for continuous monitoring, inline analysis to block progression, and pre/post promotion analyses for Blue/Green deployments.
  • Persisted AnalysisRun objects provide auditable evidence and aid post-mortems.
This lesson covered how AnalysisTemplates and AnalysisRuns enable data-driven rollout gating to keep faulty versions out of production. Links and references

Watch Video