

What you’ll install
- Argo Rollouts controller and CRDs
- RBAC and ConfigMap for the controller
- A ClusterIP metrics Service (exposes metrics internally)
- kubectl-argo-rollouts plugin to access the UI locally
Install Argo Rollouts
Apply the official install manifest. This creates theargo-rollouts namespace, CRDs, RBAC, the controller Deployment, Service, ConfigMap, and related resources.
Run:
Example output you may see after applying the manifest:
argo-rollouts namespace:
The Rollouts controller exposes metrics via a ClusterIP Service (internal to the cluster). It does not provide an externally hosted dashboard by default — to view the Rollouts UI locally, install the kubectl plugin which proxies the dashboard to your machine.
Install the kubectl-argo-rollouts plugin
The Rollouts UI is accessed through the kubectl plugin binarykubectl-argo-rollouts, which registers as kubectl argo rollouts. Download the appropriate binary for your OS/architecture from the Argo Rollouts GitHub releases page.
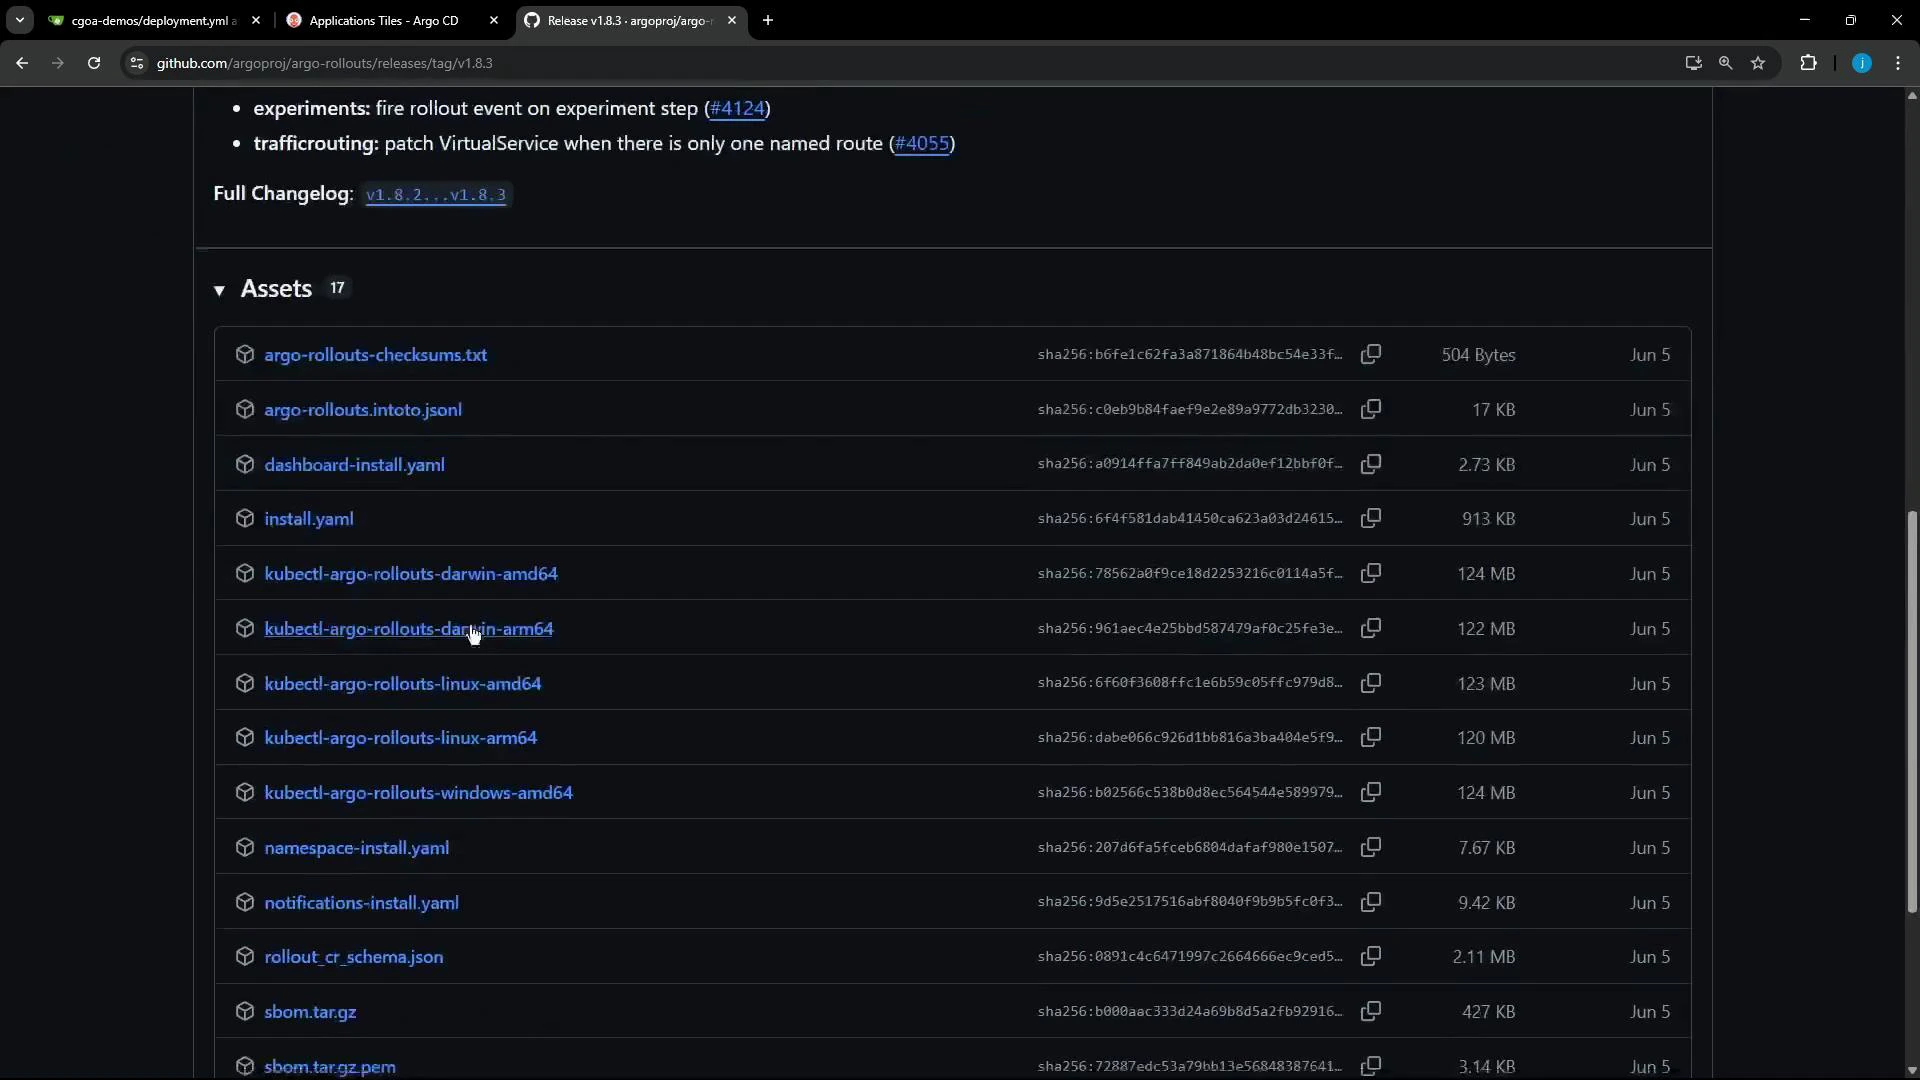
After installing the binary as /usr/local/bin/kubectl-argo-rollouts the plugin is available as the kubectl subcommand
kubectl argo rollouts.Launch the Rollouts dashboard
Start the local dashboard proxy to serve the UI on http://localhost:3100/rollouts by default:- The command opens a local proxy and hosts the UI at http://localhost:3100/rollouts.
- If you don’t pass
-n, the plugin will target thedefaultnamespace or the context’s current namespace; use-n <namespace>to specify another one. - If you prefer a different local port, check plugin help for available flags.
Next steps
- Create a Rollout manifest (canary or blue-green) and apply it to experiment with traffic shifting and automated analysis.
- Integrate metrics providers (Prometheus) and AnalysisTemplates for automated, metric-driven promotion or rollback.
- See the Argo Rollouts docs for examples and advanced configuration: https://argoproj.github.io/argo-rollouts/