

triple-moo. The steps template models a list of lists: each outer list element (a step group) runs sequentially, and each item inside an inner list runs in parallel with the other items in that same group.
Key concepts:
- Outer list elements = sequential groups (one group runs after the previous completes).
- Inner list items = tasks that run in parallel within their group.
The steps template structure is a list of lists. Each top-level list element is a step group executed sequentially; items inside that group (an inner list) execute in parallel.
Example workflow
In this workflow:- The first step group contains a single step
first-moothat runs first. - After
first-moocompletes, the second step group runs two items in parallel:parallel-moo-aandparallel-moo-b. - All steps call the
cow-saystemplate and pass amessageparameter.
How execution proceeds
- Argo executes the first outer list element — the group containing
first-moo. - Once
first-moosucceeds, Argo proceeds to the next outer list element. - The next group contains
parallel-moo-aandparallel-moo-b; those run concurrently.
Sample logs
When you inspect the logs forfirst-moo, you’ll see the cowsay output such as:
parallel-moo-a and parallel-moo-b) will produce its own cowsay output when they run.
Previewing the execution graph
You can preview how the workflow will execute before submitting it using the Argo Workflows UI. Paste the YAML into the UI and choose the graph view to see the sequence and parallelism visually.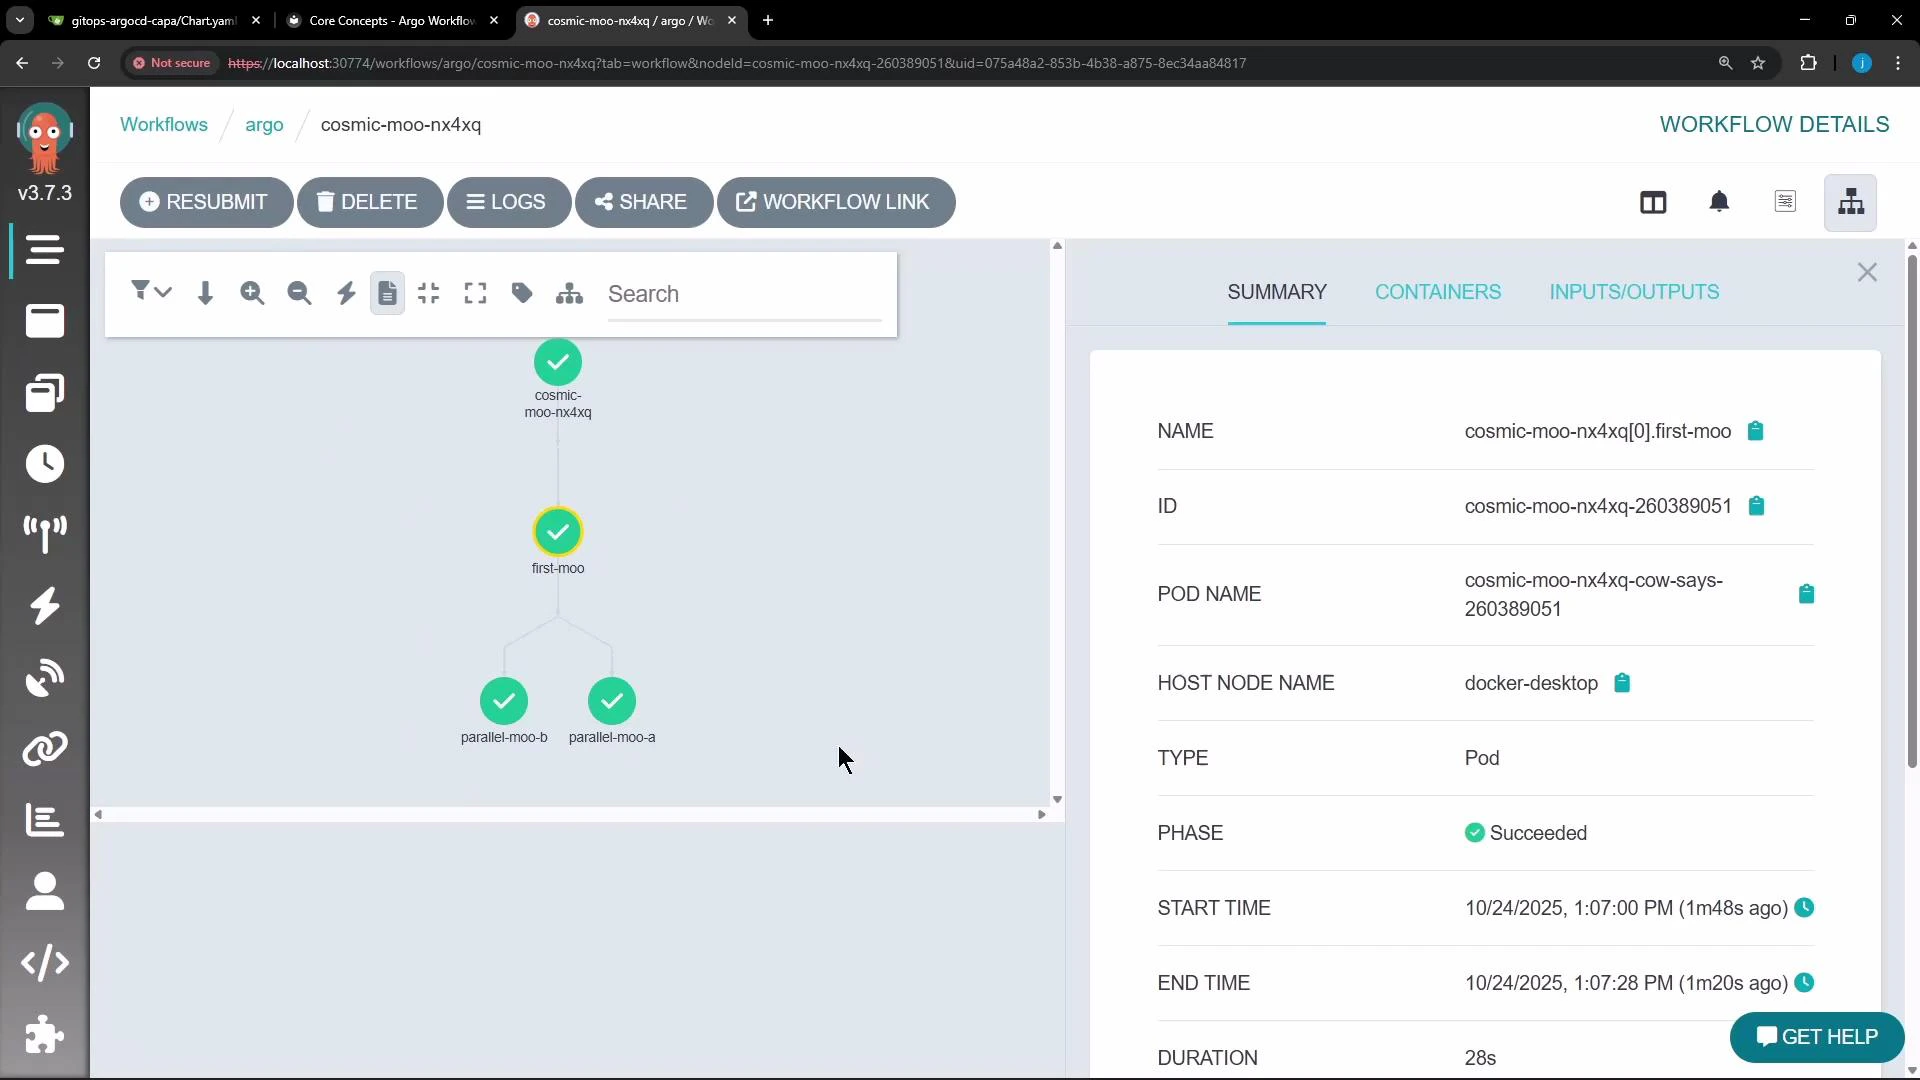
Links and references
- Argo Workflows: https://argoproj.github.io/argo-workflows/
- Argo Workflows concepts: https://argoproj.github.io/argo-workflows/workflows/what-is-workflow/
- Docker image used in example: https://hub.docker.com/r/rancher/cowsay