In this lesson we deploy a faulty version of the application and observe how Argo Rollouts automatically aborts (and scales down) the update when a pre-promotion AnalysisRun fails. This demonstrates how analysis protects production traffic by preventing automatic promotion of unhealthy revisions.

What you’ll see

  • Run the faulty image locally to inspect its health endpoint.
  • Update the Rollout to use the faulty image and observe a new preview ReplicaSet and preview Service.
  • The Rollout runs a pre-promotion AnalysisRun against the preview Service; the analysis records repeated non-2xx responses and fails.
  • Argo Rollouts aborts the update, scales down the preview ReplicaSet, and leaves the stable/active revision serving production traffic.
Run these steps in the argo-analysis-lab namespace (or adapt the namespace used by your Rollout). Make sure you have the Argo Rollouts kubectl plugin installed: https://argoproj.github.io/argo-rollouts/commands/kubectl-argo-rollouts/

1) Run the faulty image locally and check its /health endpoint

Start the container locally to inspect its health endpoint:
Expected container output:
From the host, query the health endpoint:
This faulty build returns a 400 payload:

2) Update the Rollout to use the error image and watch the pre-promotion AnalysisRun

When the Rollout is updated to use the faulty image in the argo-analysis-lab namespace, Argo Rollouts creates a new revision (ReplicaSet) and a preview Service, then executes the configured pre-promotion AnalysisRun against that preview Service. Check cluster resources:
Condensed sample output (shows existing stable ReplicaSet and the new preview ReplicaSet in ContainerCreating):
The preview Service (new revision) returns the same 400 error when probed, while the active/stable Service continues to return 200 OK. Preview (failing revision):
Active/stable revision:
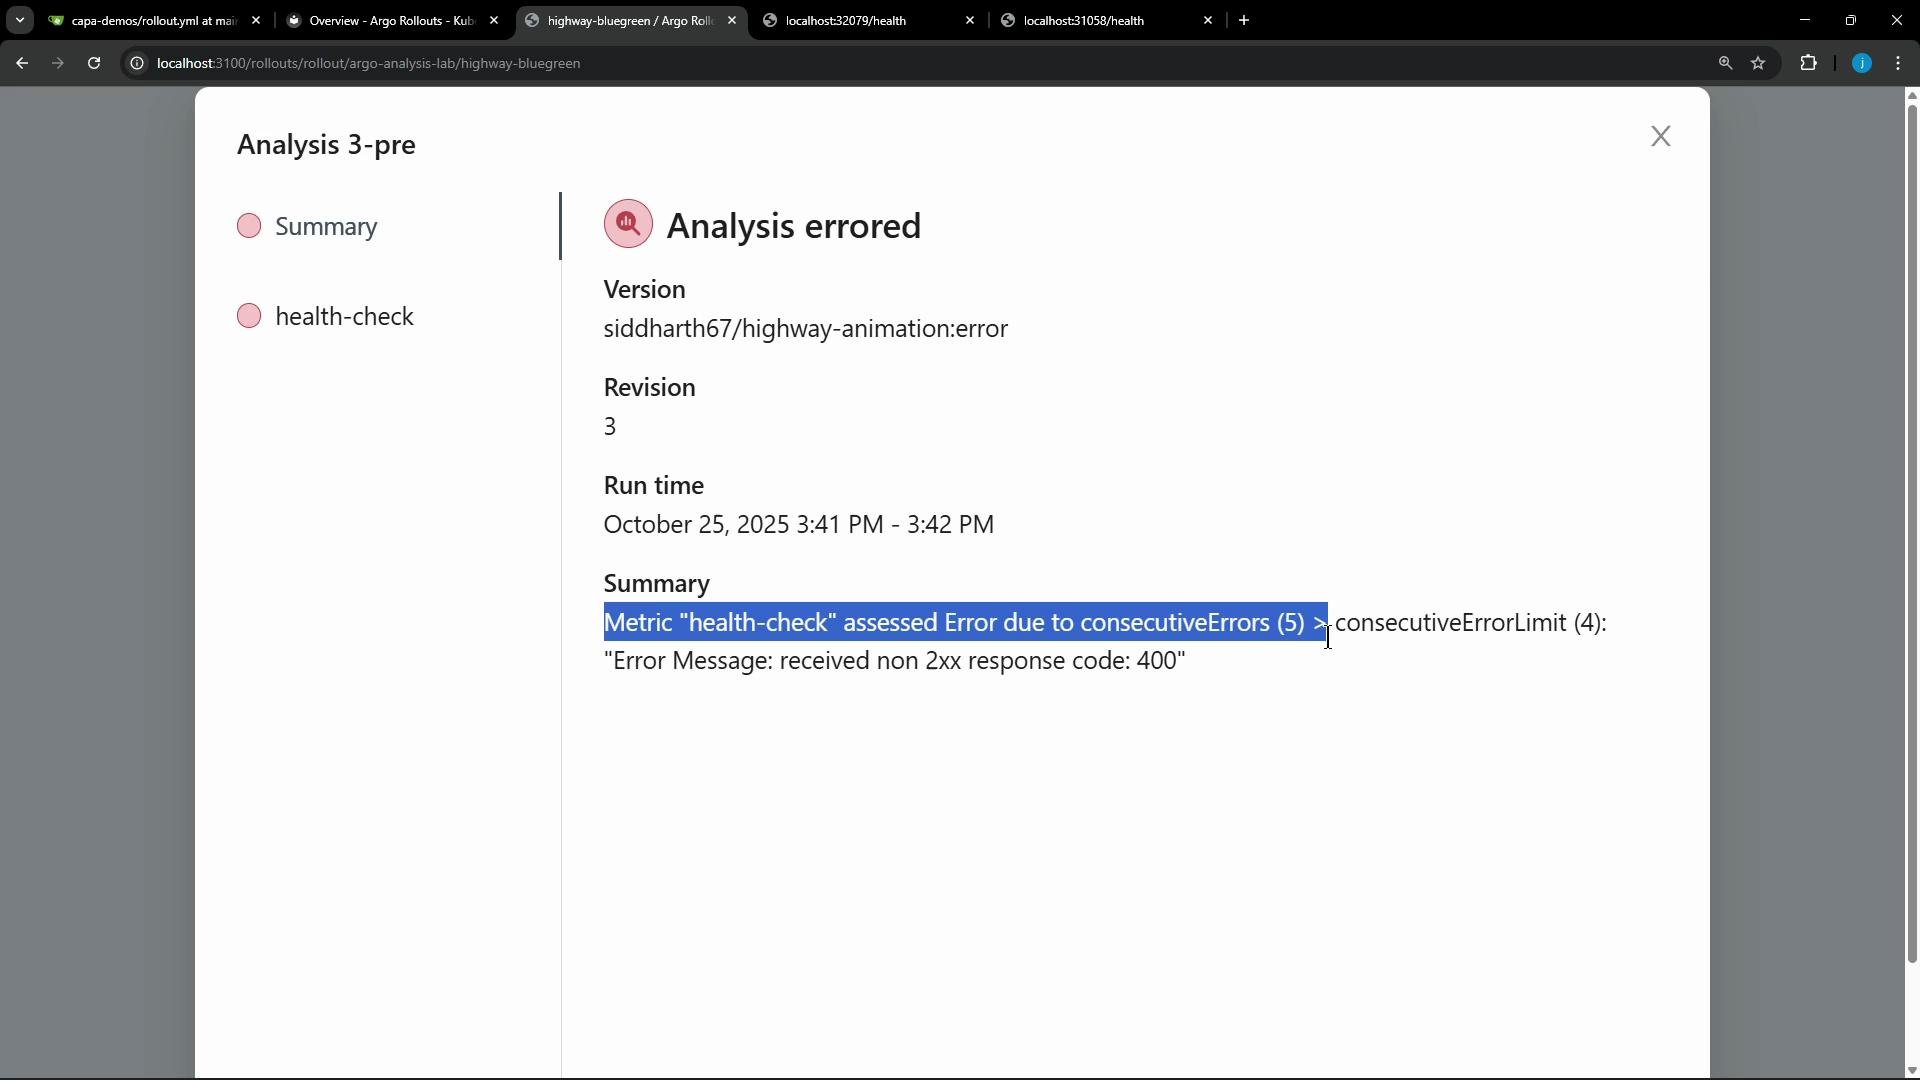
Because the AnalysisRun metric observed non-2xx responses repeatedly, it reached the configured consecutive-error threshold and the analysis aborted. The Rollouts UI and console display the metric failure and the reason:
Screenshot of an "Analysis errored" dialog from a deployment dashboard (Argo Rollouts) showing version siddharth67/highway-animation:error, revision 3, and a run time. The summary reports the "health-check" metric failed with 5 consecutive errors (exceeding the limit of 4) and the error message "received non 2xx response code: 400".
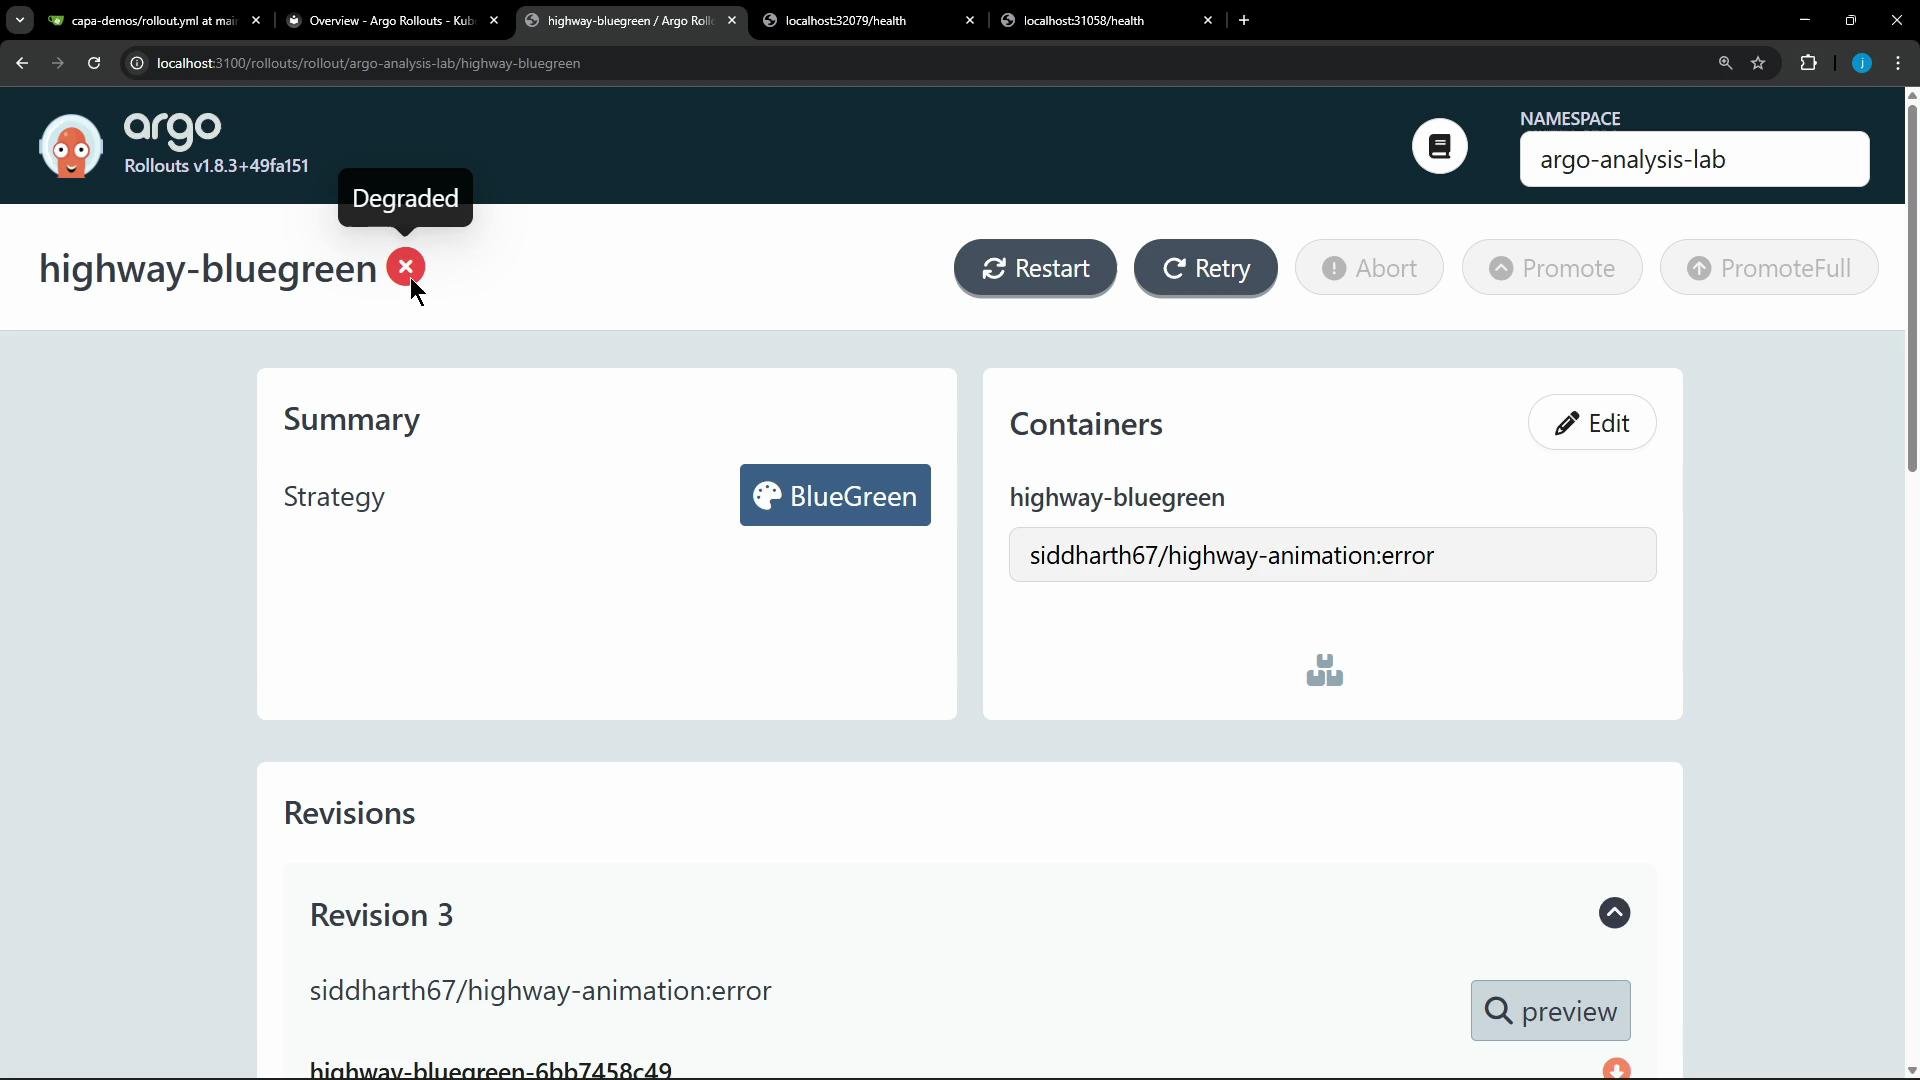
When the analysis fails, the Rollout controller scales down the preview ReplicaSet and marks the Rollout as degraded/aborted so production traffic is not promoted to the faulty revision:
A screenshot of the Argo Rollouts web UI for a rollout named "highway-bluegreen" showing a red "Degraded" status, BlueGreen strategy, and container image "siddharth67/highway-animation:error". The page also shows Restart/Retry buttons and revision details.
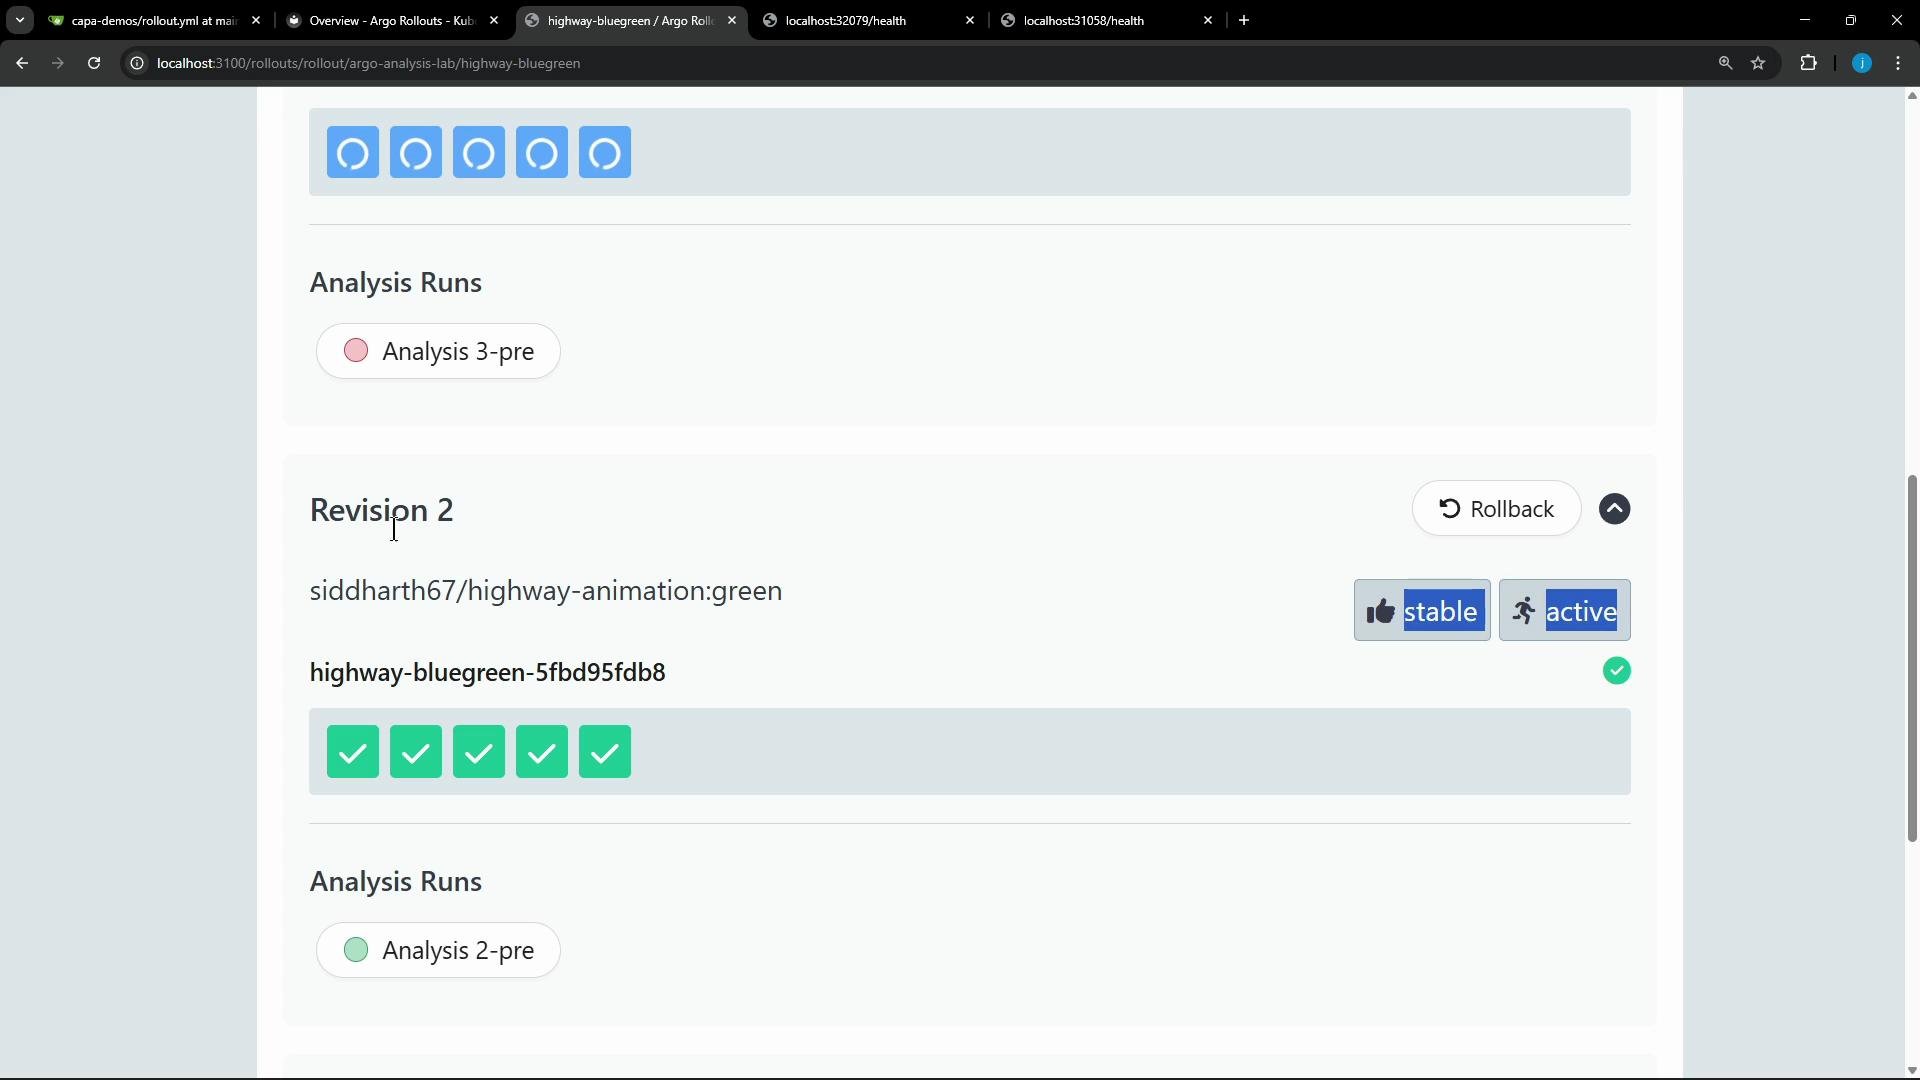
The production/active revision remains unchanged and continues serving live users:
A screenshot of a web UI showing "Revision 2" for the deployment siddharth67/highway-animation:green with several green checkmark status indicators. It also shows "stable" and "active" badges and sections labeled "Analysis Runs."
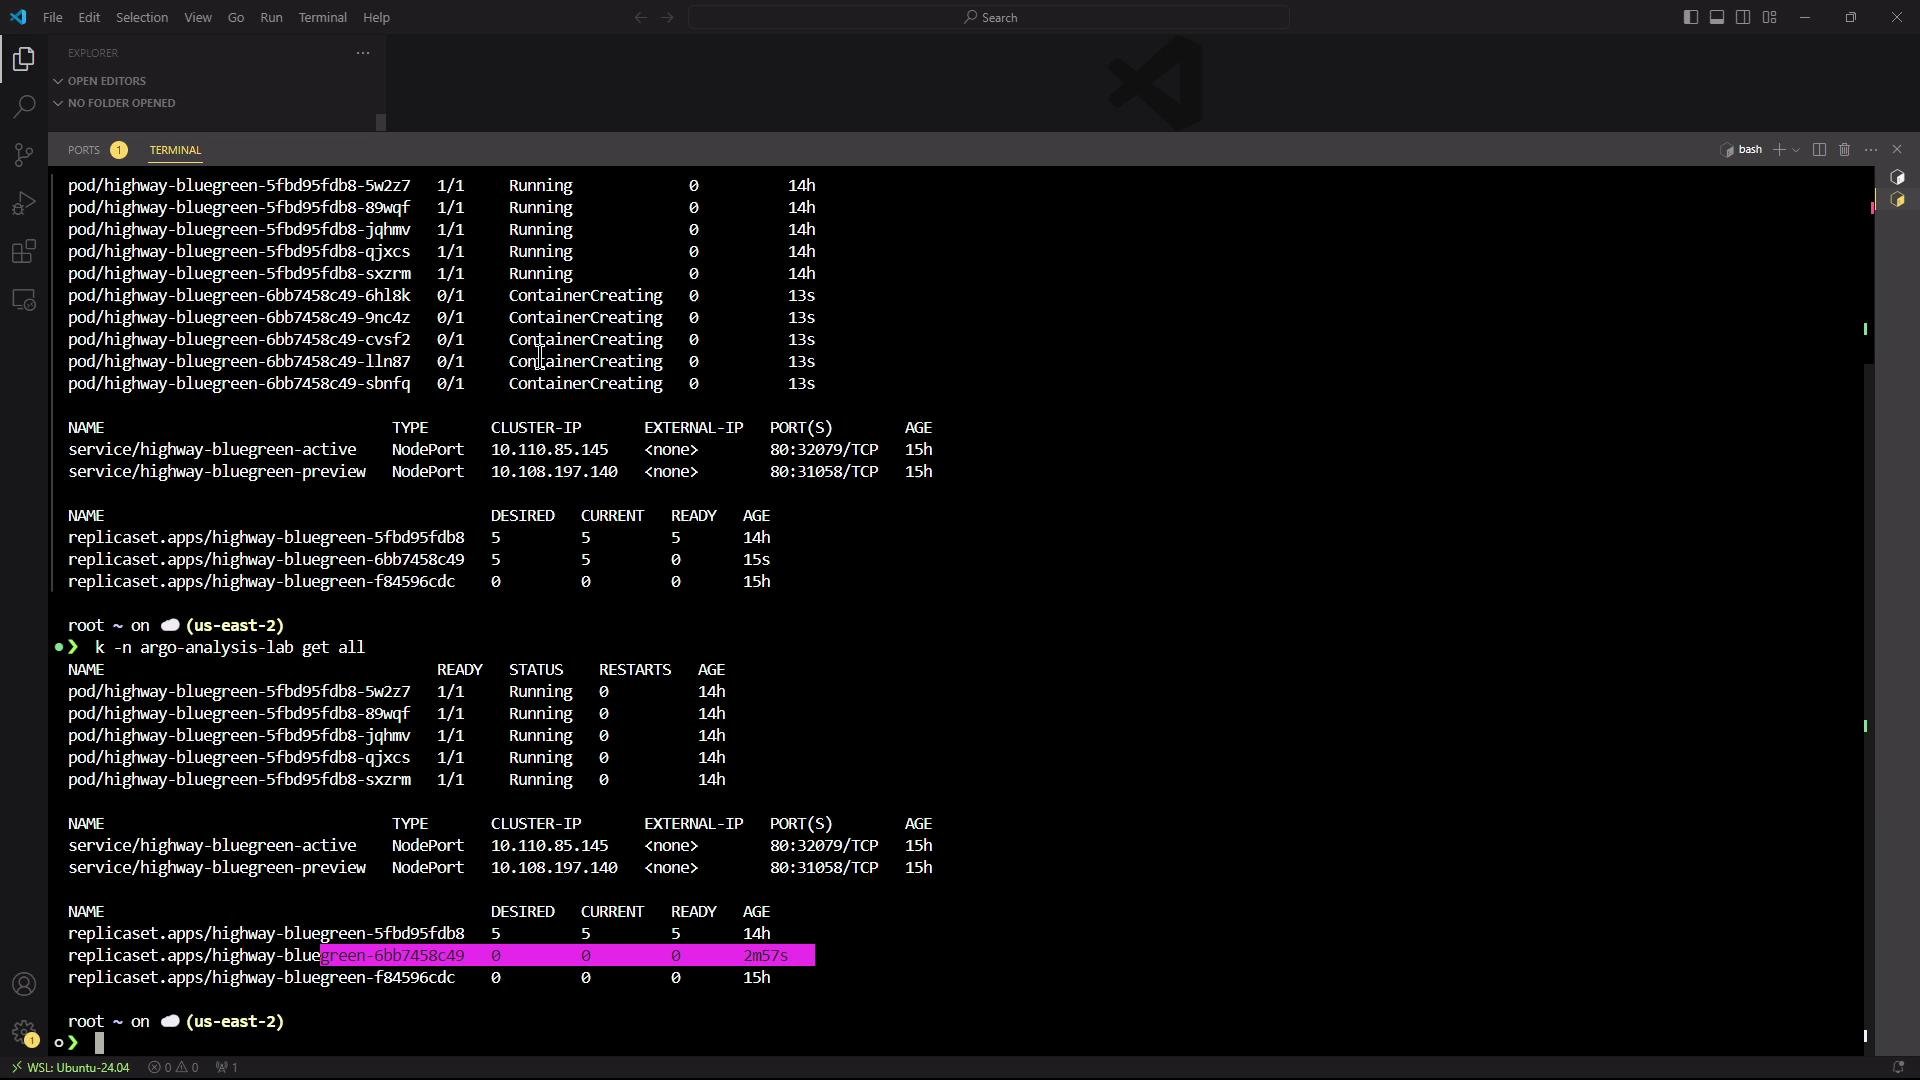
After the analysis aborted, the preview ReplicaSet was scaled down to zero while the stable ReplicaSet stayed healthy:
A screenshot of a VS Code window showing a terminal with kubectl output listing Kubernetes pods, services and replica sets for a "highway-bluegreen" deployment. Several pods are shown as Running while others are in ContainerCreating, and NodePort services with cluster IPs/ports are visible.

3) Inspect Rollout and AnalysisRun status

Use the Argo Rollouts kubectl plugin to view the Rollout status and the abort message:
Condensed sample output showing the aborted update and the message:
List AnalysisRuns in the namespace to see which runs succeeded and which failed:
Example output:
Describe the failing AnalysisRun to see per-measurement results, including the consecutive error count and metric messages:
Condensed excerpt:

4) Where analysis fits into Rollout strategies

  • BlueGreen: analysis can run pre-promotion against the preview Service (as in this demo). The Rollout will only switch active traffic after the pre-promotion analysis succeeds.
  • Canary: analysis can be used as a background analysis (runs continuously during the canary rollout) or as an inline step analysis (runs at a specific step/weight).
Example: configure an analysis to start after a specific canary step (start after step that sets weight to 40%):
Example: inline analysis as a canary step (analysis runs as a step):

5) AnalysisTemplate example (Prometheus-based metric)

A reusable AnalysisTemplate that queries Prometheus and uses success/failure thresholds:
You can run AnalysisRuns standalone by creating an AnalysisRun object directly (inline metrics or referencing templates). AnalysisTemplates can be defined cluster-wide and referenced with clusterScope: true to reuse them across namespaces. Example referencing a cluster-scoped template:

Quick reference: useful commands


Summary

  • Argo Rollouts runs AnalysisRuns against preview or canary services before promotion.
  • If analysis metrics do not meet configured success conditions (for example, repeated non-2xx HTTP responses), the AnalysisRun fails.
  • When the AnalysisRun fails, the Rollout aborts the update, scales down the preview ReplicaSet, and prevents production traffic from being promoted to the faulty revision.
  • Use AnalysisTemplates (namespace-scoped or cluster-scoped) to standardize health and success checks across Rollouts.
Always verify analysis metrics and thresholds carefully. Incorrect thresholds or misconfigured queries can cause false positives (abort a healthy rollout) or false negatives (allow unhealthy releases).

Watch Video

Practice Lab