Bob the Software Doctor and Mysterious Application Ailments
A software troubleshooter uses OpenTelemetry traces metrics and logs via a collector to correlate signals identify root causes and reduce incident resolution time
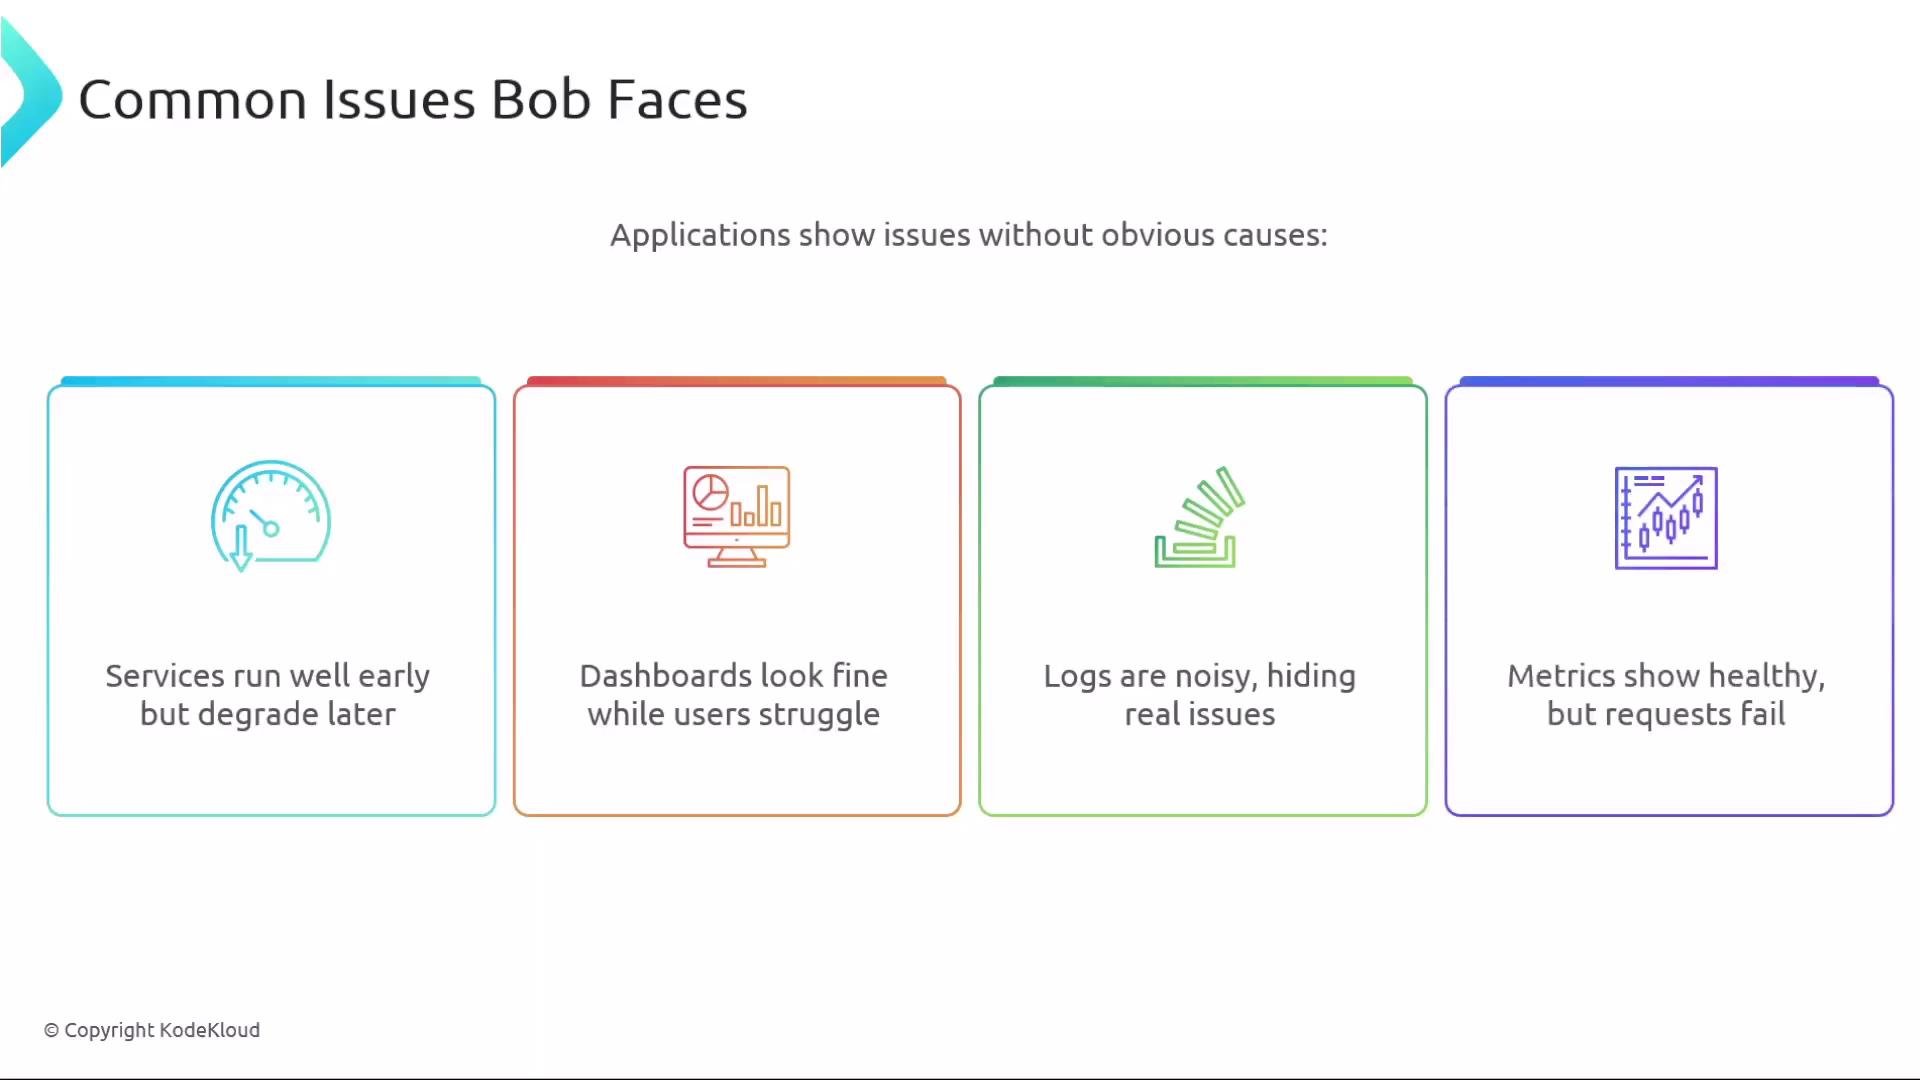
Meet Bob, our software doctor.Bob is the person teams call when systems behave oddly—pages time out, services slow, or users report issues without clear errors. His role is to diagnose mysterious application ailments that aren’t obvious at first glance: intermittent latency, noisy logs, misleading dashboards, and missing traces.Applications often present symptoms without a clear smoking gun. A service might run well in the morning but degrade by afternoon. Dashboards can appear healthy while users struggle. Logs may be noisy and bury the useful events. Metrics can look normal even as requests fail.
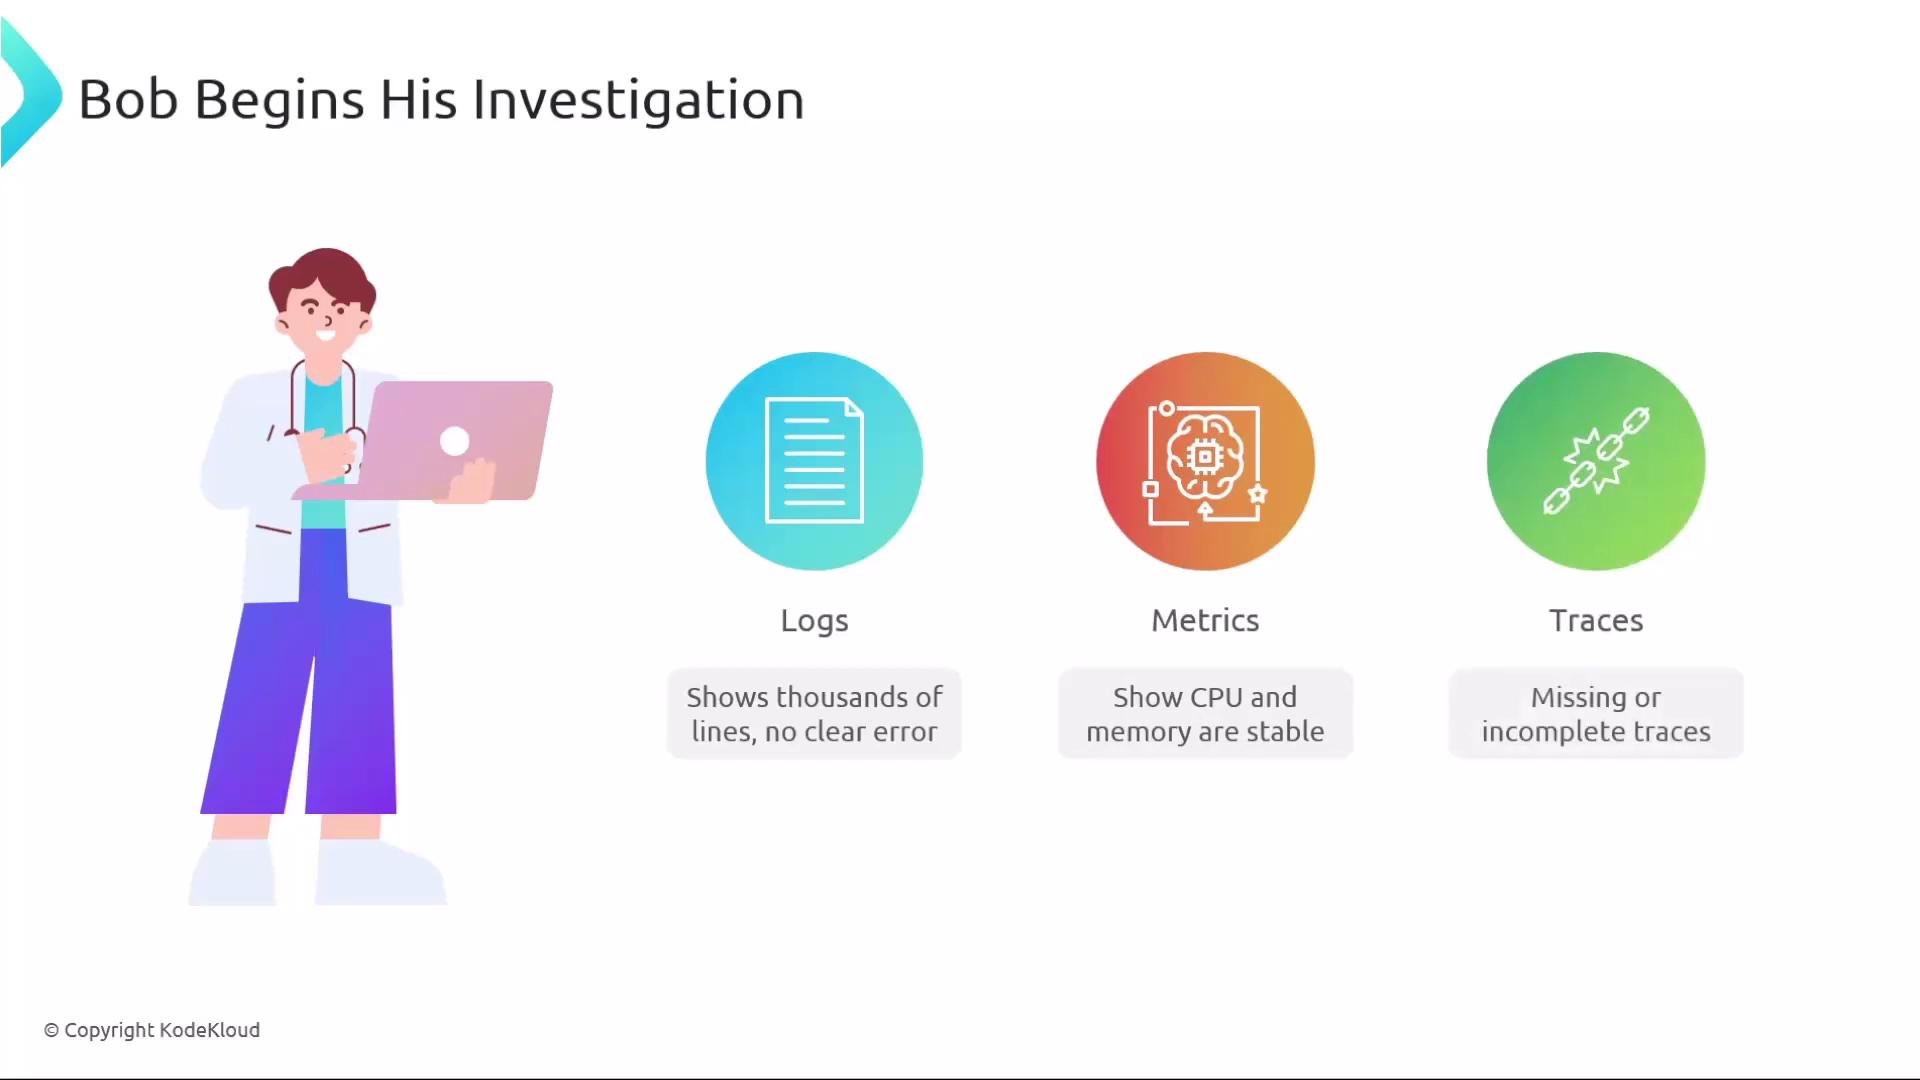
A real ticket arrives: an ID, a timestamp, and a terse subject—“Application acts slow, please fix ASAP.” That’s all.Bob starts the investigation. Logs produce thousands of lines with no obvious errors. Metrics show CPU and memory well within expected ranges. Traces are missing or incomplete, leaving critical blind spots in the request flow. With only fragments of evidence, Bob is forced to guess—slowing down incident response and increasing mean time to resolution (MTTR).
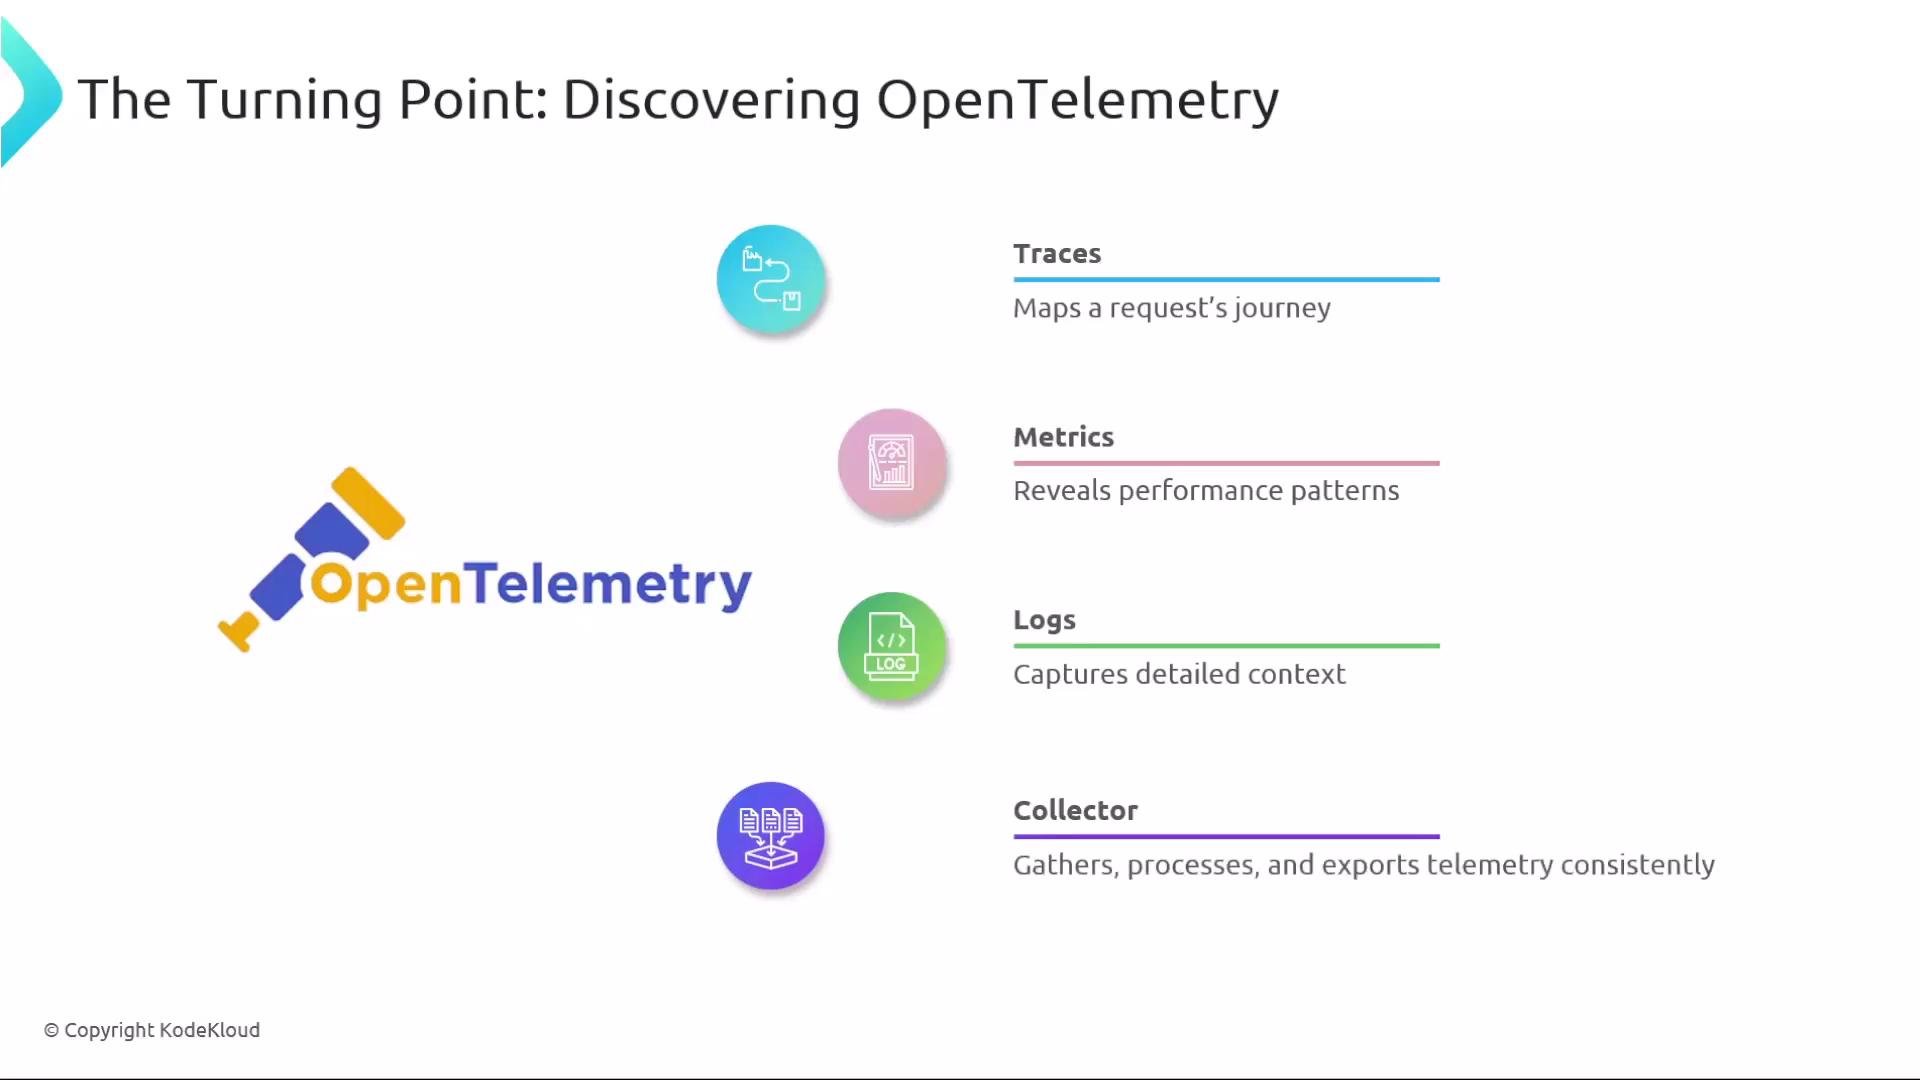
What Bob is seeing are symptoms, not the root cause. Dashboards and charts reveal trends but often lack the context needed to explain failures. In medicine you order tests and review history; in software you need complete telemetry to perform an accurate diagnosis.To get the full picture, Bob adopts a vendor-neutral telemetry framework—OpenTelemetry—to capture the three complementary signals and to centralize processing through a collector:
Traces: map the path of a request across distributed services to show where latency and errors occur.
Metrics: surface aggregated performance trends and resource patterns over time.
Logs: record detailed events and contextual information useful for debugging single requests.
Collector: aggregates, processes, and exports telemetry consistently across environments.
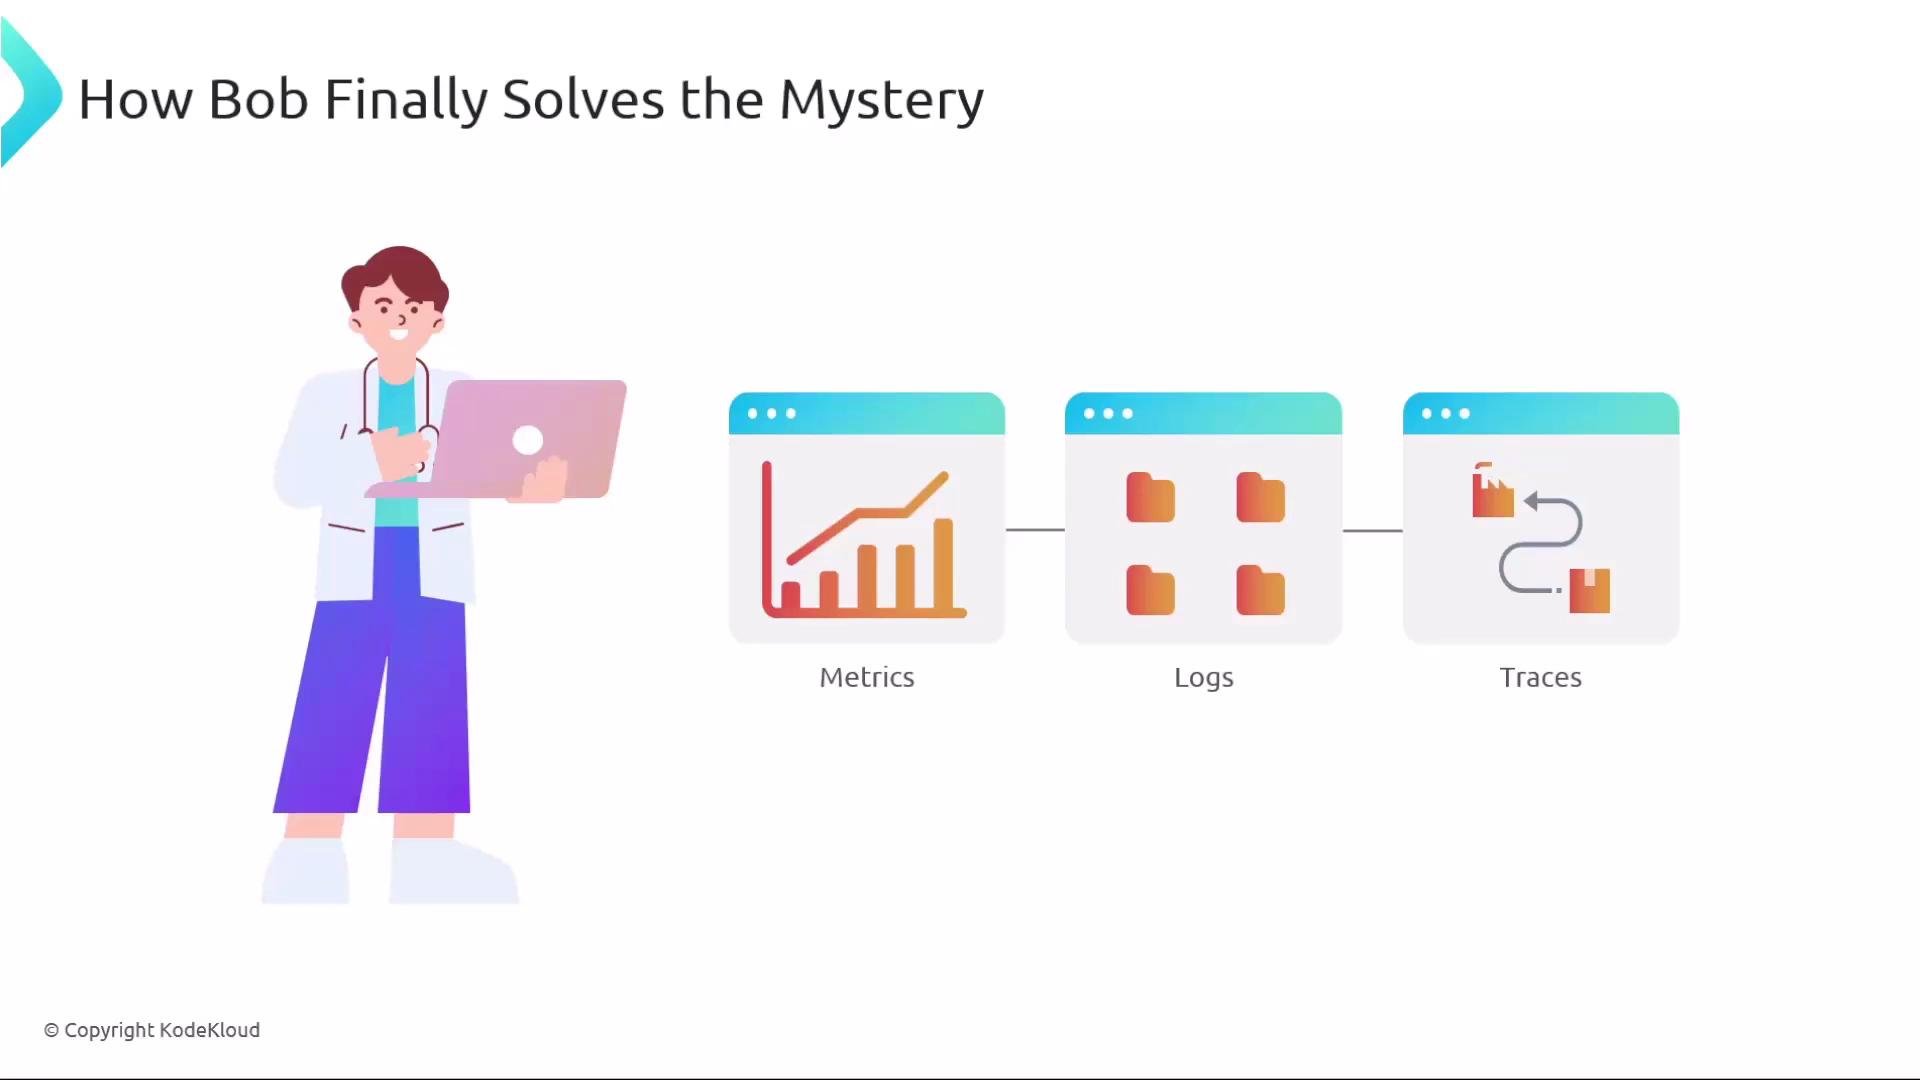
Traces, metrics, and logs are most powerful when correlated: traces point to the problematic component, metrics reveal trends and scope, and logs provide the contextual details required to fix root causes.
For quick reference, here’s how the signals and the collector complement each other:
Signal / Component
Primary purpose
Best used for
Traces
Map request flows across services and measure latency per span
Root cause analysis of slow or failing requests
Metrics
Aggregate performance counters and resource usage over time
Detecting trends like CPU spikes or memory leaks
Logs
Detailed, per-event contextual information
Debugging specific errors or unexpected behavior
Collector
Centralized aggregation, processing, and exporting of telemetry
Consistent telemetry delivery across environments and vendors
With traces, metrics, and logs correlated through the collector, Bob finally gets the full picture. For example:
A trace shows a downstream dependency timing out on certain spans.
Metrics reveal a gradual increase in response time and memory utilization preceding the incidents.
Logs include contextual errors and stack traces tied to the same request IDs found in traces.
Correlating these signals points directly to the root cause—whether it’s a dependency timeout, a memory leak, or a misconfiguration—so Bob can fix the problem faster and with confidence.
Why Bob’s story matters to youThis scenario mirrors common production incidents: incomplete data slows diagnosis, ambiguous tickets force guesswork, and incident pressure demands rapid, accurate answers. Adopting a unified telemetry strategy—instrumenting with OpenTelemetry and using a collector—shifts troubleshooting from guesswork to evidence-based diagnosis and reduces MTTR.Key takeaways:
Instrument services for traces first to map request flows, then enrich with metrics and logs.
Use a collector for consistent telemetry routing, sampling, and vendor-agnostic exports.
Correlate signals by request IDs or span IDs to move from symptoms to root cause quickly.
Important: Telemetry is only useful if you collect the right signals and retain linkable identifiers (like trace IDs). Instrumentation gaps or inconsistent identifiers will create blind spots—even with a collector in place.