

What is tracing?
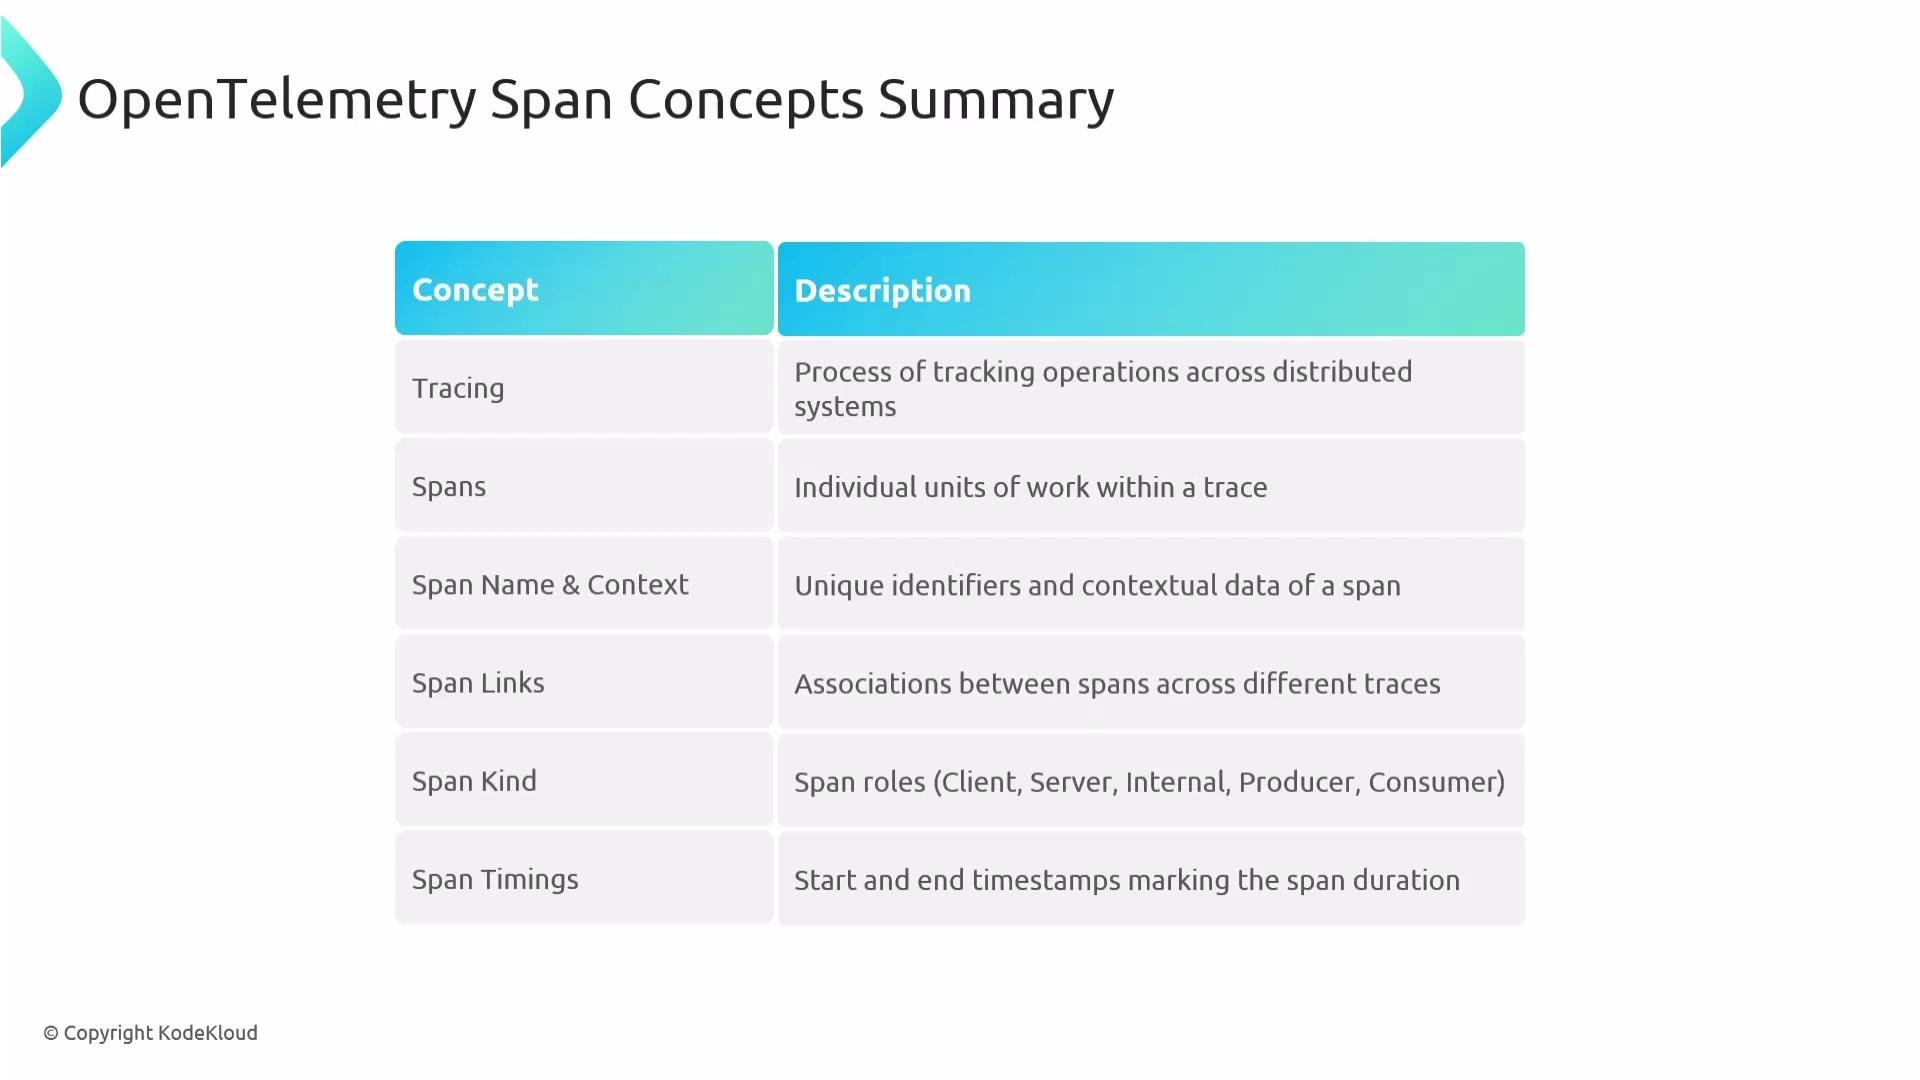
Tracing tracks requests as they flow through a distributed system to capture latency, errors, and contextual metadata across the whole request path. A trace is composed of spans, which represent units of work and their relationships.Span basics
- Span: the smallest unit of work in a trace, representing an operation such as “HTTP GET /orders”, “DB query”, or “ProcessPayment”.
- Trace ID: a unique identifier shared by all spans in a single trace.
- Span ID: a unique identifier for an individual span; used to link spans together.
- Span name: a human-readable label describing the operation, e.g.,
GET /api/ordersorProcessPayment.
Key span concepts
- Context
- Carries trace state (trace ID, current span ID, trace flags, optional trace state) across process boundaries.
- Context propagation is how this state flows from one service to another using propagators (e.g., W3C Trace Context).
- Span links
- Link spans that are not in a parent-child relationship—useful for correlating related work or asynchronous workflows.
- Span timing
- Each span has a start and end timestamp. Duration = end - start. Observability systems use span timings to find slow operations and bottlenecks.
Span data model
- Span attributes
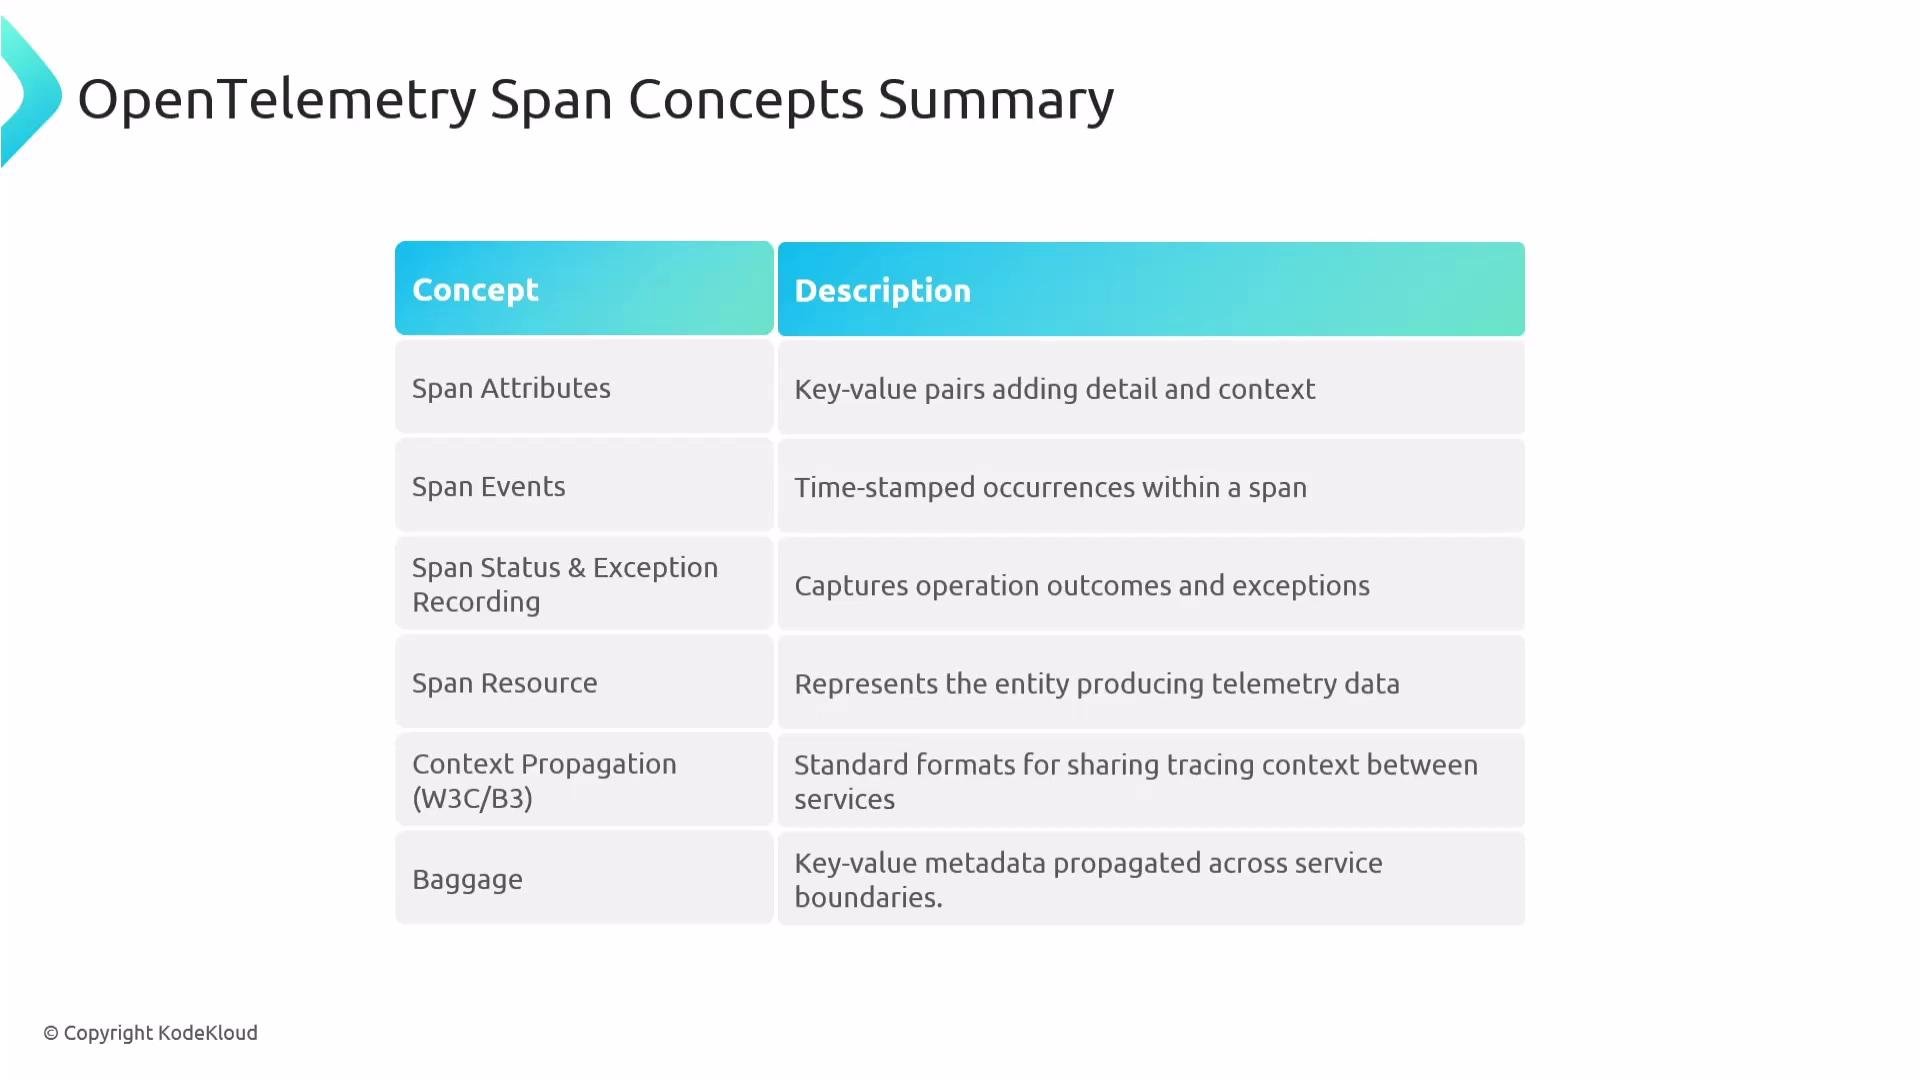
- Key-value pairs attached to a span to add contextual detail (e.g.,
user.id,db.statement,http.method).
- Key-value pairs attached to a span to add contextual detail (e.g.,
- Span events
- Timestamped events recorded within a span (e.g., “DB query executed” at time T). Often used for exceptions and log-like entries; events can include attributes such as stack traces or error messages.
- Exceptions and status
- Exceptions are typically recorded as span events and should also be reflected in span status.
- Common span status values:
UNSET(default),OK,ERROR.
- Span resource
- Resource attributes describe the telemetry-producing entity (service name, host, region, process).
- Resource detectors can auto-populate details (cloud provider, OS, CPU architecture).
- Context propagation
- Propagators carry tracing context across service boundaries (by default OpenTelemetry supports W3C Trace Context and W3C Baggage via text-map carriers).
- Baggage
- Propagated key-value metadata attached to the trace context and sent to every downstream service.
- Keep baggage small and avoid sensitive data.
Keep baggage minimal and never include sensitive or personally identifiable information. Baggage is propagated to every downstream service that receives the trace context.
Span kinds (roles)
Span kinds describe a span’s role in an interaction. They help consumers interpret the trace topology.How spans are used in practice
- Troubleshooting: identify slow spans via duration and stack traces captured in events.
- Error analysis: record exceptions as span events and set span status to
ERROR. - Service mapping: use span kinds and resource attributes to build service-to-service graphs.
- Debugging distributed flows: use span links to correlate asynchronous or multi-trace work.
Instrumentation: how spans and contexts are created
Instrumentation is the process of creating spans and propagating context. There are three common approaches:- Manual instrumentation — explicitly create and manage spans in application code using the SDK.
- Library (SDK) instrumentation — use language or framework libraries with helper APIs to instrument standard operations.
- Auto-instrumentation — zero-code agents that instrument supported libraries automatically; great for rapid coverage.
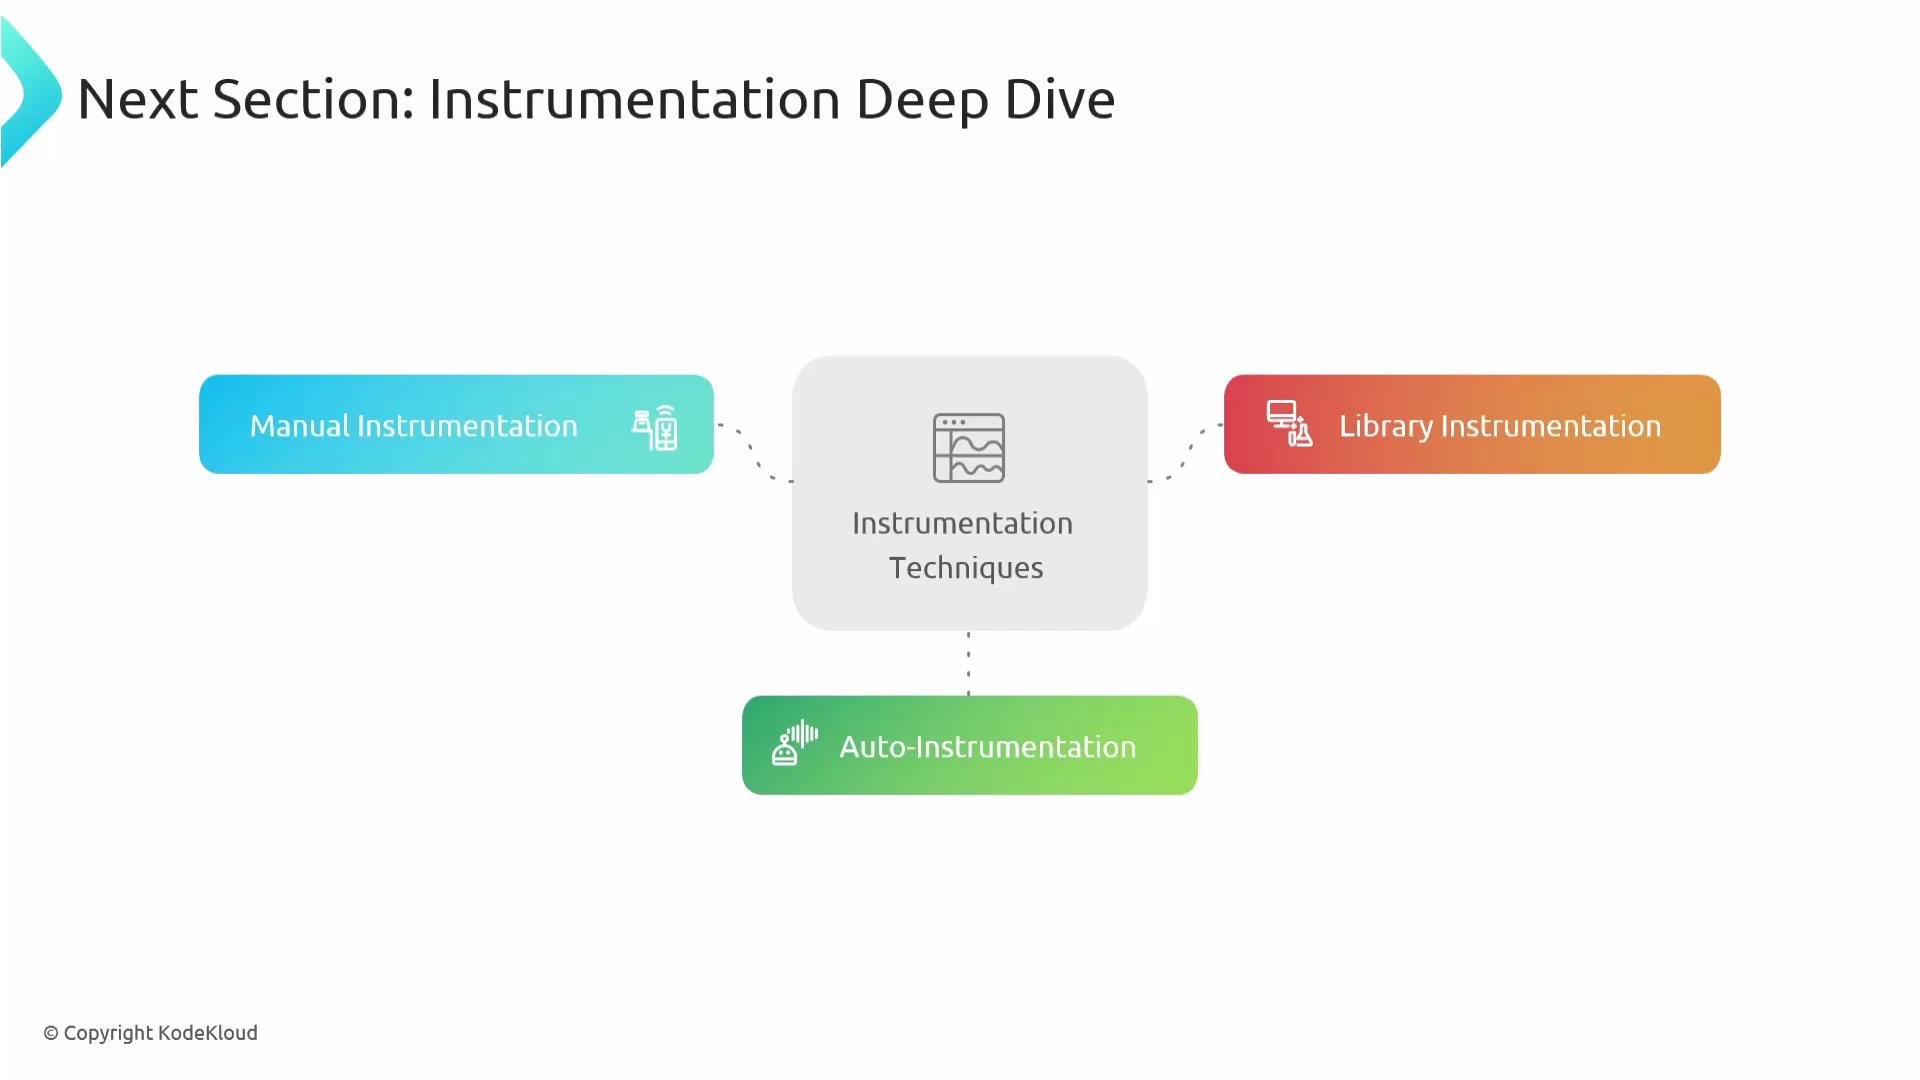
Choosing an instrumentation approach depends on your goals: start with auto-instrumentation for quick coverage, add library instrumentation for framework-specific support, and use manual spans for business-critical or custom operations.
Further reading and references
- OpenTelemetry: https://opentelemetry.io/
- W3C Trace Context: https://www.w3.org/TR/trace-context/
- OpenTelemetry Specification (Tracing): https://github.com/open-telemetry/opentelemetry-specification/tree/main/specification/trace