

- Manual (code-based) instrumentation, and
- Automatic instrumentation using an OpenTelemetry instrumentation library.
Example application (uninstrumented)
A minimal Python app that performs an HTTP request via therequests library:
requests.get(url) makes a network call to a remote service. We want to measure how long that HTTP call takes and capture additional metadata about the request and response.
Manual instrumentation (explicit spans)
You can create spans manually around application code to record timing and metadata. This requires setting up a TracerProvider, span processor, and exporter, and creating spans with the tracer API:The challenge: so many frameworks and libraries
The Python ecosystem (and other ecosystems) contains many frameworks and clients — web frameworks, HTTP clients, ORMs, messaging clients, and more. Instrumenting each call site manually across services quickly becomes unrealistic.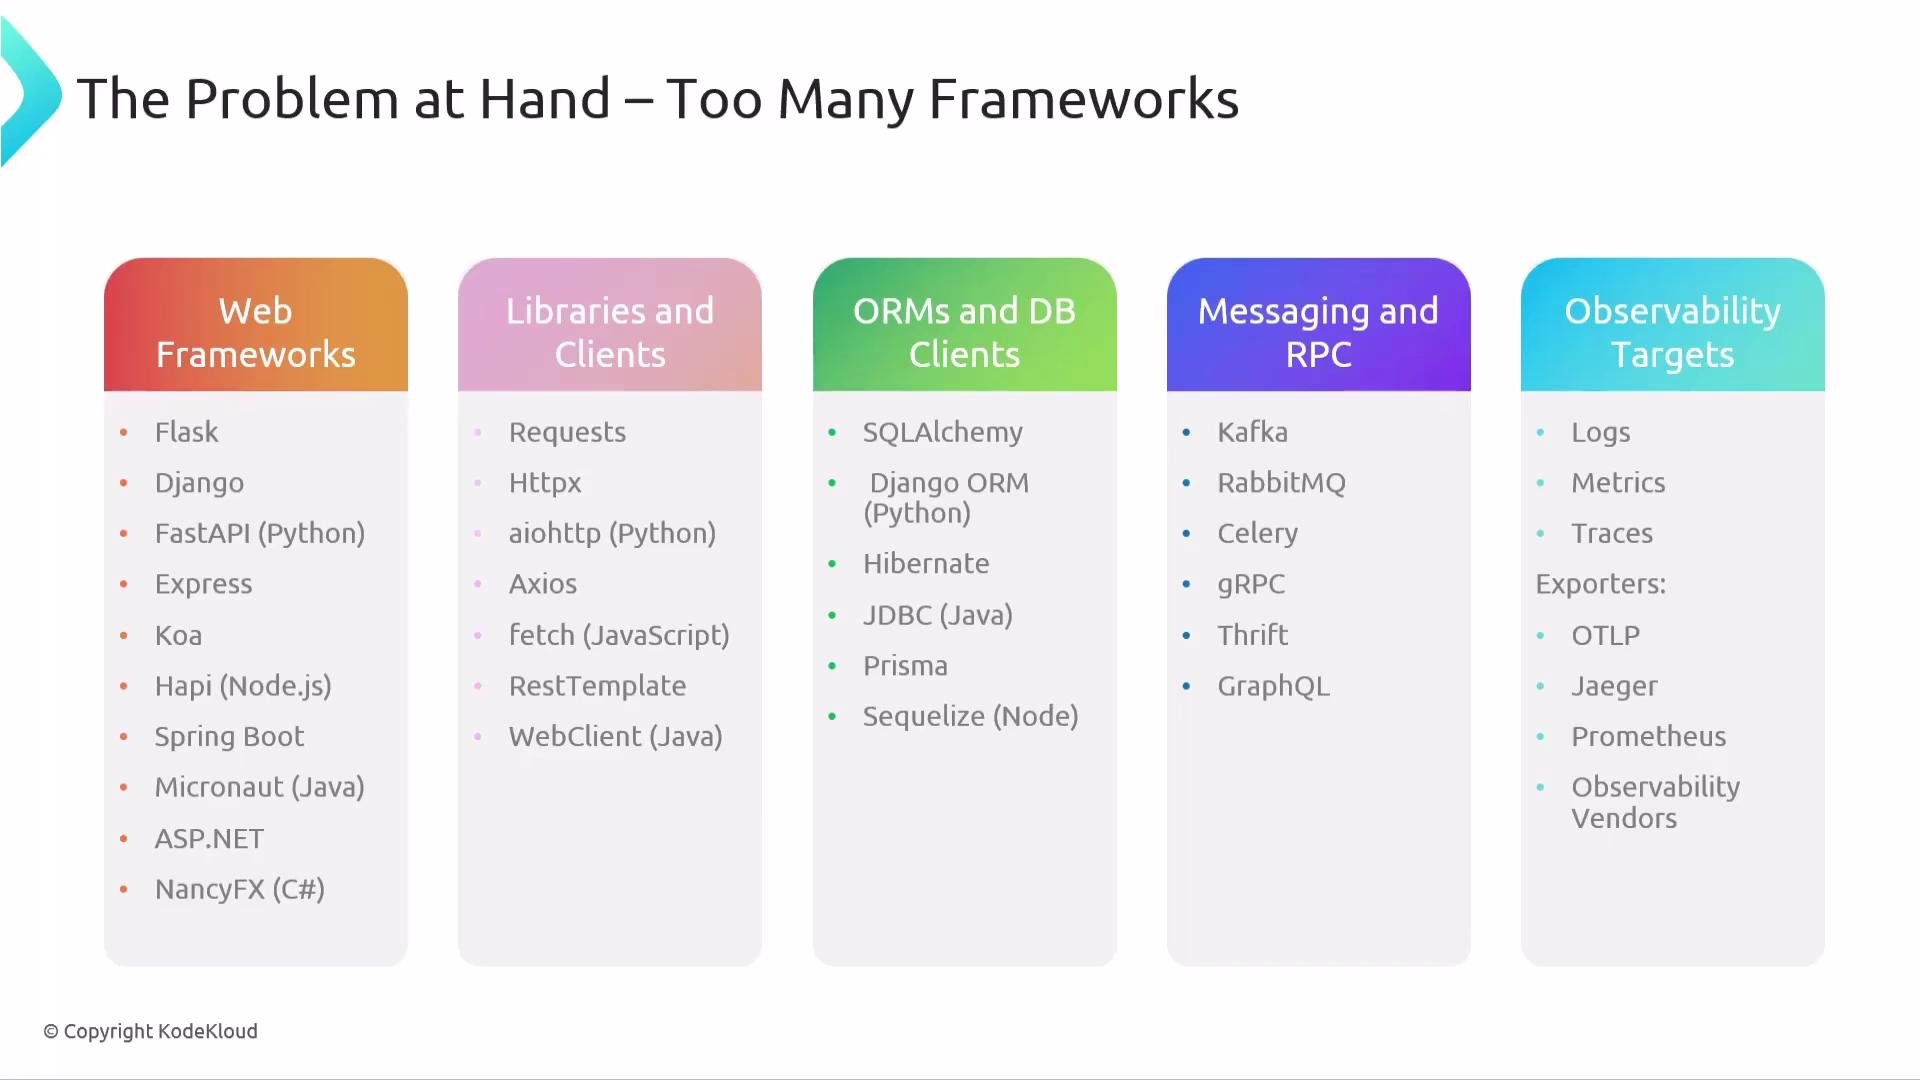
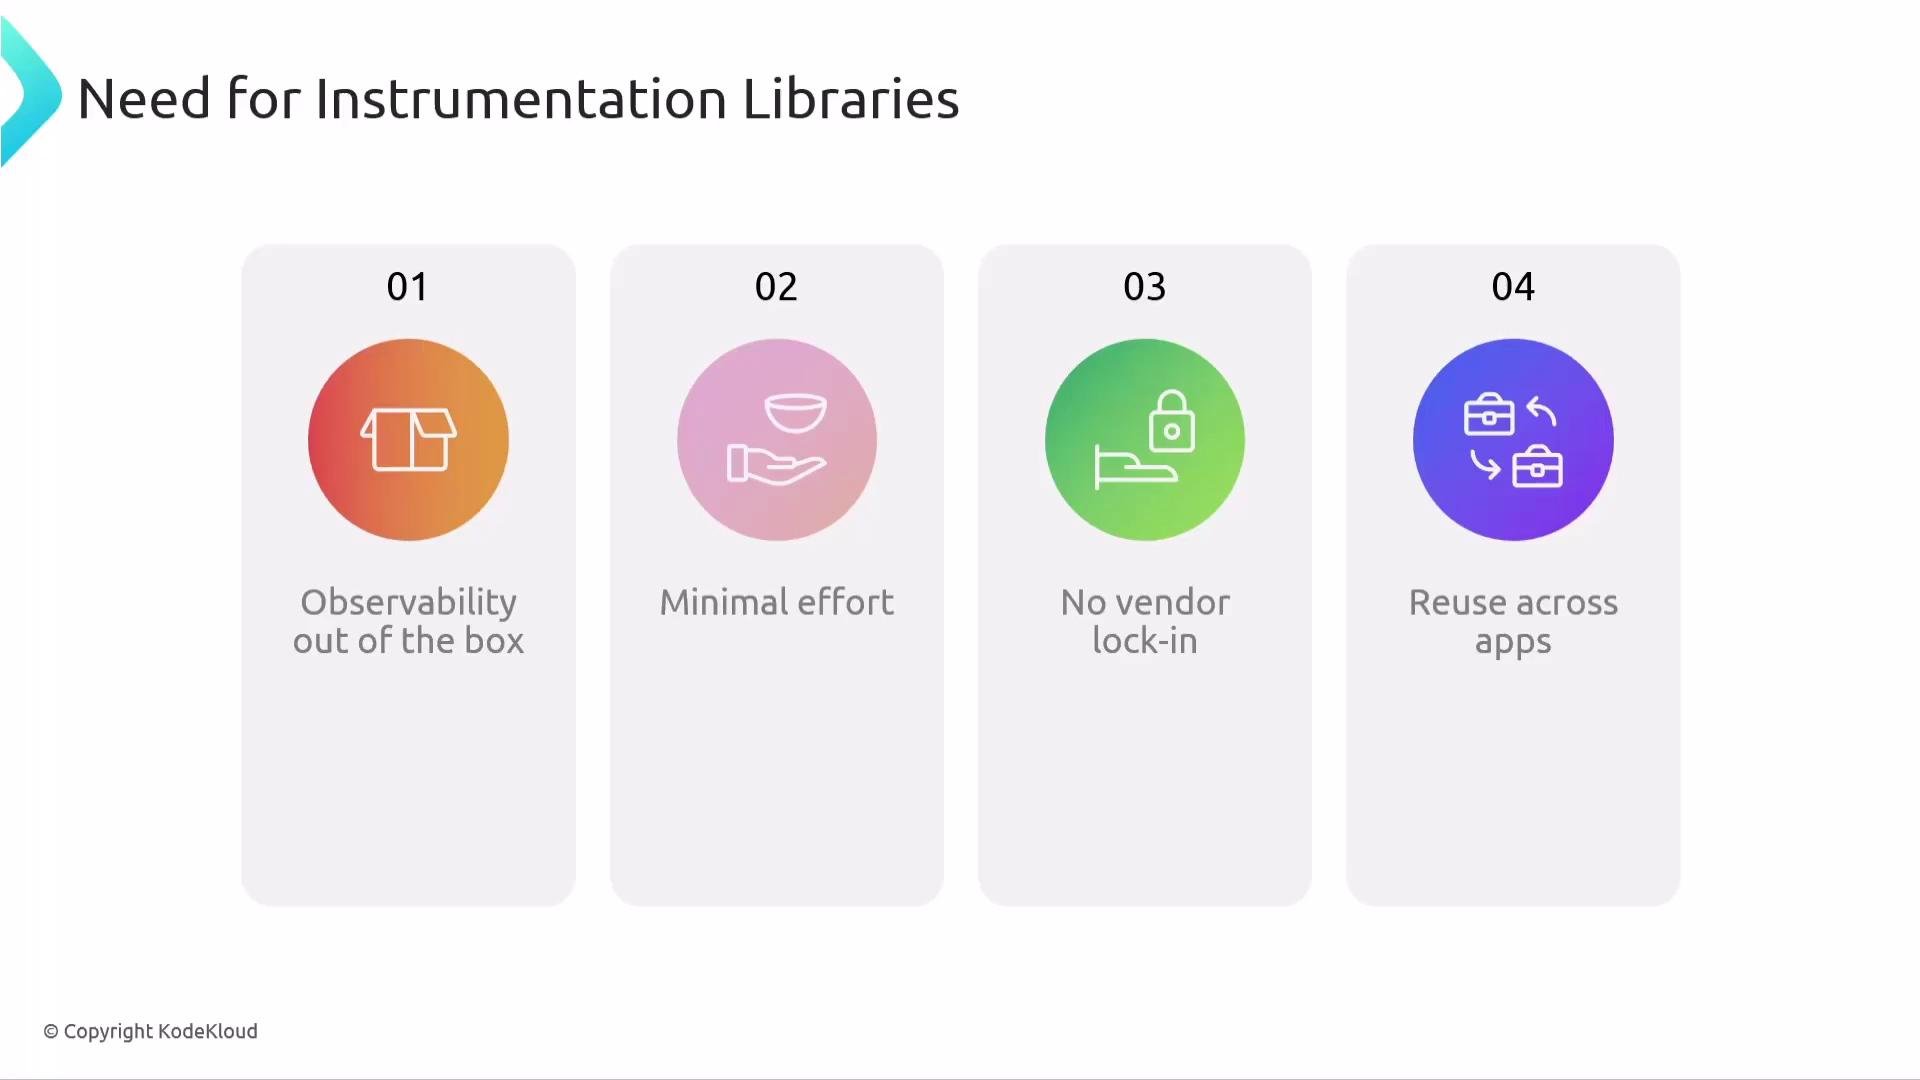
- Observability out of the box for commonly used libraries
- Minimal effort for application developers
- No vendor lock-in
- Reuse across multiple apps and teams
OpenTelemetry Instrumentation Libraries
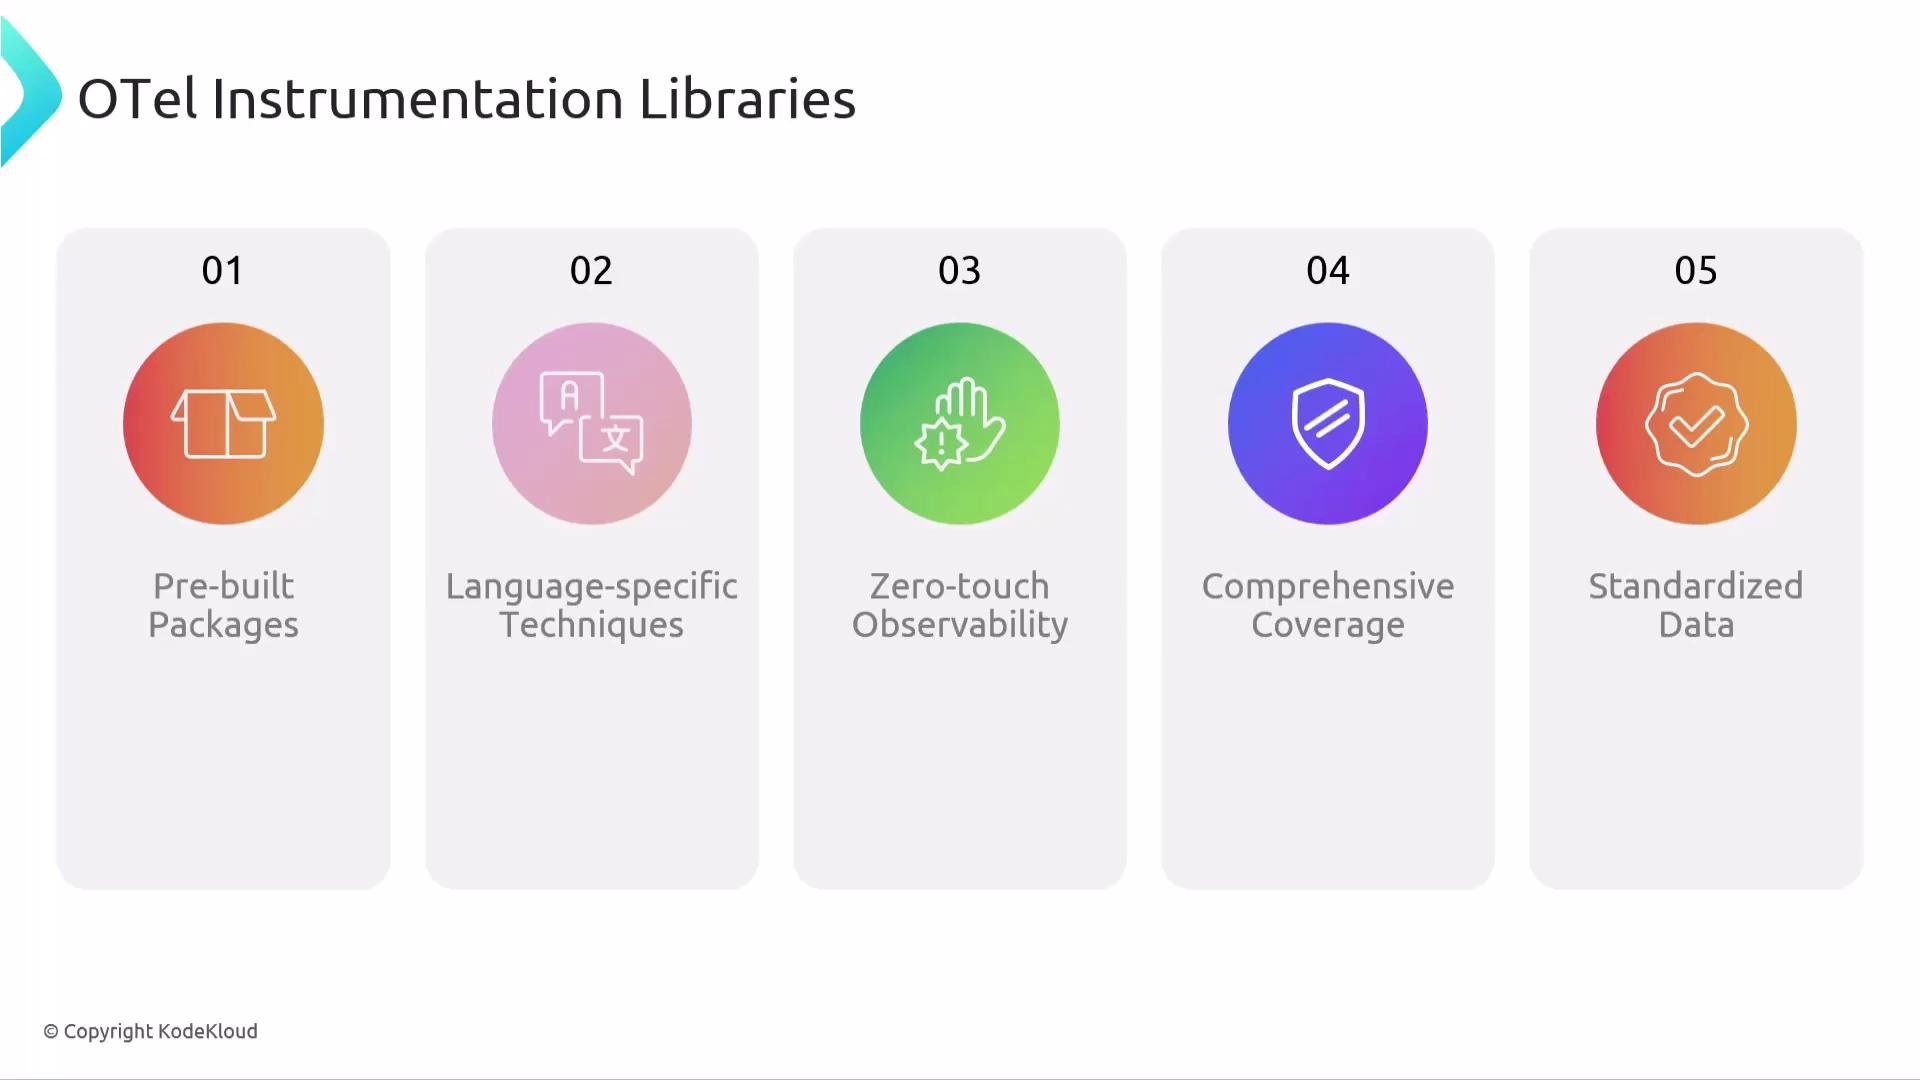
OpenTelemetry instrumentation libraries provide automatic tracing and/or metrics for popular third-party libraries. They are pre-built packages that apply language-specific techniques (in Python this is typically monkey patching) to wrap functions and capture telemetry with minimal or zero changes to your application code. Common targets:- HTTP clients:
requests,httpx,aiohttp - Web frameworks:
Flask,Django,FastAPI - ORMs and DB drivers:
SQLAlchemy, database-specific drivers - Messaging and RPC:
kafka-python,pika,celery - Cloud SDKs:
boto3, etc.
opentelemetry-instrumentation-<library-name>
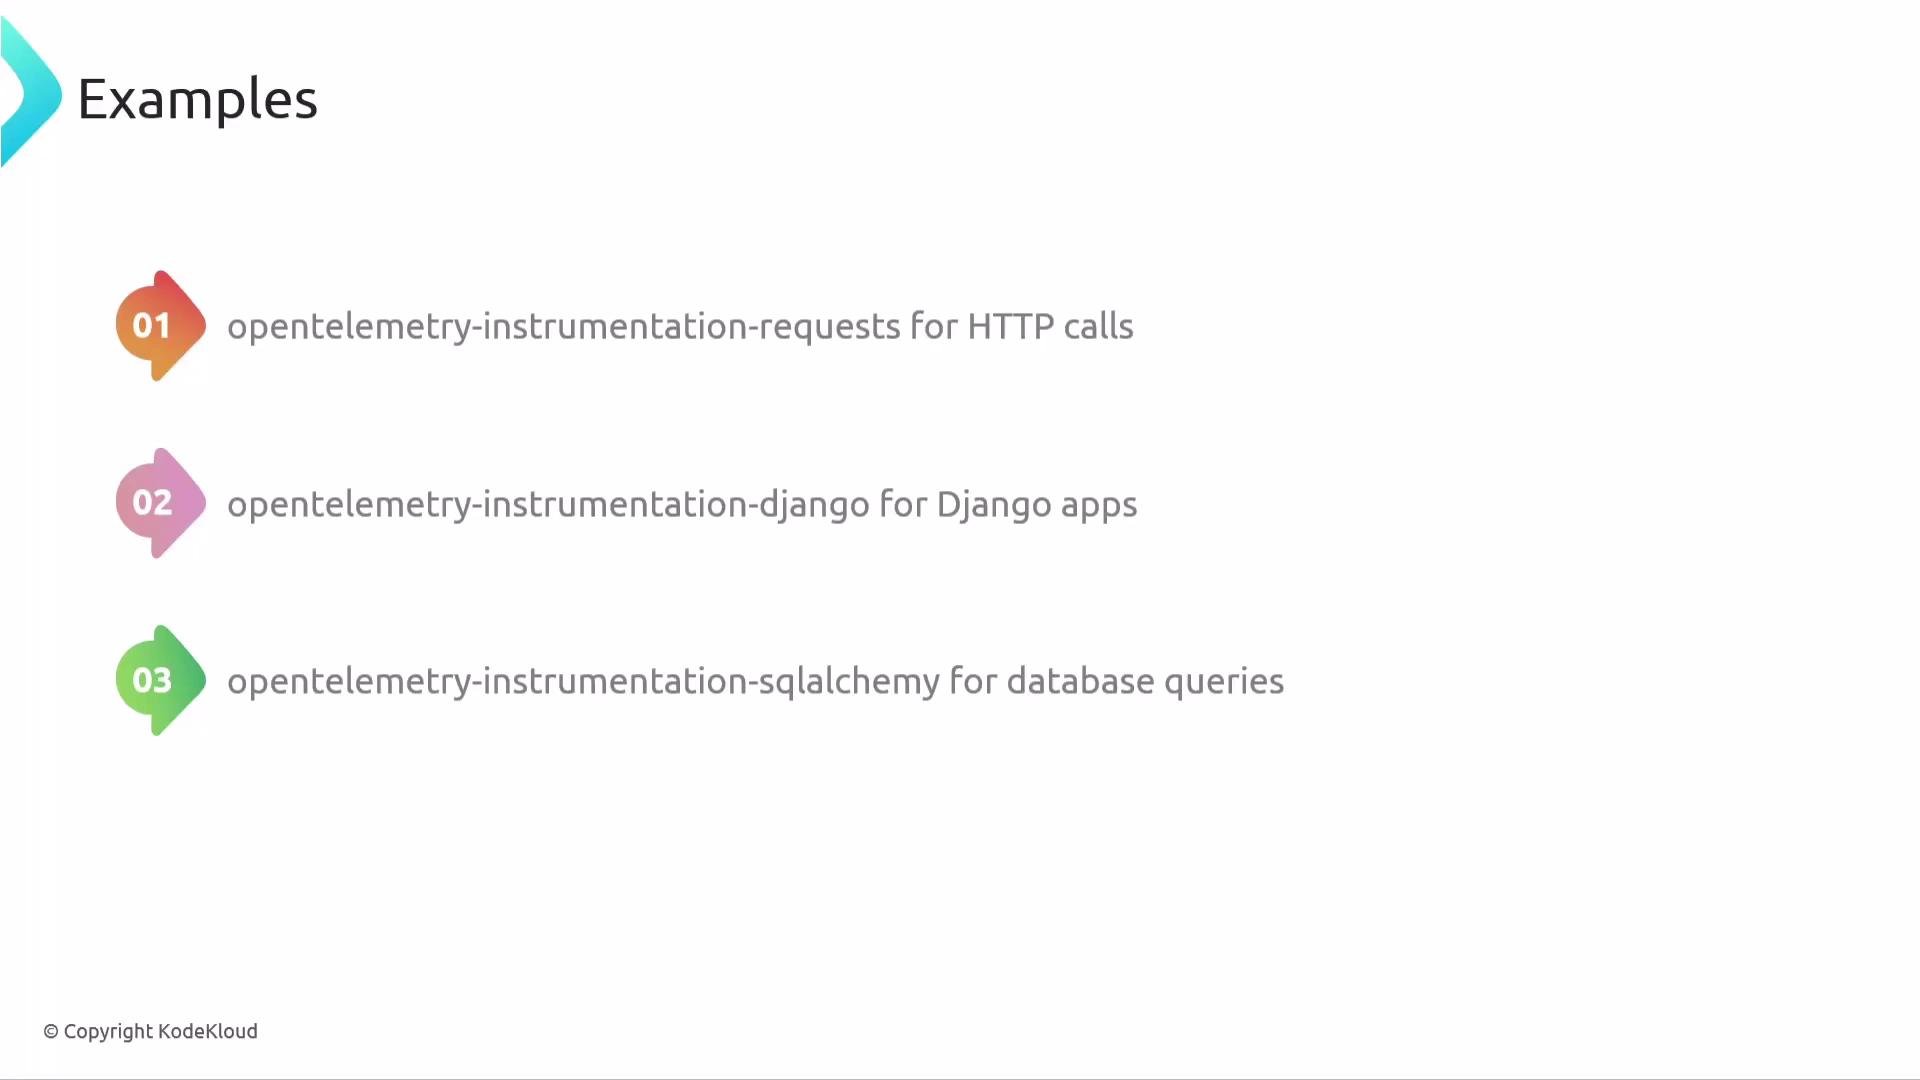
Auto-instrumenting the example using RequestsInstrumentor
Instead of adding spans manually around each HTTP call, enable therequests instrumentation package. Instrumentation libraries themselves use only the OpenTelemetry API — your application still configures the SDK and exporters.
http.method, http.url, http.status_code). A console-exported span for an instrumented HTTP GET might look like:
How the instrumentation library works (high level)
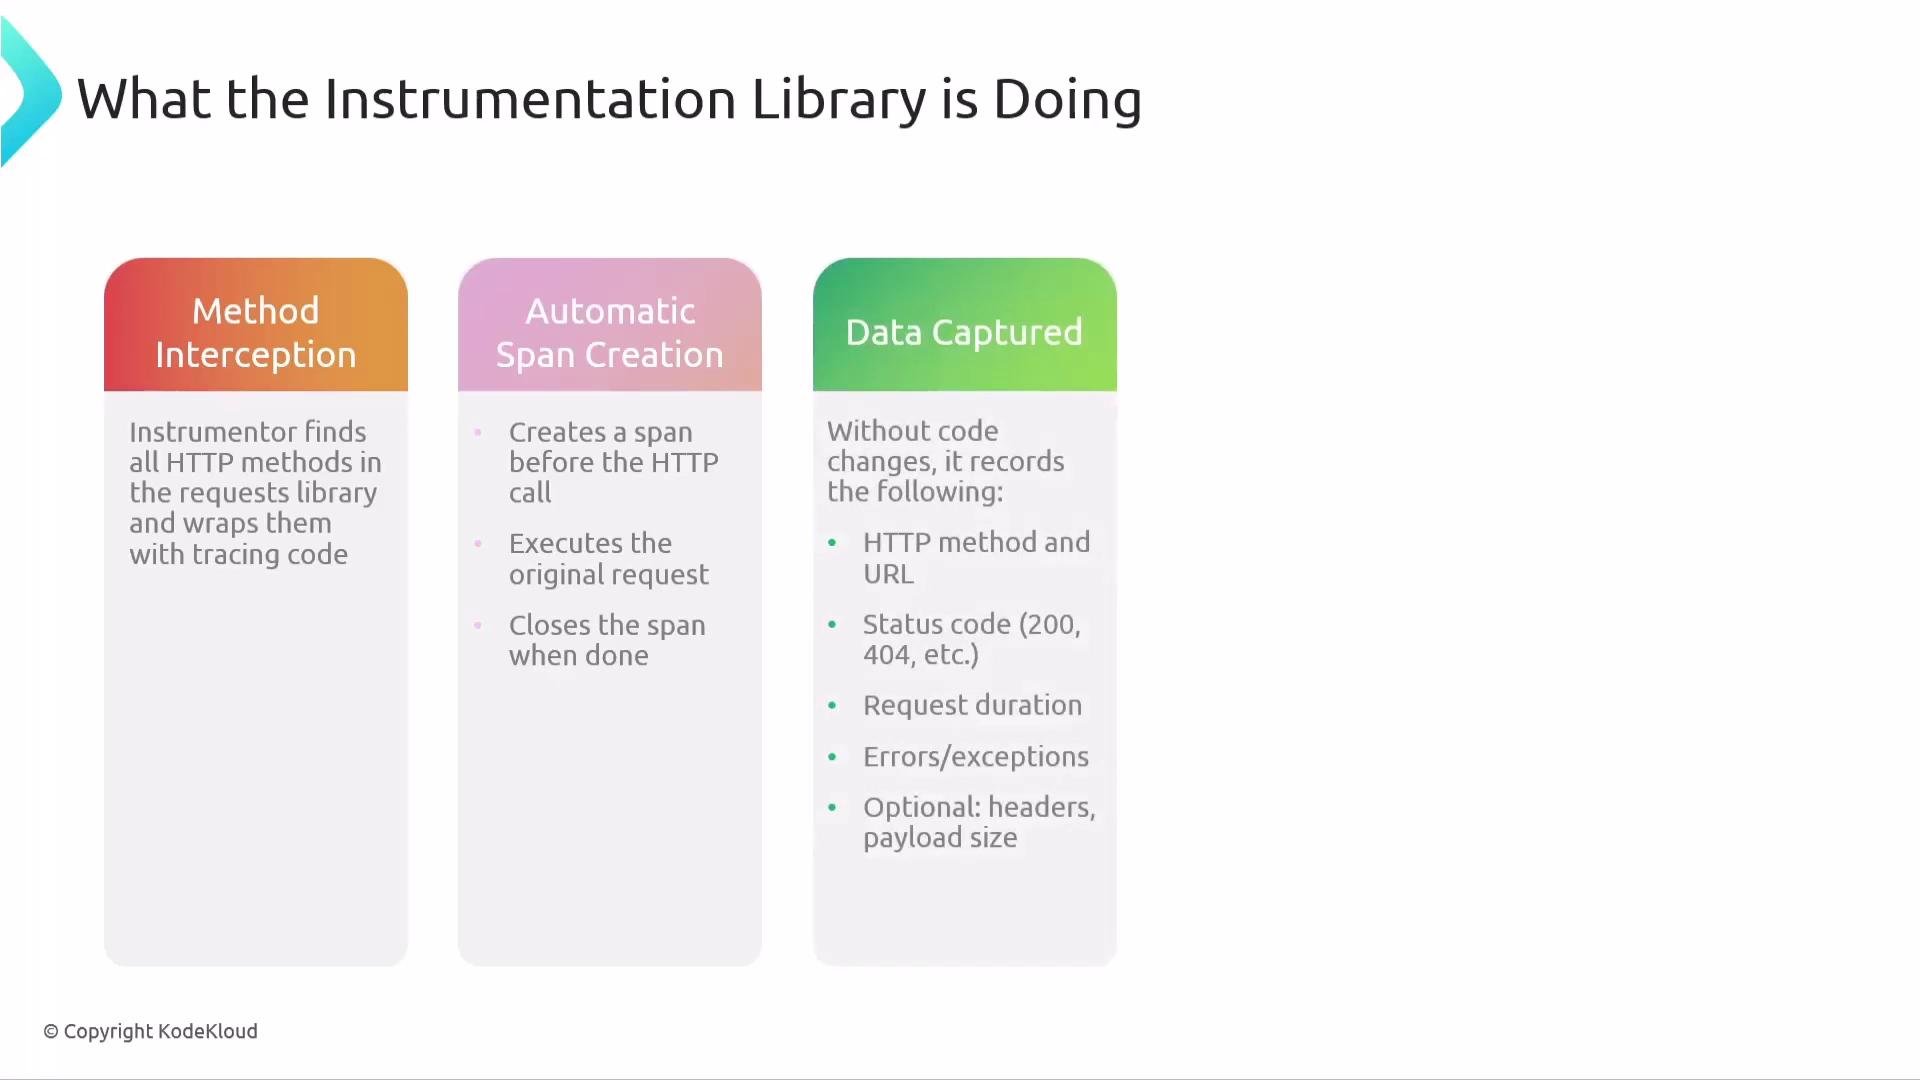
When you callRequestsInstrumentor().instrument(), the instrumentor finds and wraps the relevant methods in the requests package (for example, get, post, put, delete) and replaces them with instrumented wrappers. This is usually implemented via monkey patching. Each instrumented call typically:
- Creates a client span using the OpenTelemetry API,
- Executes the original
requestscall, and - Ends the span and attaches semantic attributes based on the response.
Simplified illustration of monkey patching (conceptual)
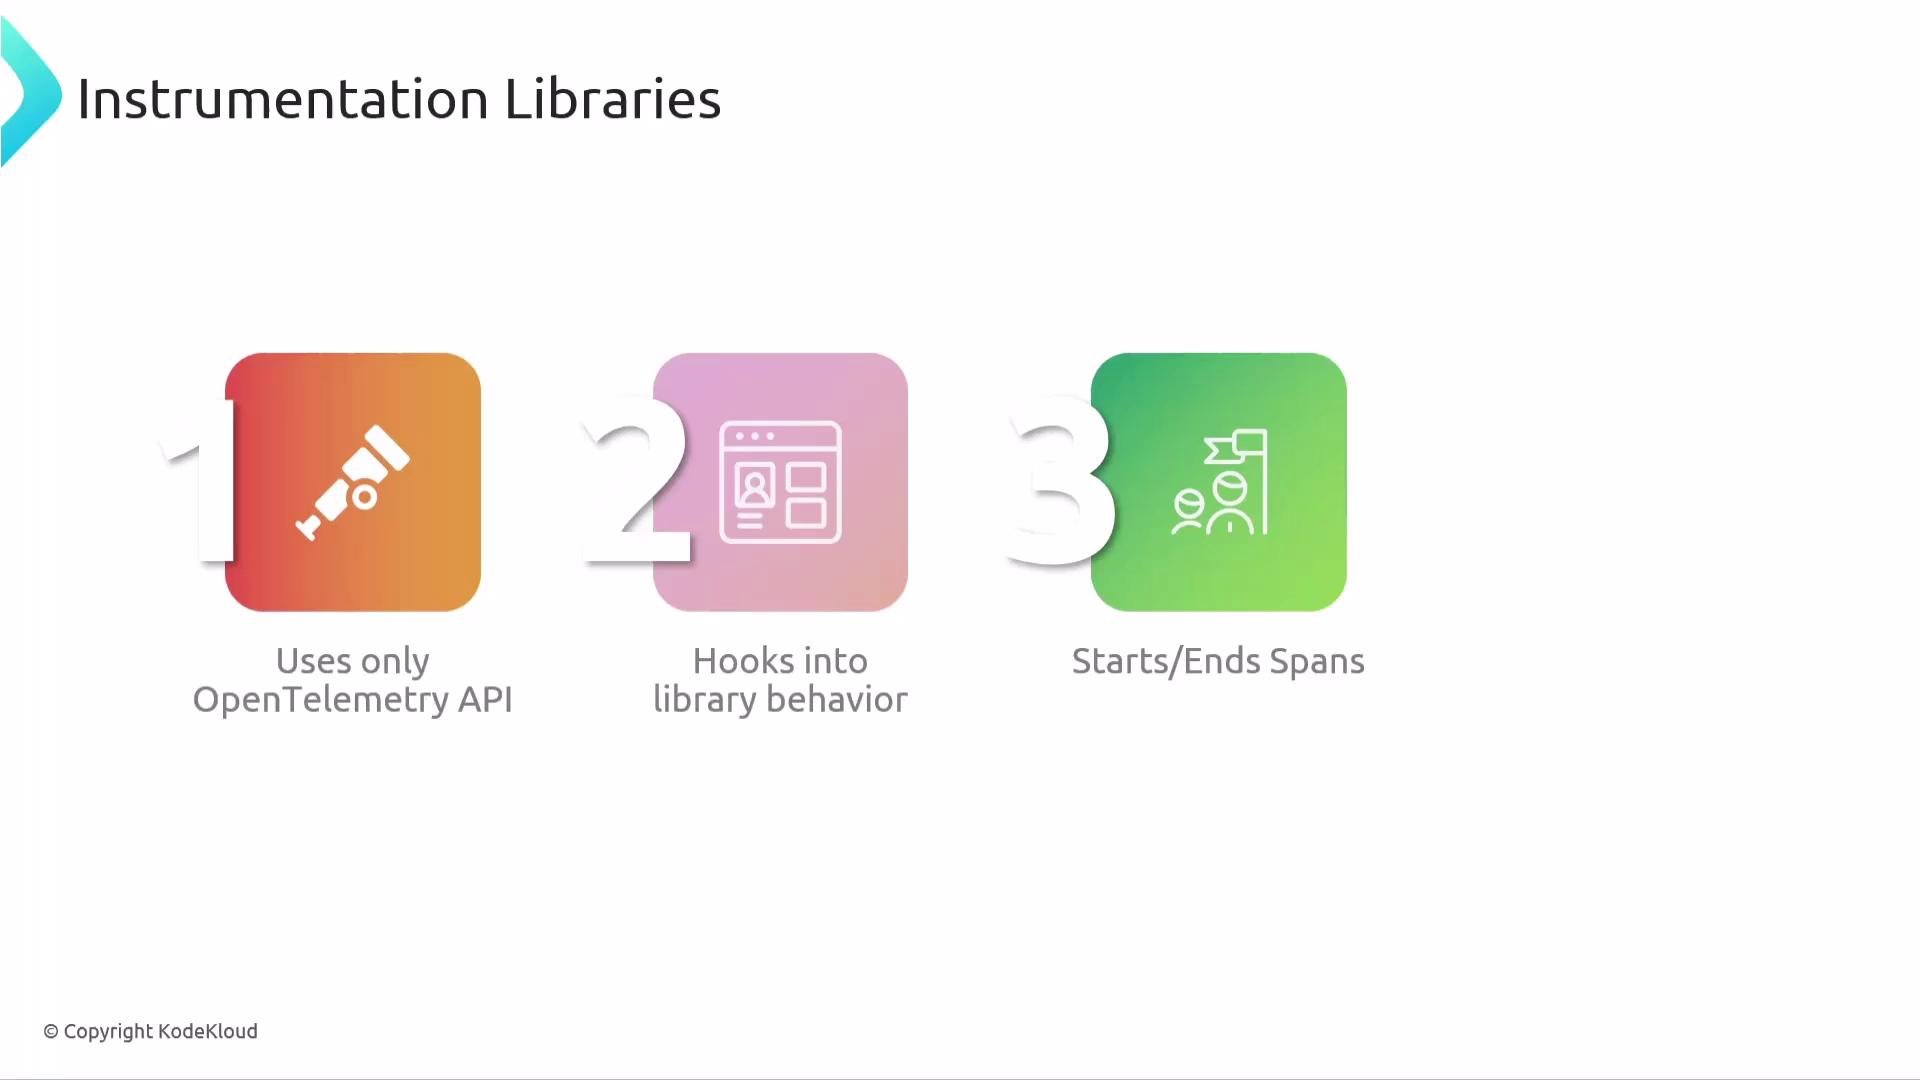
Instrumentation libraries only use the OpenTelemetry API
Instrumentation packages should depend only on the OpenTelemetry API, not on any particular SDK implementation. The application sets up the SDK (TracerProvider, processors, exporters) to record and export telemetry. This separation ensures:- SDK-agnostic instrumentations,
- App developers can choose exporters and processors,
- Reusable, composable instrumentations across organizations.
When to use instrumentation libraries
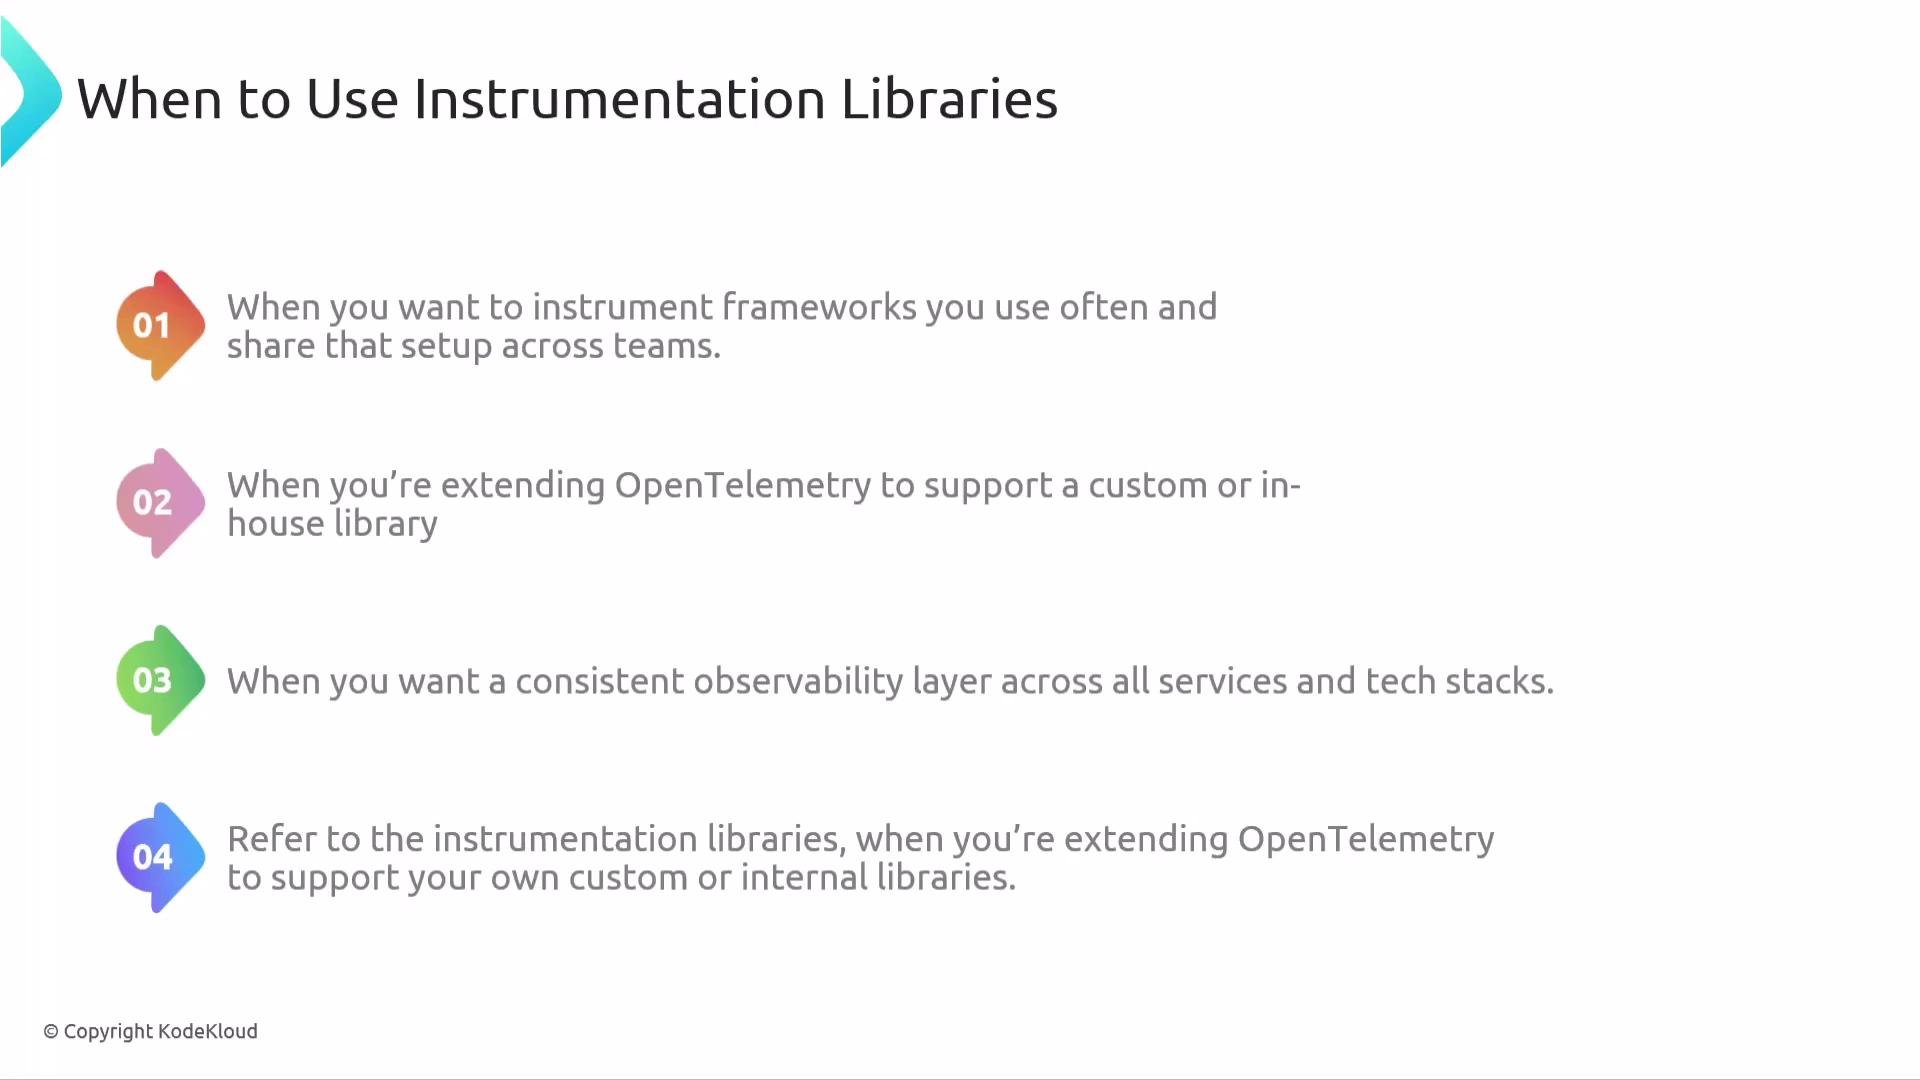
Instrumentation libraries are appropriate when:- You want automatic observability without modifying application source code.
- You need consistent semantic data across services (instrumentations follow OpenTelemetry semantic conventions).
- You want to share observability setup across teams and projects.
- You want to extend OpenTelemetry support for in-house libraries by authoring custom instrumentations.
What instrumentation libraries include — and what they don’t
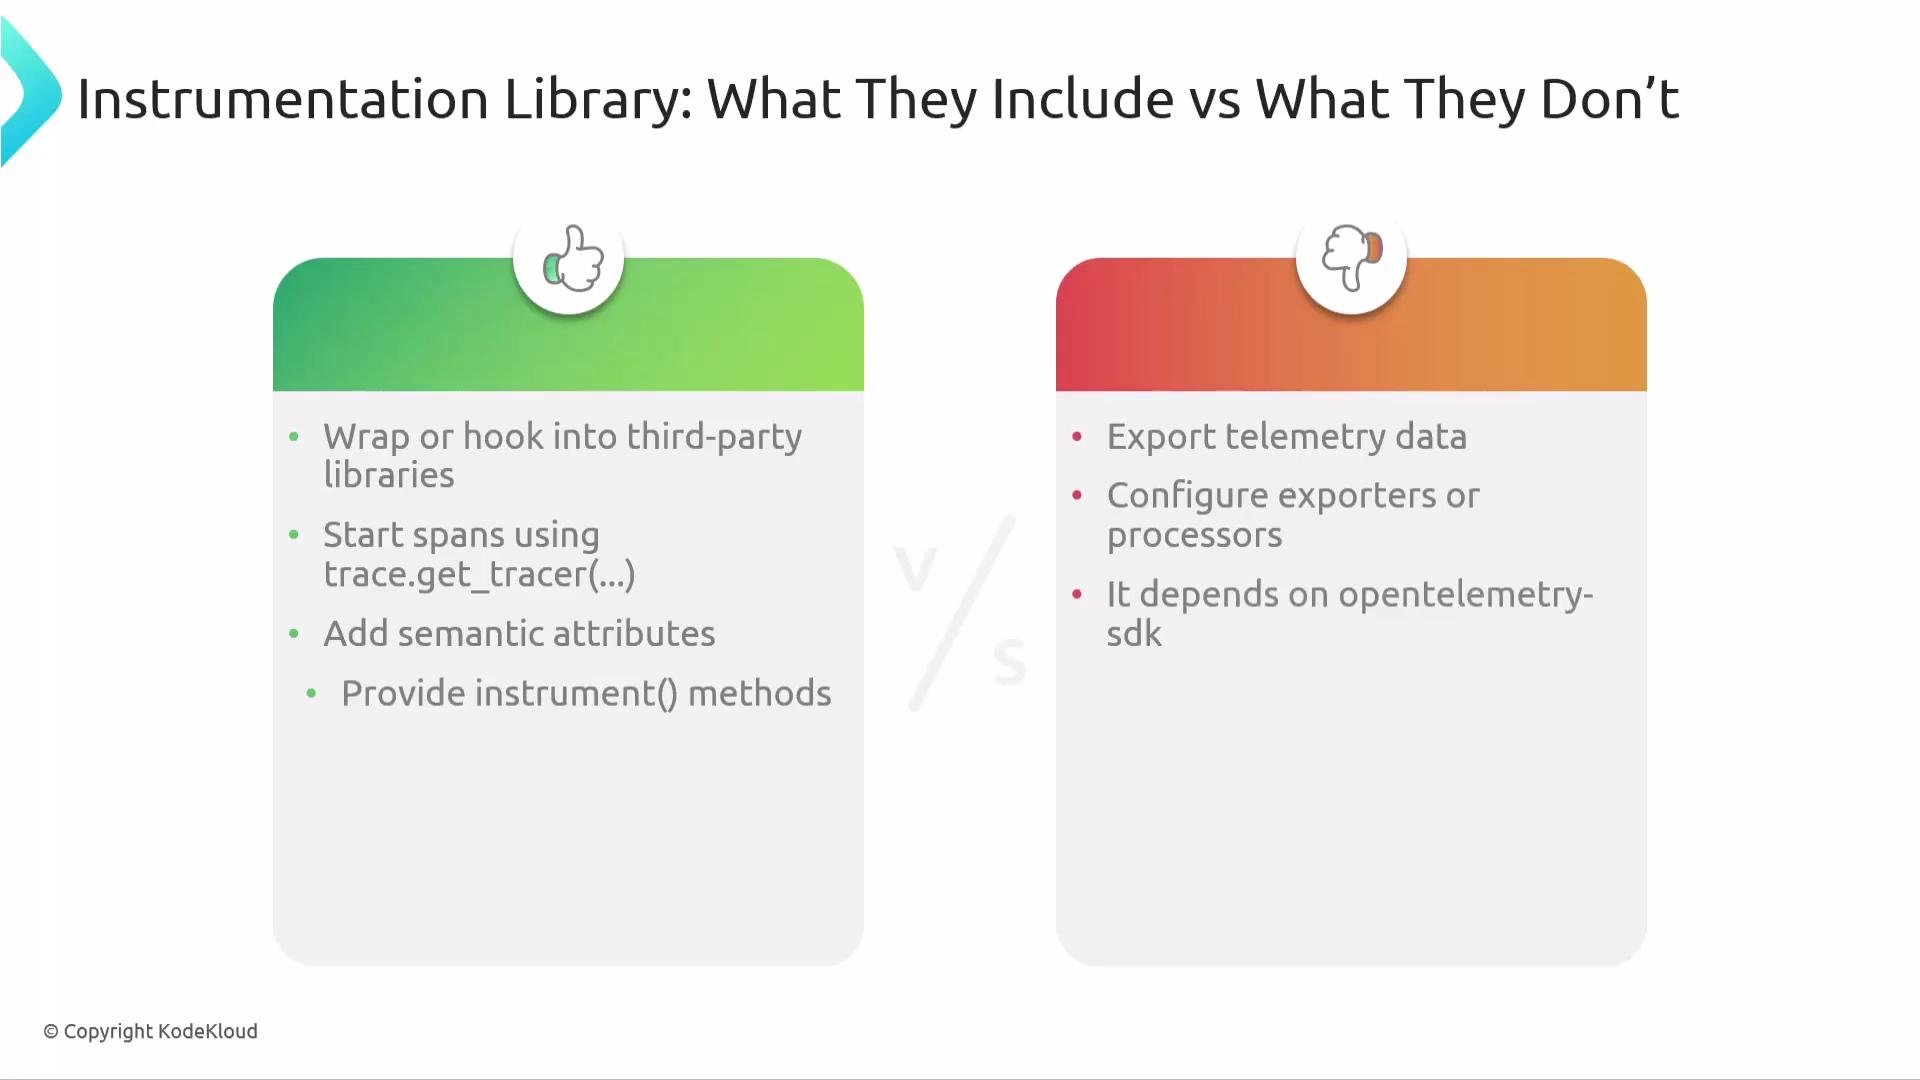
- They hook into third-party libraries and start spans or collect metrics where appropriate.
- They populate semantic attributes automatically.
- They provide instrumented methods so your source code remains unchanged.
- They do not configure or export telemetry; the application must set up the SDK, span processors, and exporters.
- They should not depend on a particular SDK implementation.
Design goals when authoring instrumentation libraries
If you author an instrumentation library, follow these design goals:- Be SDK-agnostic — use only the OpenTelemetry API.
- Allow application developers to configure SDKs and exporters.
- Be composable and pluggable across projects.
- Follow OpenTelemetry semantic conventions for attribute naming and events.
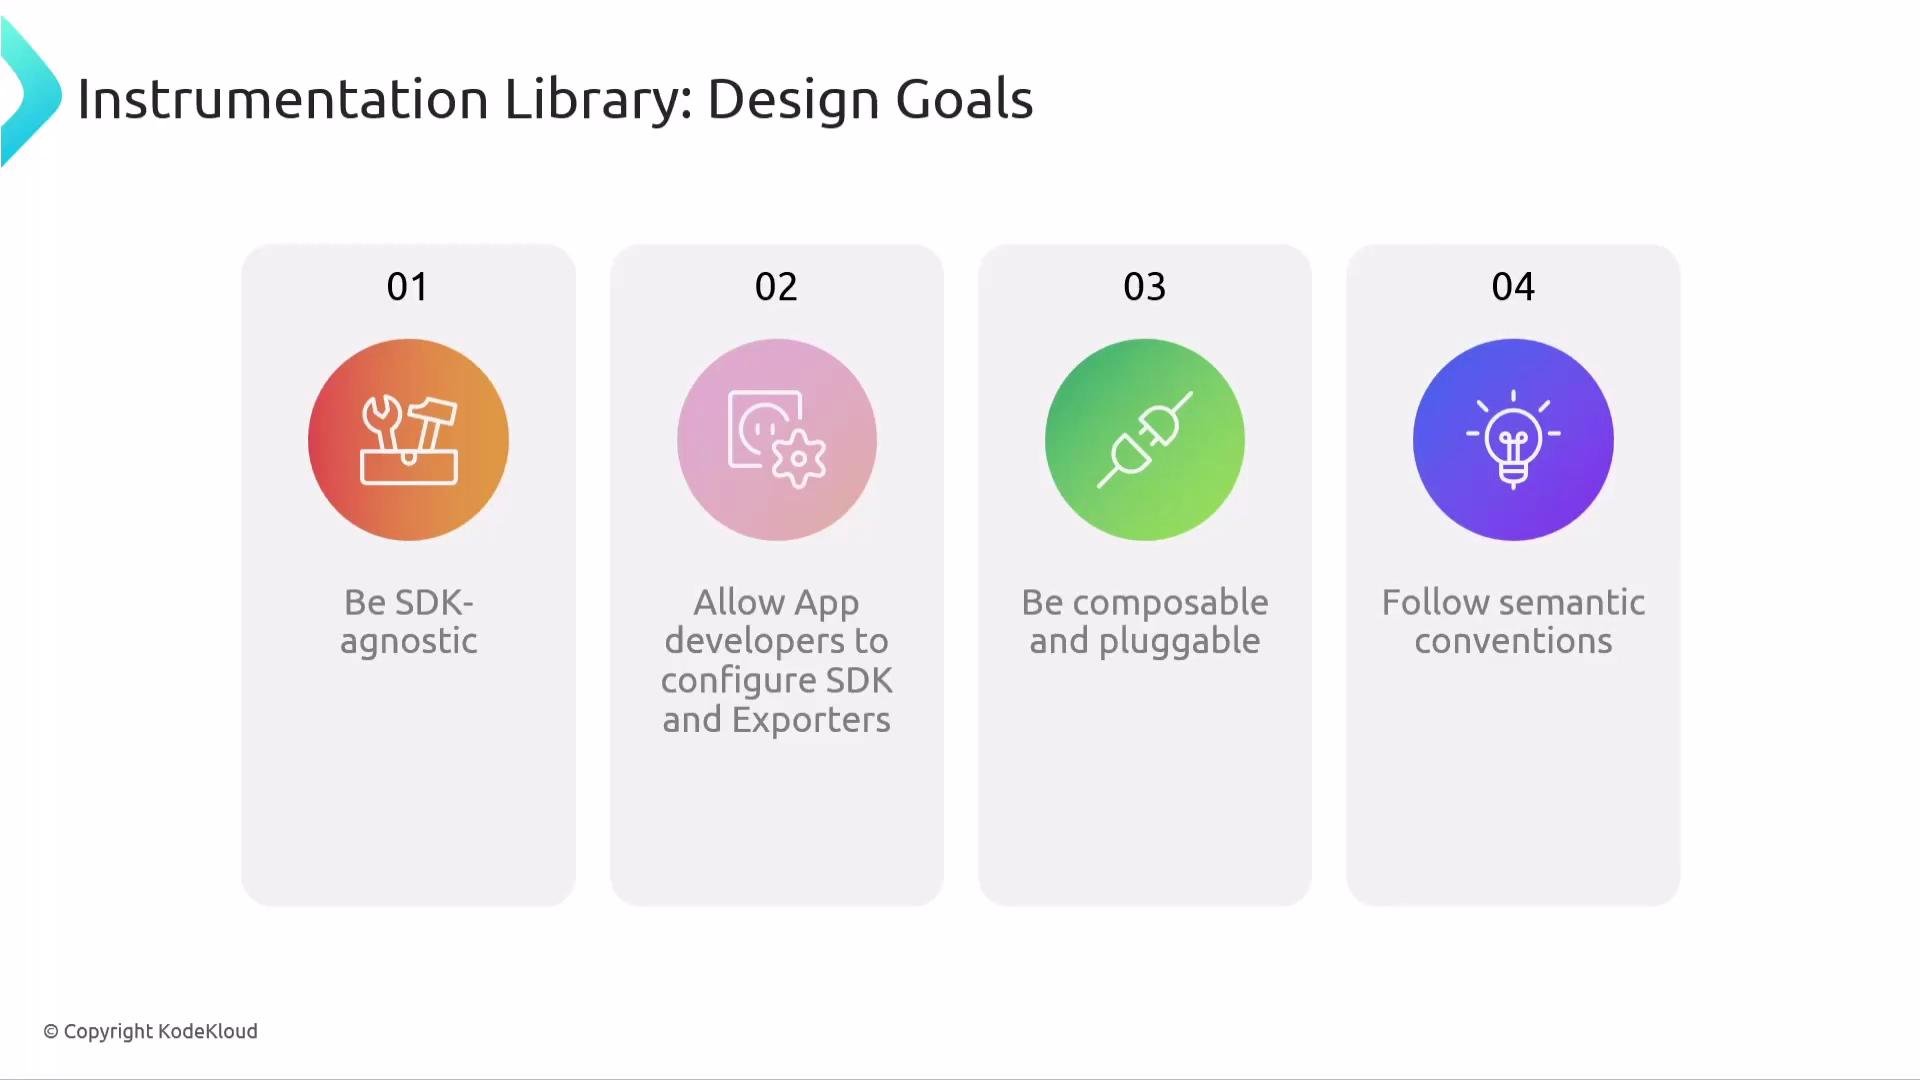
When writing an instrumentation, rely only on the OpenTelemetry API (not the SDK). Let applications decide which SDK, processors, and exporters to use.
Summary — responsibilities: instrumentation libraries vs applications
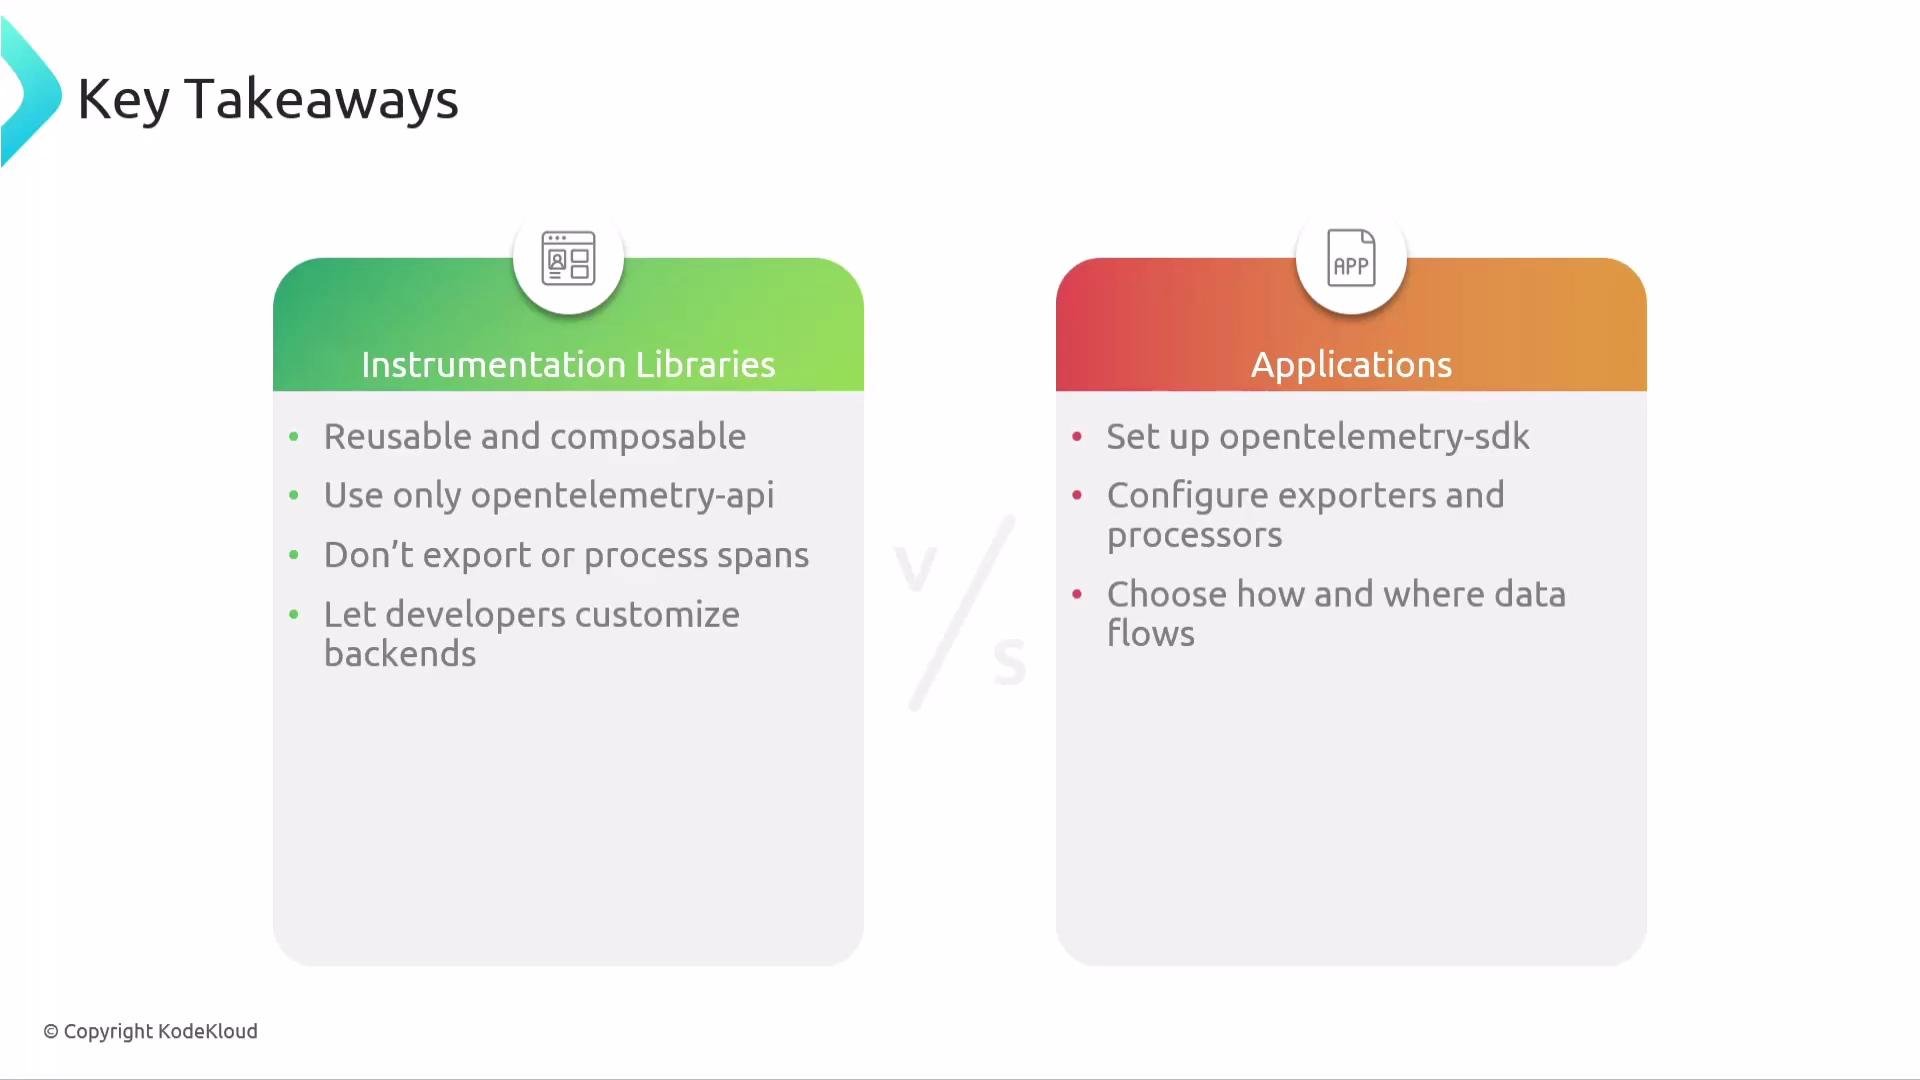
- Instrumentation libraries: decide what to collect (spans/metrics), how to name/annotate them, and how to hook into library behavior. They should be reusable and depend only on the OpenTelemetry API.
- Applications: decide how to process and export telemetry. Applications configure SDKs, span processors, and exporters to send data to chosen observability backends.
- OpenTelemetry Documentation: https://opentelemetry.io/docs/
- Python instrumentation packages: search PyPI for
opentelemetry-instrumentation-<library-name>