You’ve already learned core metrics concepts — temporality, monotonicity, aggregation, and more. In this article we convert theory into practice: how to define, create, and record metrics in your application using the Metrics API and its SDK implementation. The Metrics API defines stable interfaces used by libraries and applications to create and record metrics. The SDK implements those interfaces, performing collection, aggregation, and exporting to observability backends. At a high level the Metrics API comprises three core components:
  • MeterProvider — the entry point and factory for Meters.
  • Meter — a factory that creates instruments for a specific instrumentation scope (a library or component).
  • Instrument — the metric primitives (counters, histograms, gauges, etc.) used to record measurements.
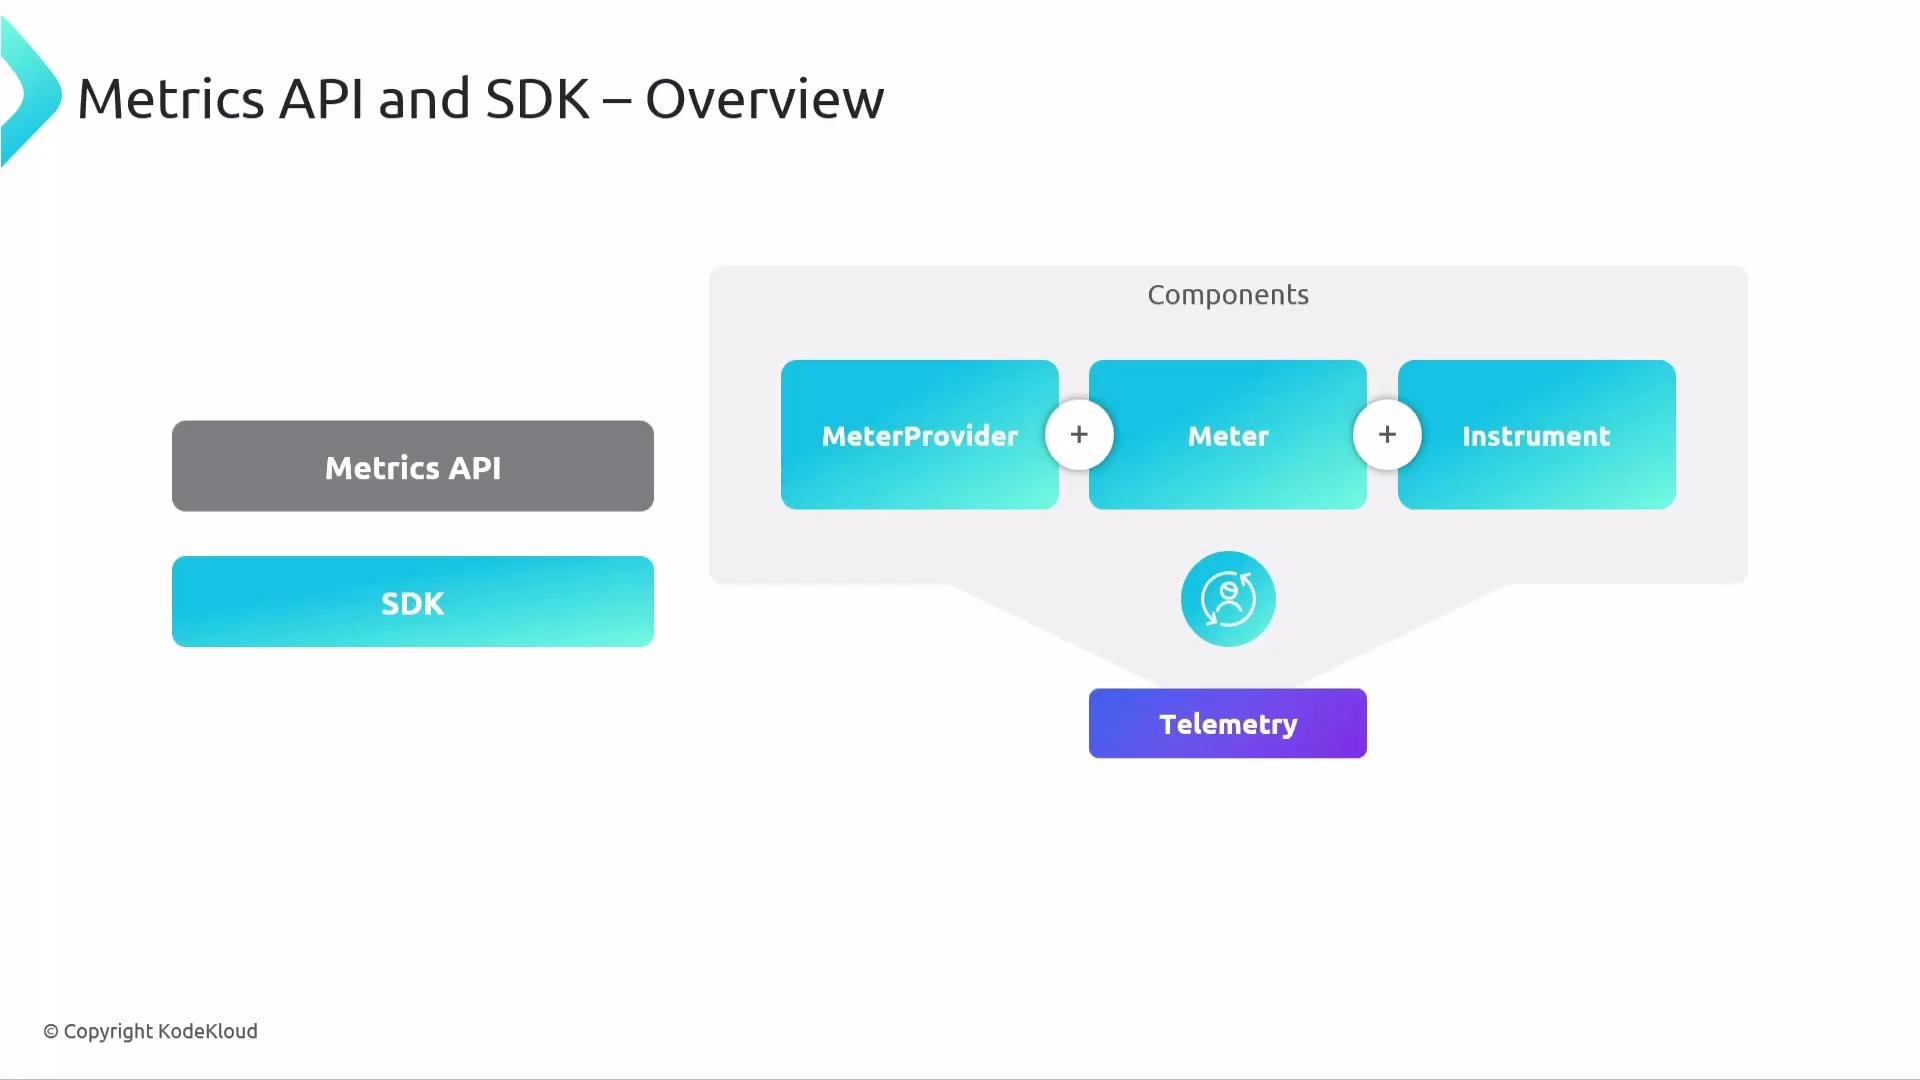
The SDK wires these abstractions together so measurements are aggregated and exported to your telemetry backend.
The image provides an overview of "Metrics API and SDK," highlighting their components: MeterProvider, Meter, Instrument, and Telemetry.
This separation between API and SDK mirrors the tracing model: it keeps a stable public API for instrumentation while allowing multiple SDK implementations and flexible configuration.

Core components: MeterProvider, Meter, Instrument

Think of the MeterProvider as the top-level factory and configuration point; it produces Meters for each instrumentation scope. Each Meter then creates and owns Instruments that your code uses to record telemetry.
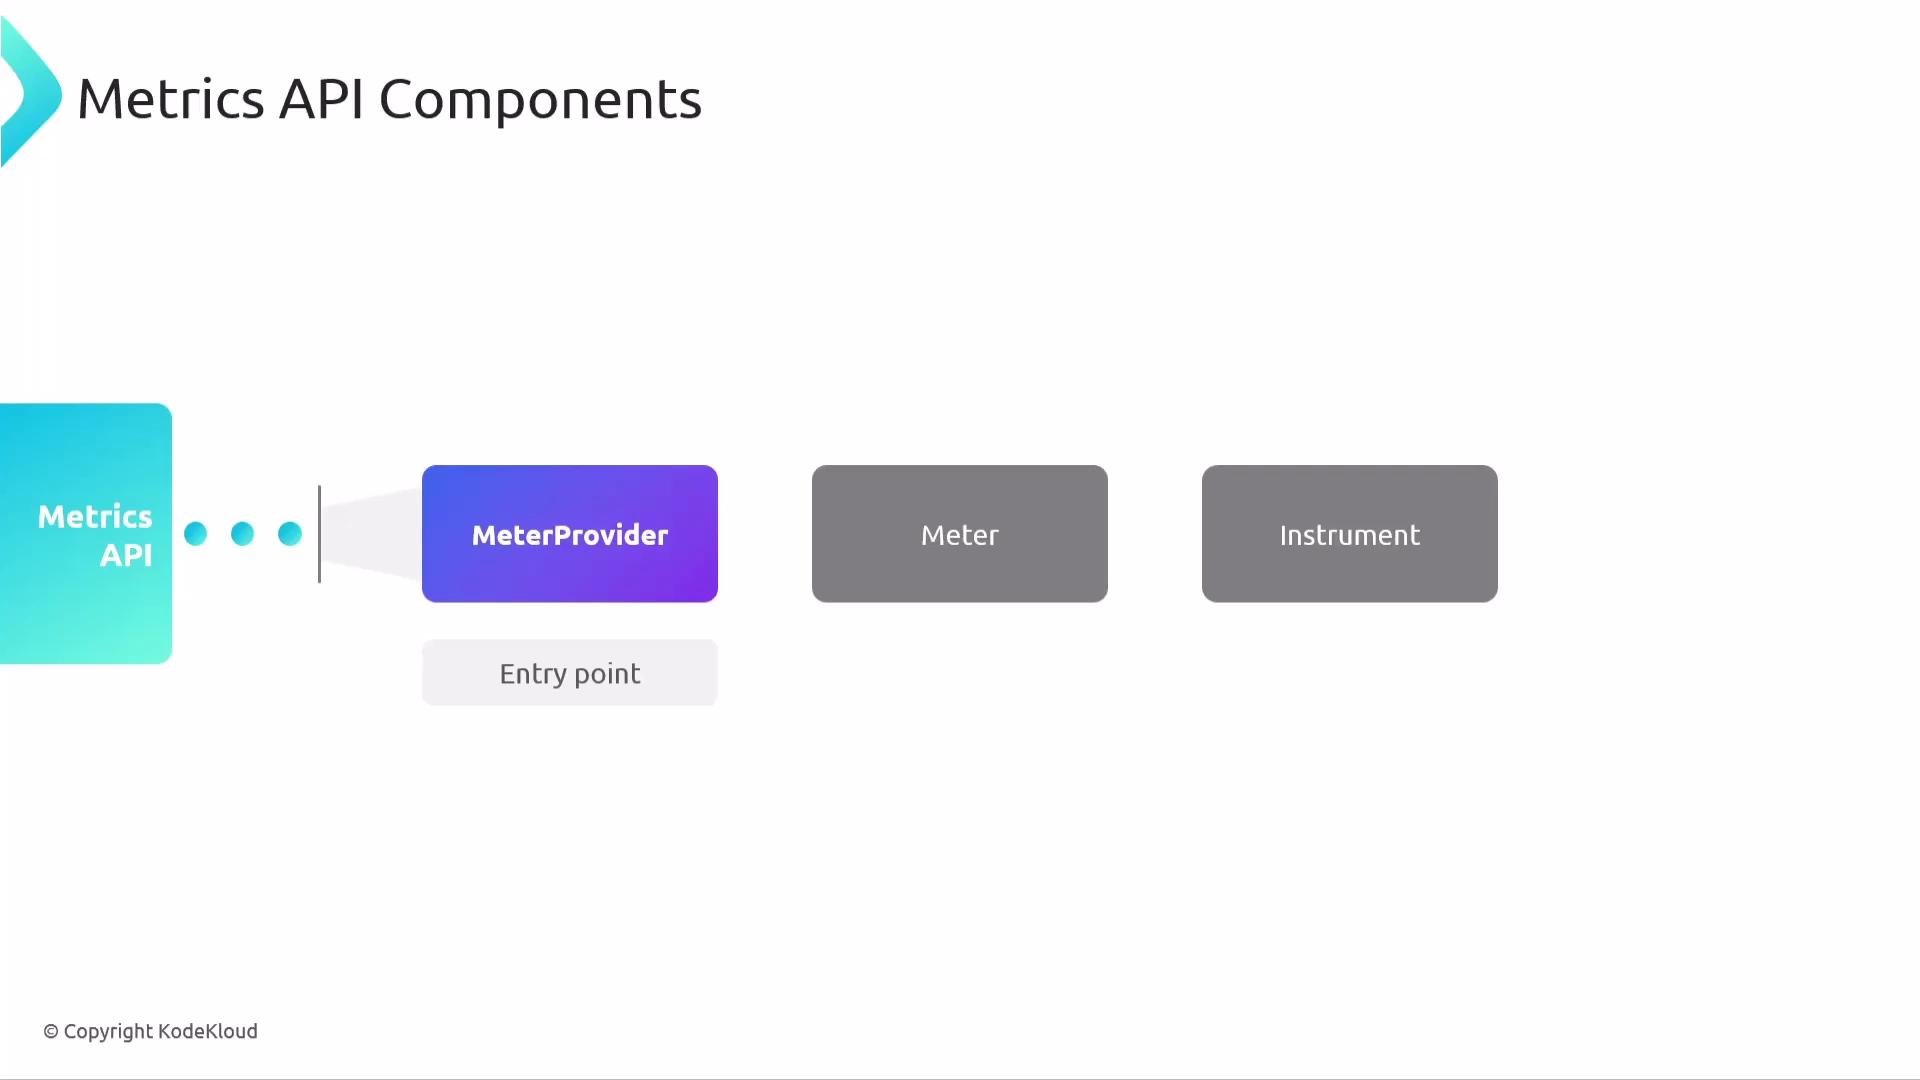
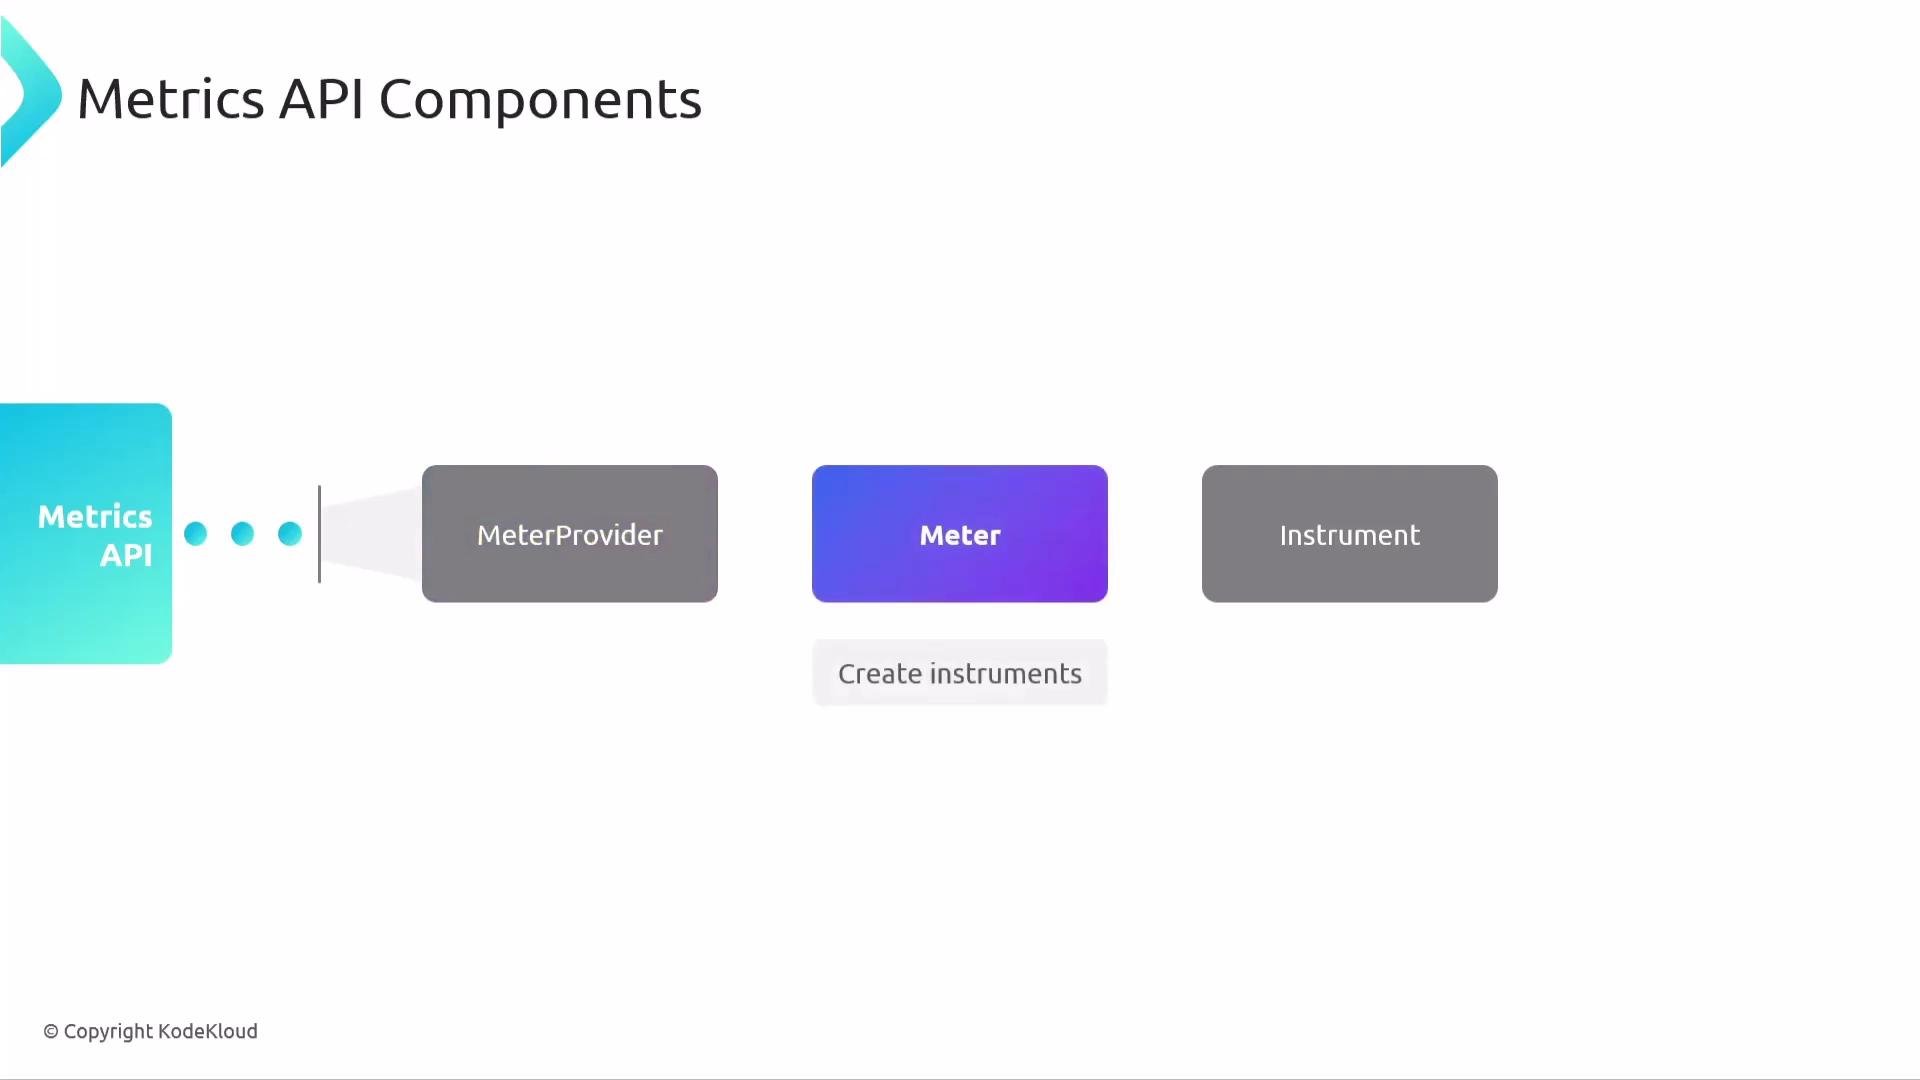
The image illustrates the components of a Metrics API, including "MeterProvider," "Meter," and "Instrument," with the "MeterProvider" labeled as the entry point.
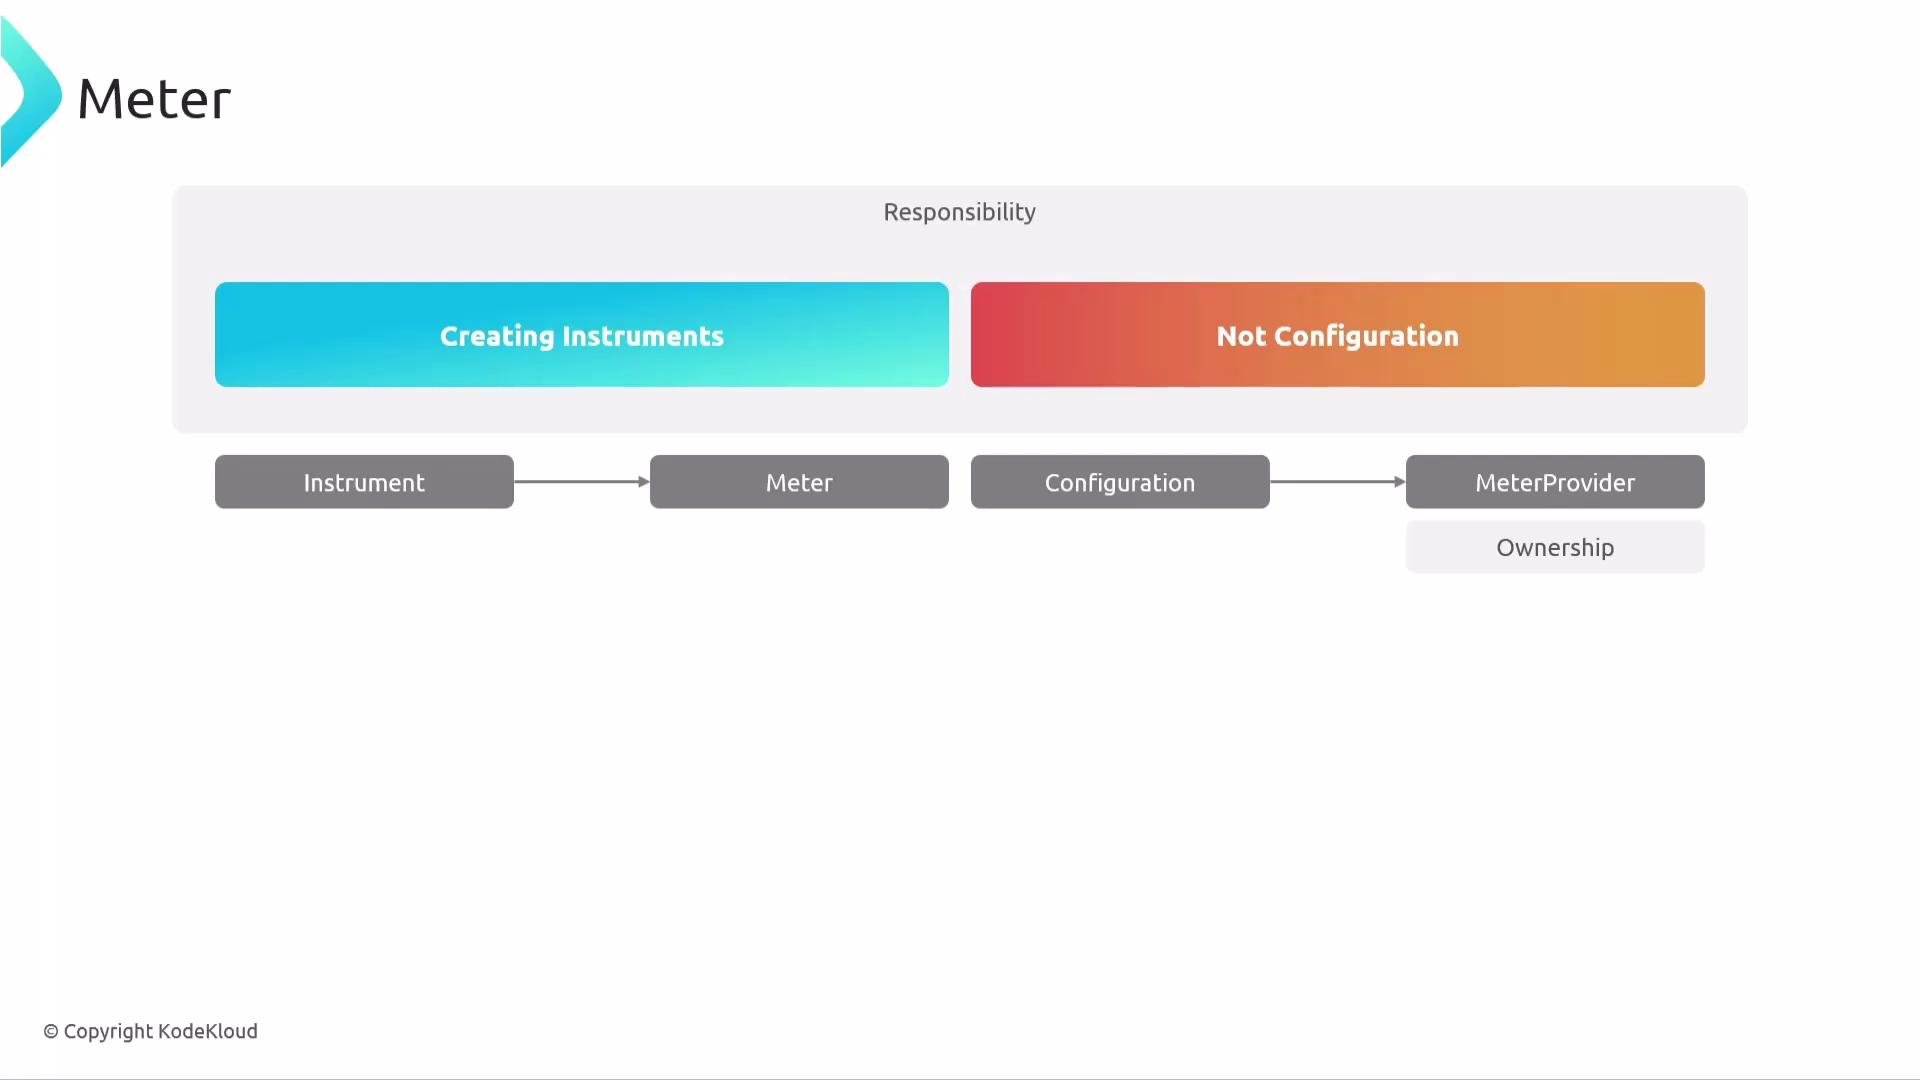
A Meter focuses only on creating instruments — not on configuration. That separation keeps ownership and configuration consistent: instruments are tied to the Meter that created them, and that Meter is tied to a MeterProvider.
The image shows a diagram of the "Metrics API Components," which includes "Metrics API," "MeterProvider," "Meter," and "Instrument."
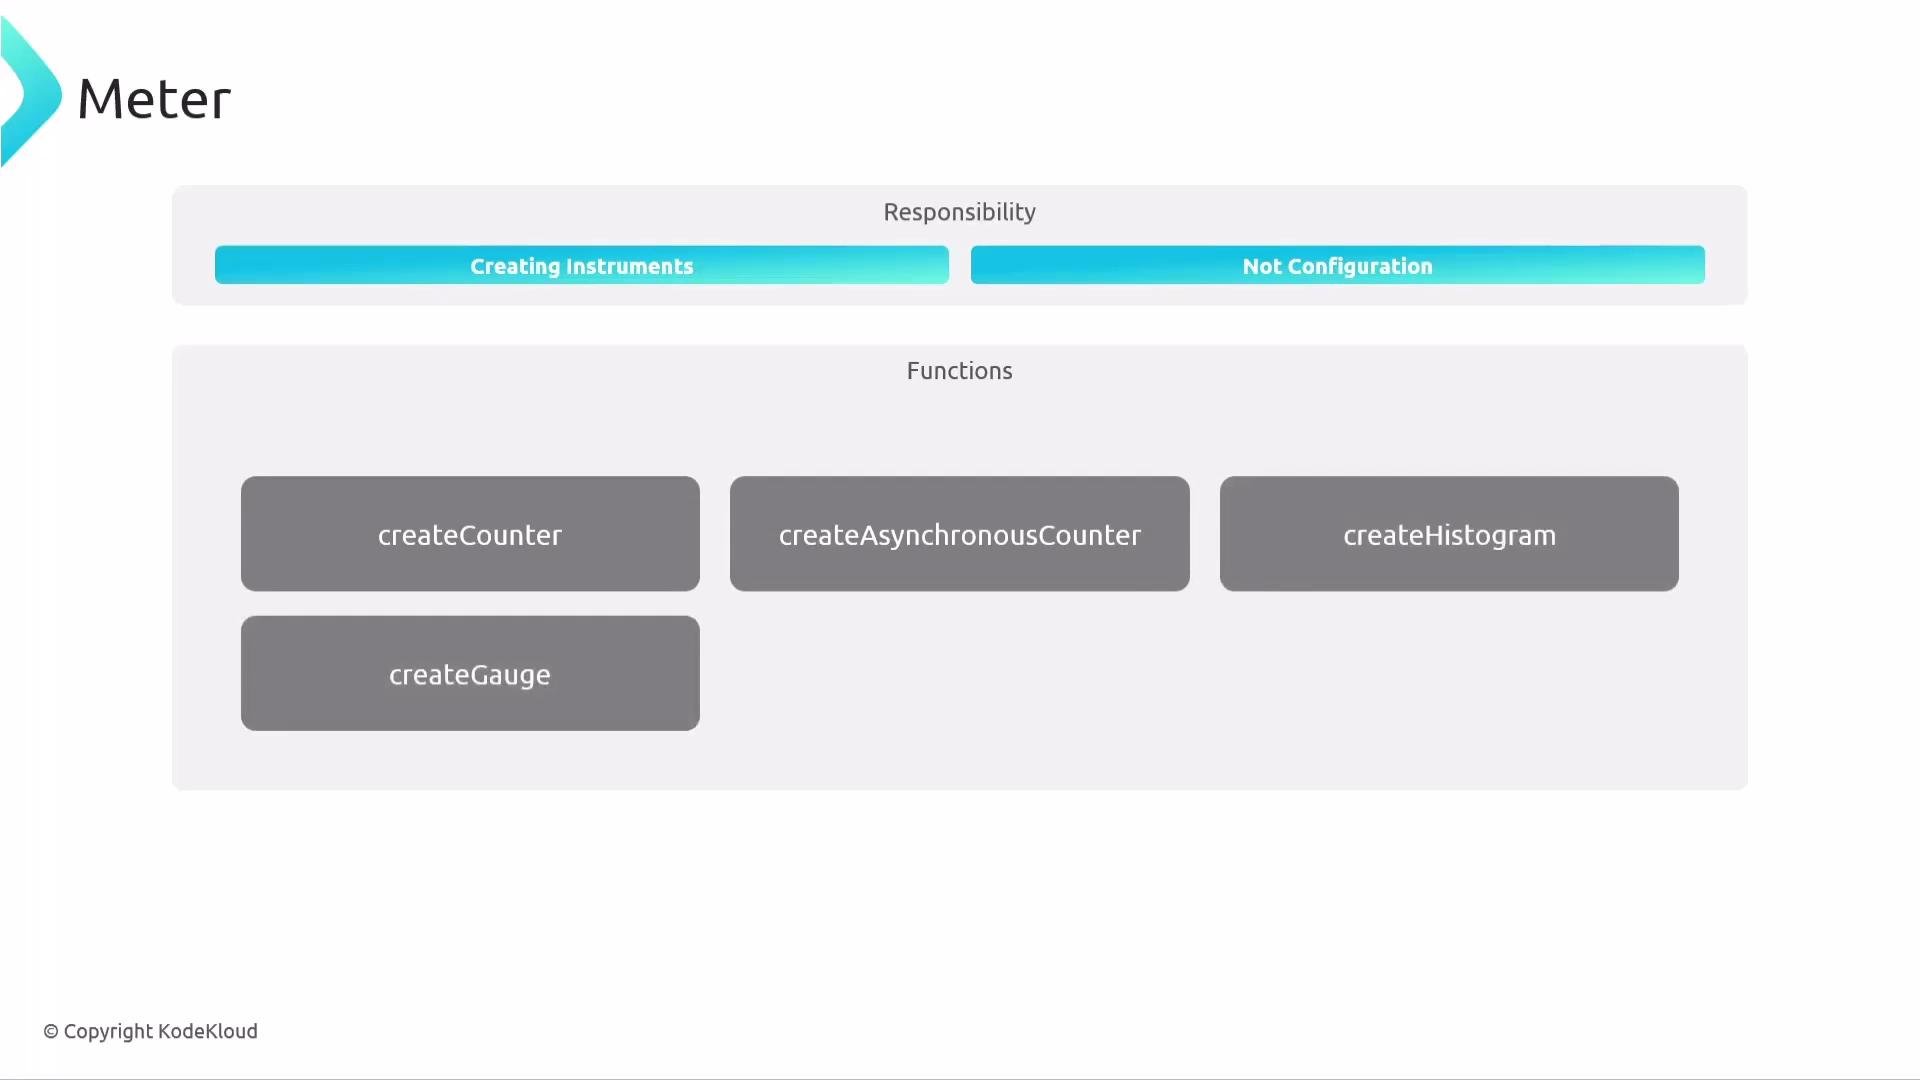
Meters create instruments (counters, histograms, gauges, synchronous and asynchronous instruments) and manage their lifetime.
The image is a diagram about a "Meter" with sections labeled "Responsibility" and "Functions," listing tasks like "createCounter," "createGauge," "createAsynchronousCounter," and "createHistogram." It emphasizes creating instruments, not configuration.
Configuration — processors, exporters, views, aggregation rules, resource attributes — is handled by the MeterProvider. Because each instrument is associated with the Meter that created it, and each Meter is associated with a MeterProvider, ownership and configuration linkage remain clear and predictable.
The image is a flowchart depicting the responsibilities of creating instruments and not configuration, with elements such as "Instrument," "Meter," "Configuration," and "MeterProvider," along with arrows indicating relationships and ownership.
Using the global default MeterProvider is convenient for most applications. Create a custom MeterProvider only when you need separate configuration or isolation (for example, to separate business metrics from runtime or platform metrics).

MeterProvider in detail

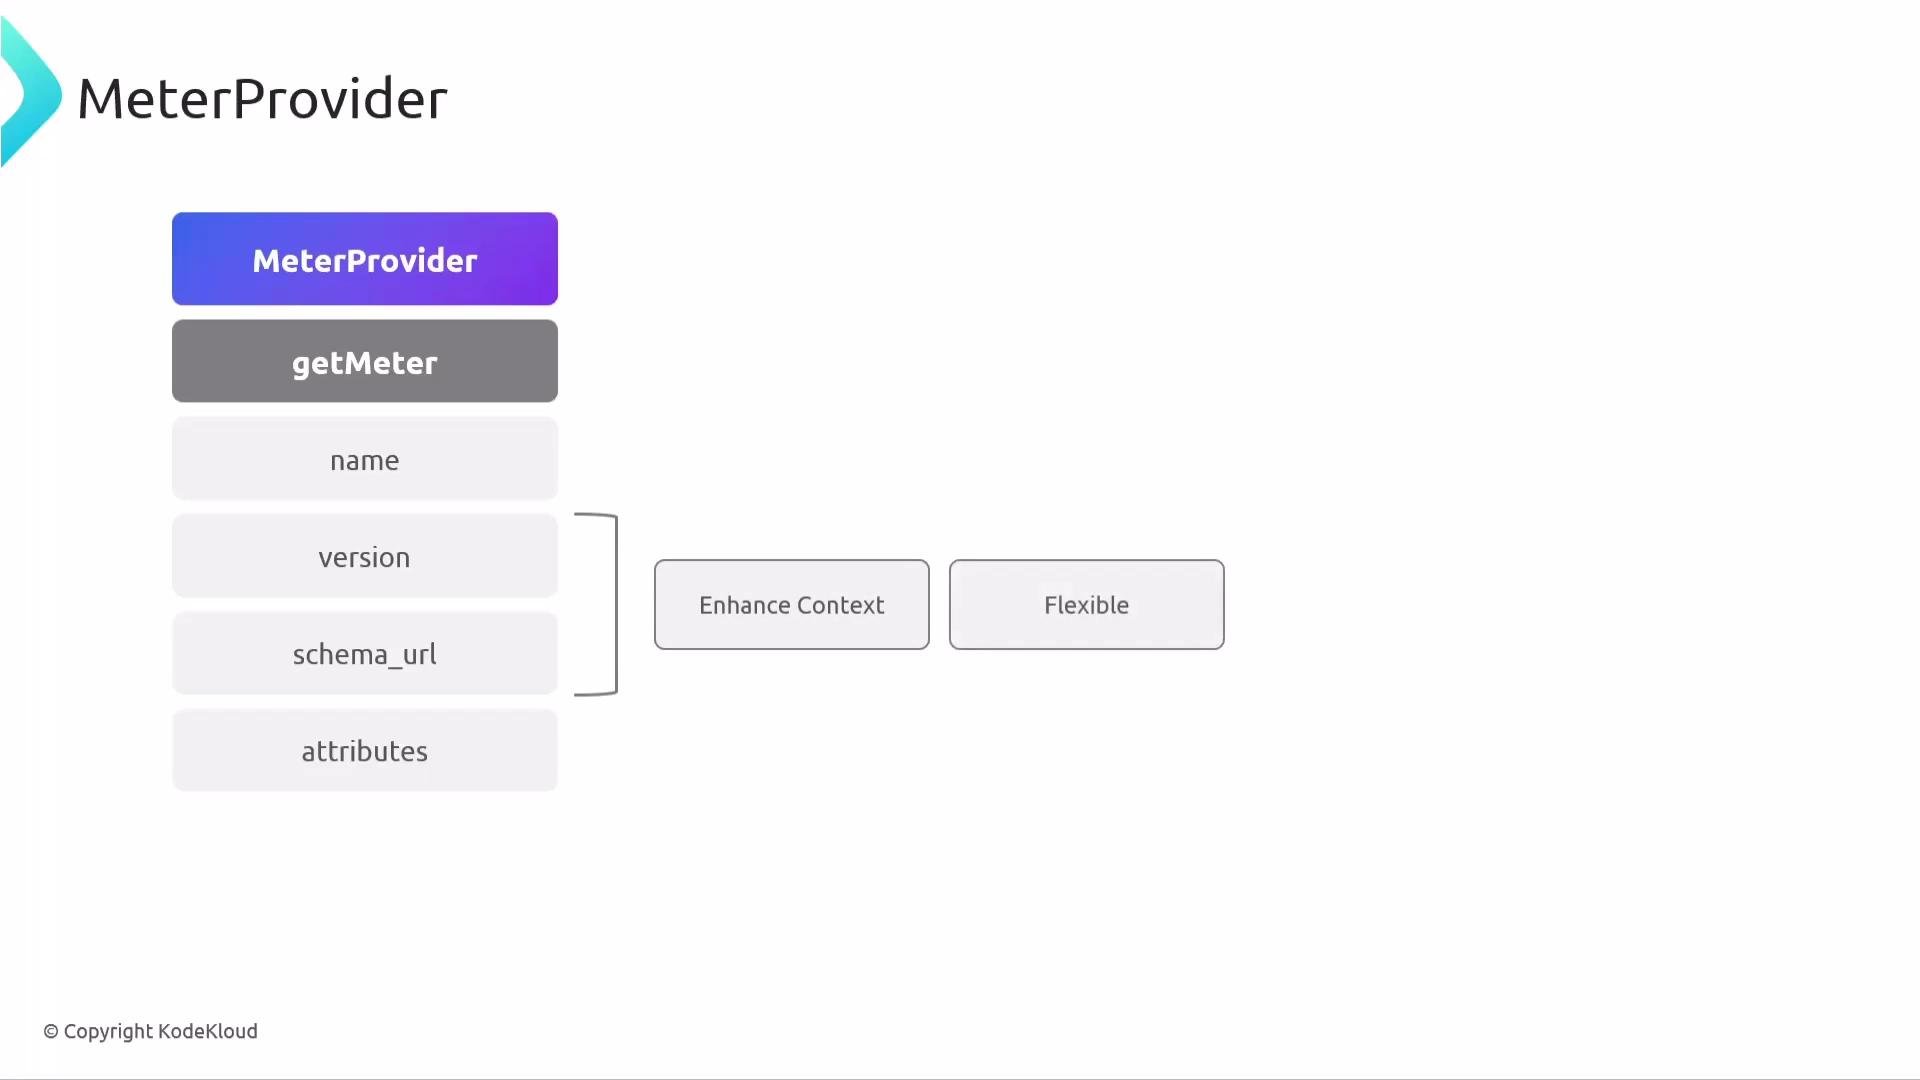
The MeterProvider is the API/SDK entry point that exposes getMeter(...) to obtain a Meter for an instrumentation scope. Typical getMeter arguments are:
  • name (required) — identifies the instrumentation scope (usually a library or component name).
  • version (optional) — the version of the library or component.
  • schema_url (optional) — the semantic conventions schema URL.
version and schema_url are optional, but including them gives downstream processors and exporters richer context for interpretation and mapping.
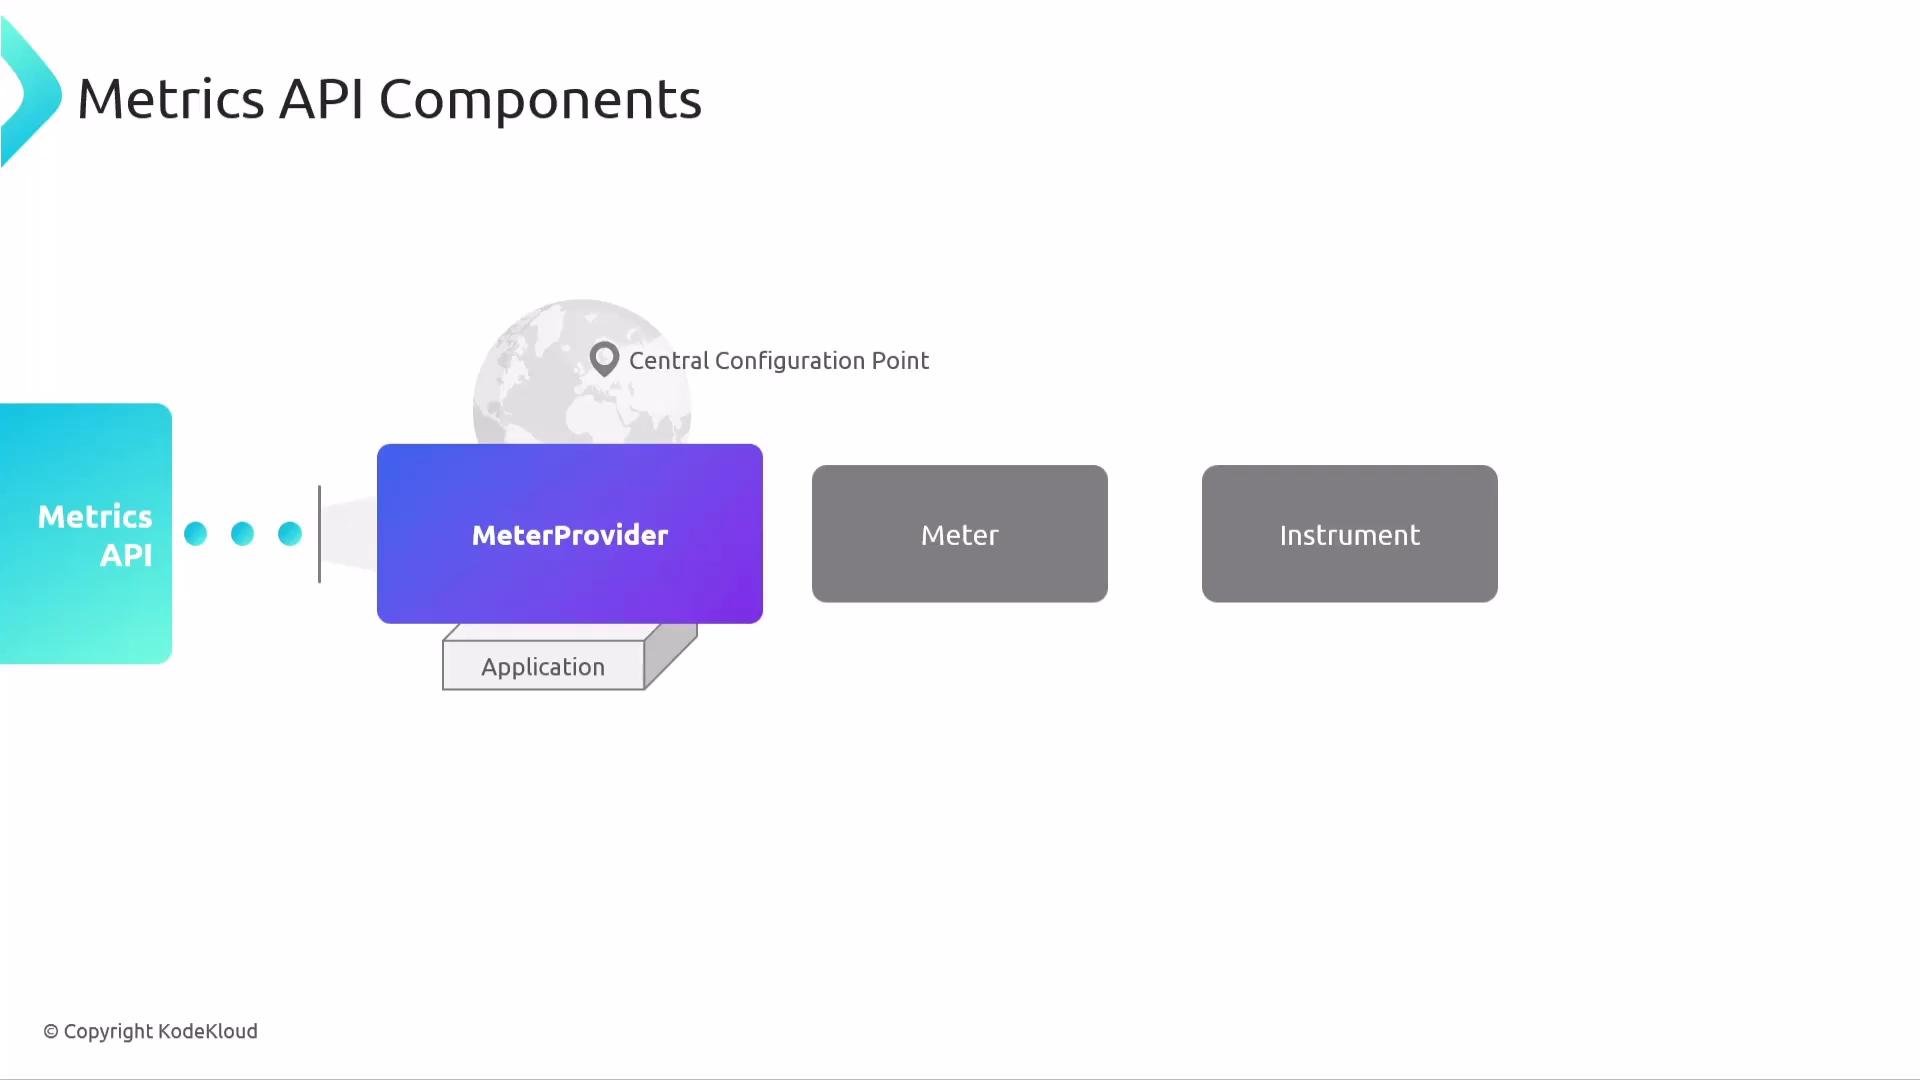
The image is a diagram of Metrics API components, showing the flow from Metrics API to MeterProvider, Meter, and Instrument, with an "Application" and a "Central Configuration Point" noted.
The image is a flowchart titled "MeterProvider" with boxes describing components such as "getMeter," "name," "version," "schema_url," and "attributes," along with annotations "Enhance Context" and "Flexible."

Meter responsibilities

A Meter’s role is instrument creation and lifetime management. Common factory methods include:
  • Synchronous Counter and UpDownCounter
  • Asynchronous counters and gauges (callback-driven)
  • Histogram
  • Gauge-like instruments
Each instrument stays linked to its Meter, enabling traceability to the instrumentation scope and MeterProvider.
The image is a diagram about a "Meter" with sections labeled "Responsibility" and "Functions," listing tasks like "createCounter," "createGauge," "createAsynchronousCounter," and "createHistogram." It emphasizes creating instruments, not configuration.

Instruments: properties and typing

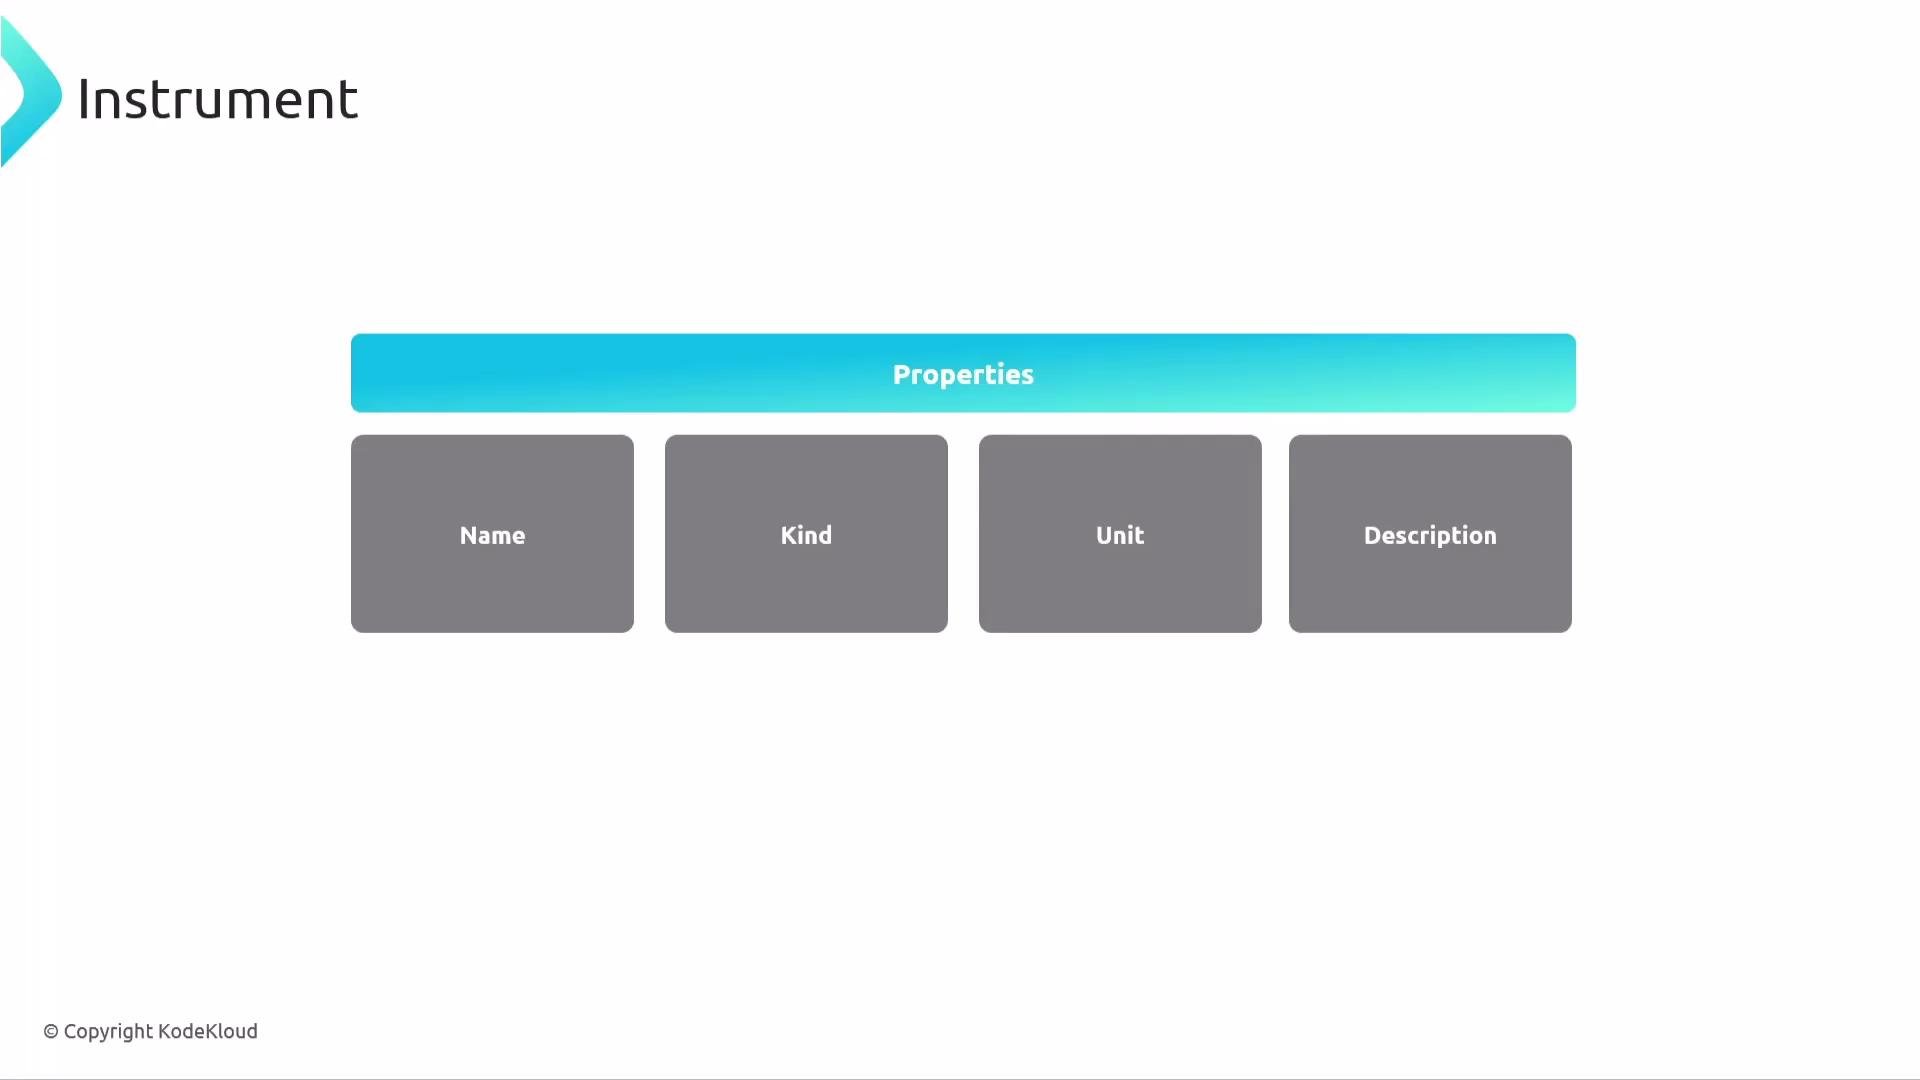
An Instrument represents a metric you record and is defined by several properties:
  • Name (for example, payments.processed_total, http.server.duration)
  • Kind (counter, histogram, gauge, asynchronous counter, etc.)
  • Unit (for example, ms, kB, 1)
  • Description (human-readable purpose)
  • Data type (integer vs floating point)
Instruments are strongly typed: you must create and use an instrument with the matching data type (e.g., integer Counter vs. double Histogram). This guarantees type safety and consistent aggregation semantics.
The image is a diagram titled "Instrument" with a blue header labeled "Properties" and four gray boxes underneath labeled "Name," "Kind," "Unit," and "Description."

Typical instrument types and use cases

Instrument typeTypical use caseNotes
CounterCount events that only increase (e.g., requests processed)Monotonic
UpDownCounterTrack values that can increase/decrease (e.g., concurrent users)Non-monotonic
HistogramMeasure distributions (e.g., request latency)Produces buckets & summary
Asynchronous GaugePeriodic measurements (e.g., free memory)Uses callbacks to observe values
Asynchronous CounterPeriodic monotonic totals (e.g., cumulative bytes sent)Uses callbacks

Example process hierarchy

Below is a concrete example of how a MeterProvider can produce multiple Meters, each with typed, named Instruments. This structure isolates metrics by instrumentation scope and makes them traceable to their origin.
Because each instrument is strongly typed, retrieving and using it in code requires matching its declared type and name.

How metrics flow (SDK responsibilities)

Once your application records measurements, the SDK handles:
  • Aggregation (via Aggregators) — summarizing raw measurement points (sum, last value, histograms)
  • Views — a configuration layer that can rename metrics, change aggregation, or filter instruments without changing instrumentation code
  • Exporting — shipping metrics to a backend using exporters (commonly OTLP)
  • Resource detection — adding contextual attributes (service name, host, container)
  • Optional sampling and filters — used to reduce cardinality or volume when necessary
Common export flow: instrumentation -> Meter -> MeterProvider (SDK config) -> Collector (receivers → processors → exporters) -> backend Recap: core components and their purpose
  • OpenTelemetry API: stable interfaces for metrics, traces, and logs.
  • SDK: concrete implementation that collects, aggregates, and exports telemetry.
  • MeterProvider: factory + central configuration for metrics.
  • Meter: instrumentation scope and instrument factory.
  • Instruments: the primitives used to record measurements.
  • View: configuration layer to reshape metrics collection and aggregation without changing the code.
  • Aggregator: converts raw measurements into summarized metrics.
  • Exporter: ships metrics to backends (see OTLP for a common protocol).
  • Resource detectors: capture environment/contextual attributes.
  • Sampling/filters: reduce cardinality or volume when needed.
The image provides an overview of "Metrics API and SDK," highlighting their components: MeterProvider, Meter, Instrument, and Telemetry.
That covers the Metrics API and SDK: how Meters and Instruments are structured, how the MeterProvider configures behavior, and how the SDK aggregates and exports the telemetry you record.

Watch Video