

Core components
The Logs API centers around four core components. The following table summarizes each component, its purpose, and a short example of how you might interact with it.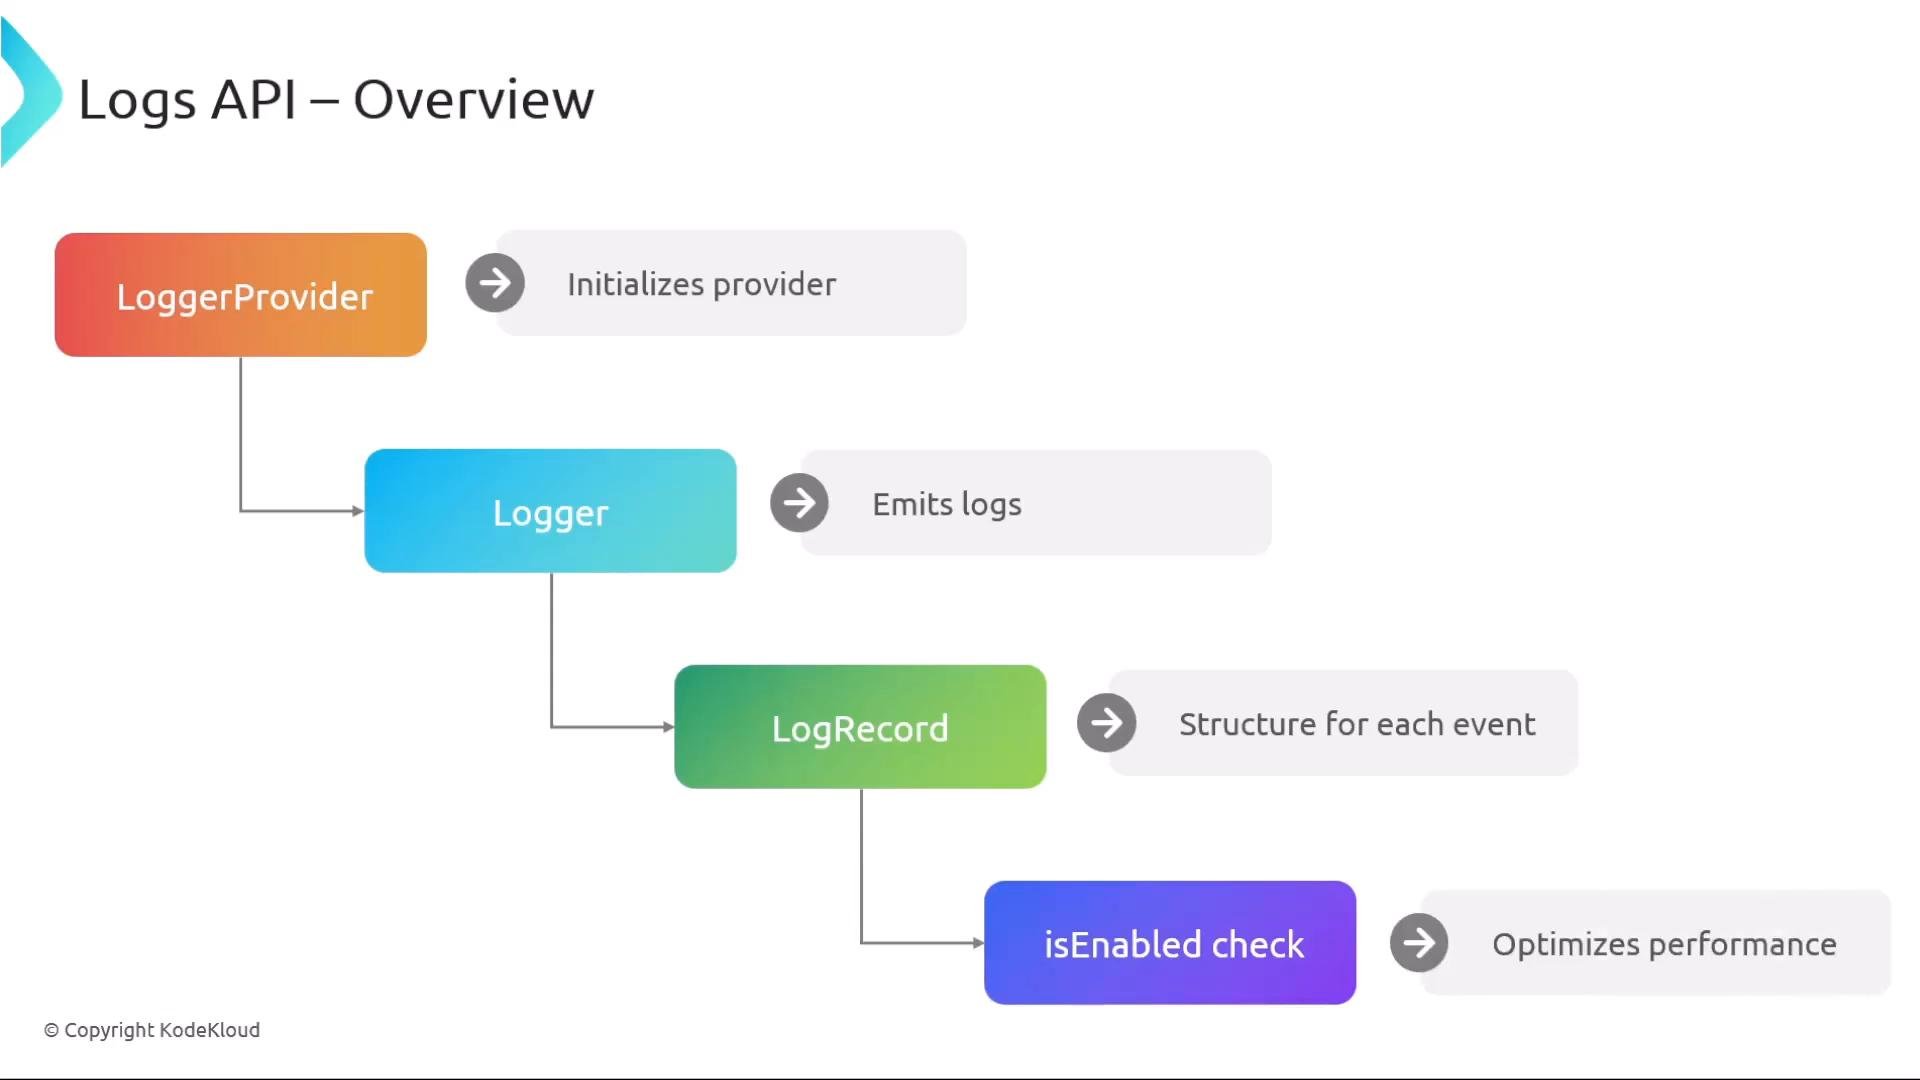
LoggerProvider and Logger
TheLoggerProvider is the factory used to obtain Logger instances. You can use a global provider or create/initialize your own provider for custom behavior. A Logger is typically obtained per instrumentation scope (for example, per module or library).
Example (Java-style pseudocode) showing initialization and retrieving a logger:
nameis required and identifies the instrumentation scope.- Other fields such as
version,schemaUrl, and staticattributesare optional. LoggerProviderandLoggerAPIs are designed to be thread-safe — safe to call from concurrent code.
Use isEnabled to avoid unnecessary work
Before performing expensive operations (message formatting, serialization, collecting heavy attributes), callisEnabled with the appropriate severity and context. This avoids unnecessary CPU and memory use when the logging level is disabled.
Use
isEnabled to guard expensive operations (string formatting, serialization, expensive attribute collection) so your application avoids unnecessary work when logs are disabled.Emitting LogRecords
When you emit a log, include whichever fields are relevant to your use case. Common fields include:timestamp— when the event occurredseverity— level (e.g.,INFO,ERROR)body— the message or payloadattributes— structured key/value datatrace_id/span_id— for correlating logs with traces
Logging workflow summary
- Initialize or obtain a
LoggerProvider. - Call
getLoggerto obtain aLoggerfor your module/instrumentation scope (nameis required). - Use
isEnabledto check whether logging at a given severity/context is currently enabled. - Call
emiton theLoggerto create/send aLogRecordwith desired fields (timestamp, severity, body, attributes, trace/span ids, etc.). - Exporters receive
LogRecords and send them to your backend (for example, via OTLP).
Best practices
- Always guard expensive log construction with
isEnabled. - Include trace/span identifiers when possible to enable correlation between logs and traces.
- Use structured attributes (key/value) instead of concatenated messages for better querying in backends.
- Prefer consistent naming for attributes (e.g.,
order.id,user.id) to improve analytics and dashboards.