

Foundational standards (what defines behavior)
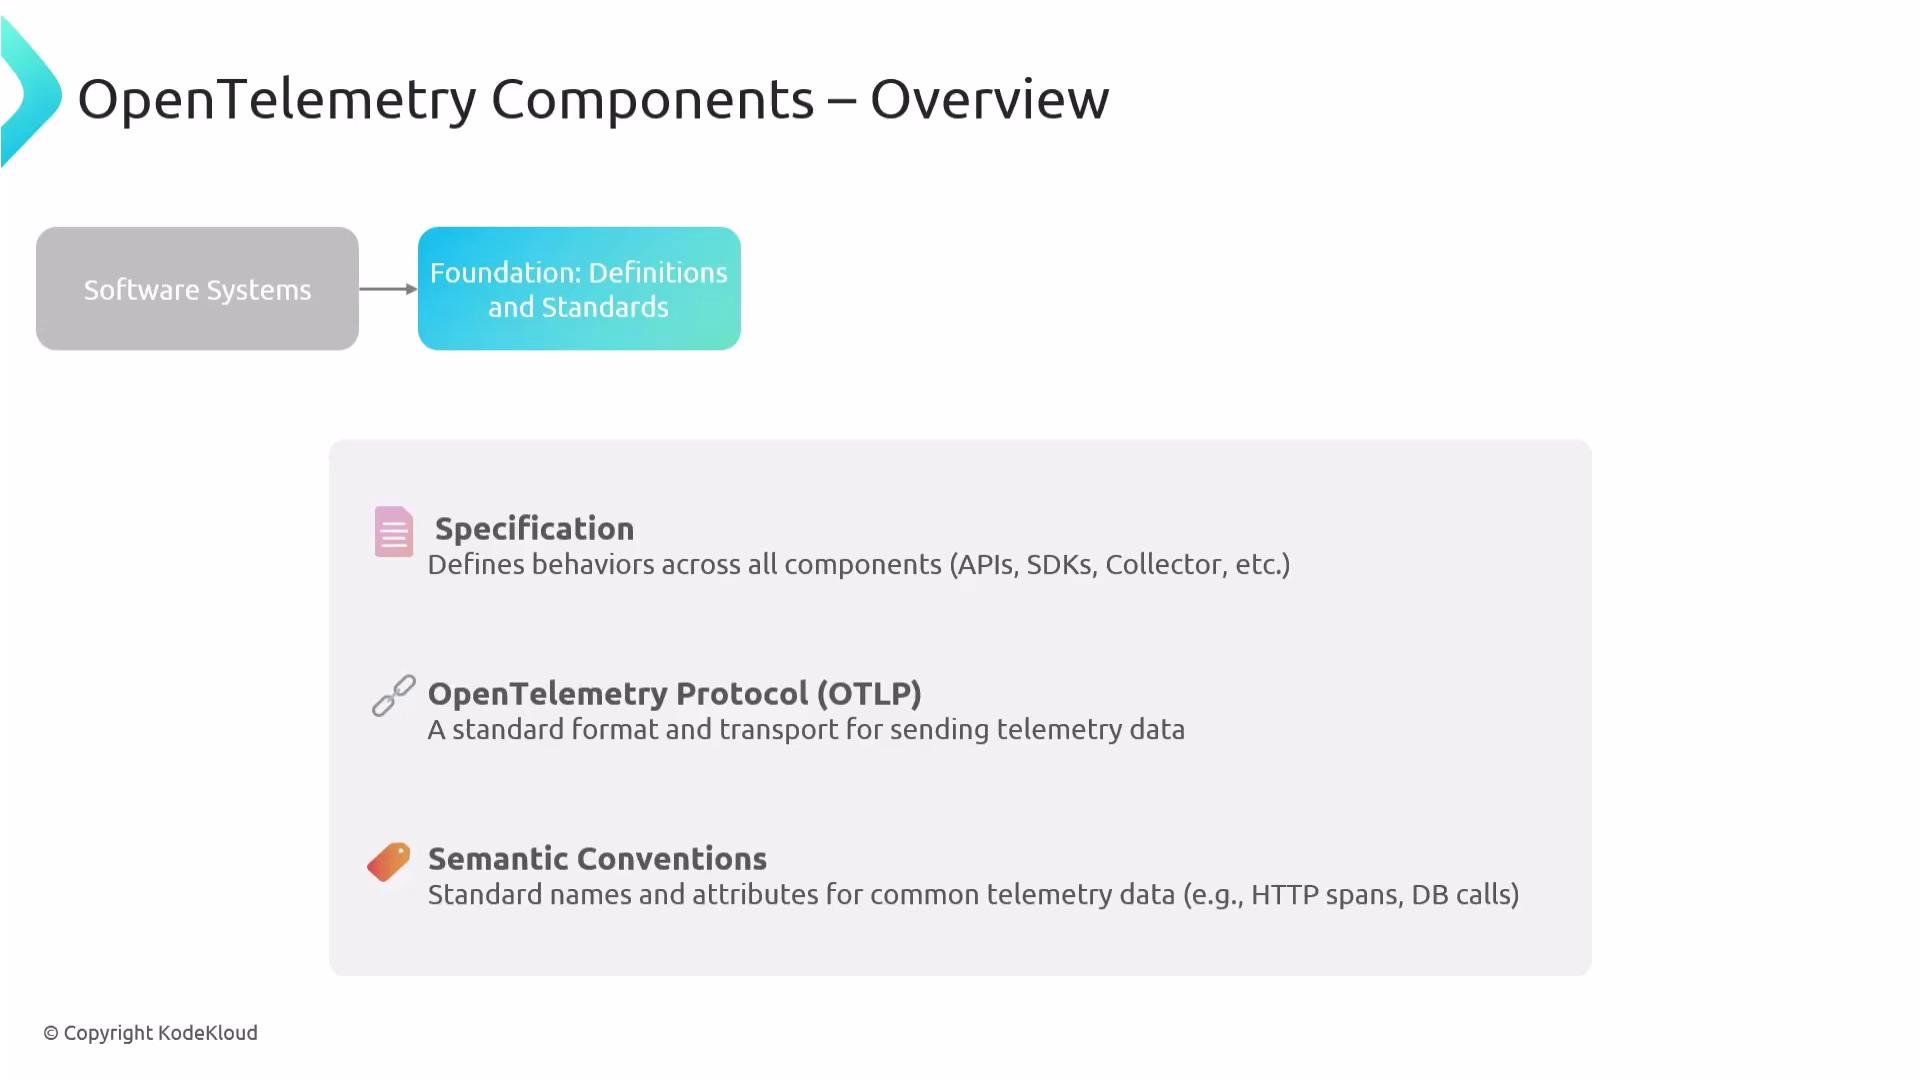
These core specifications govern behavior across the OpenTelemetry ecosystem:- Specifications — Define expected behavior for APIs and SDKs (API surface, SDK responsibilities, semantics for errors and exceptions).
- OpenTelemetry Protocol (OTLP) — The standard wire format and transport protocol for sending traces, metrics, and logs.
- Semantic Conventions — Standard attribute names and conventions for common telemetry types (HTTP spans, database calls, resource attributes).
Code-level tooling (how telemetry is created)
This layer includes the libraries and runtime components you use to produce telemetry from applications:
The API and SDK are intentionally separated so instrumentation code remains stable while implementations evolve.
Processing and routing (the Collector)
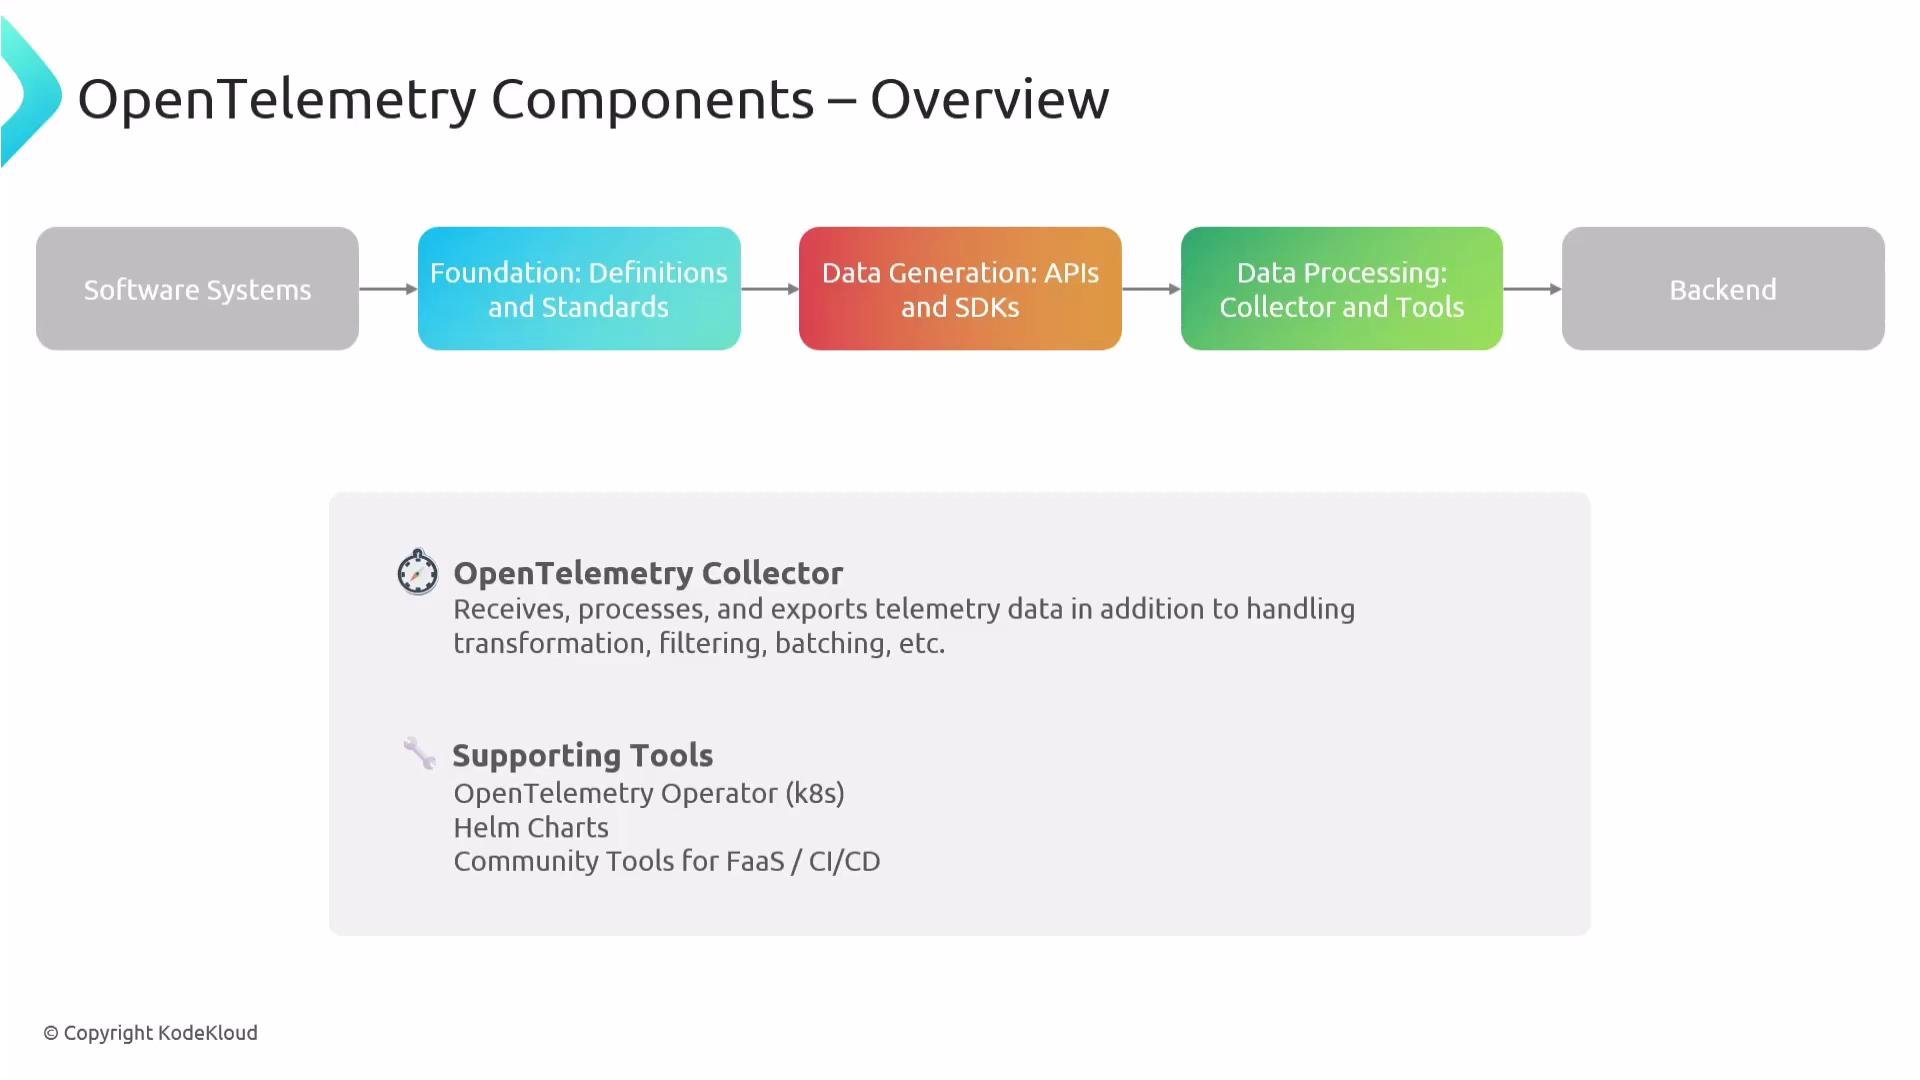
Telemetry often needs to be transformed, filtered, or routed before reaching a backend. The central component for this is:- OpenTelemetry Collector — A vendor-agnostic, configurable service that receives, processes, and exports telemetry. The Collector supports batching, retries, transformations, filtering, and multi-destination routing, and can act as a gateway between instrumented applications and backends.
The Collector centralizes processing logic (filtering, batching, and exporting), reducing the need for exporter implementations inside each application and enabling consistent telemetry handling across environments.
Deployment, distributions, and ecosystem tooling
Beyond the core components, the OpenTelemetry ecosystem includes tools to deploy and extend your observability stack:- Operator & deployment tools: OpenTelemetry Operator, Helm charts, and other utilities to run Collector and agents in Kubernetes and cloud environments.
- Community distributions: Project-specific or vendor-provided distributions that bundle collectors, exporters, and preconfigured pipelines.
- Integrations & platform tooling: Support for serverless platforms, CI/CD pipelines, and language-specific helpers.
How the pieces fit together
- Left side (producers): Applications instrumented via APIs/SDKs, instrumentation libraries, or auto-instrumentation agents generate telemetry.
- Middle (processing): The Collector aggregates, processes, and routes telemetry—applying transformations, batching, or sampling as configured.
- Right side (consumers): Backends and observability platforms receive OTLP or other exporter data for long-term storage, querying, and visualization.
Quick reference & further reading
- OpenTelemetry Specification: https://opentelemetry.io/docs/reference/specification/
- OTLP (Protocol): https://opentelemetry.io/docs/specs/otel/otlp/
- Semantic Conventions: https://opentelemetry.io/docs/reference/specification/semantic_conventions/
- OpenTelemetry Collector: https://opentelemetry.io/docs/collector/
- Instrumentation: https://opentelemetry.io/docs/instrumentation/
- OpenTelemetry Operator (Kubernetes): https://github.com/open-telemetry/opentelemetry-operator