

- fetch and customize the Collector Helm chart values,
- enable Kubernetes-specific presets (attributes, kubelet metrics, logs),
- expose node-local OTLP endpoints via host ports,
- deploy an instrumented application that sends OTLP to the node-local collector,
- optionally forward traces to Jaeger for visualization.
Environment
For this demo I created a local kind cluster with three nodes (one control-plane and two workers). Verify nodes with: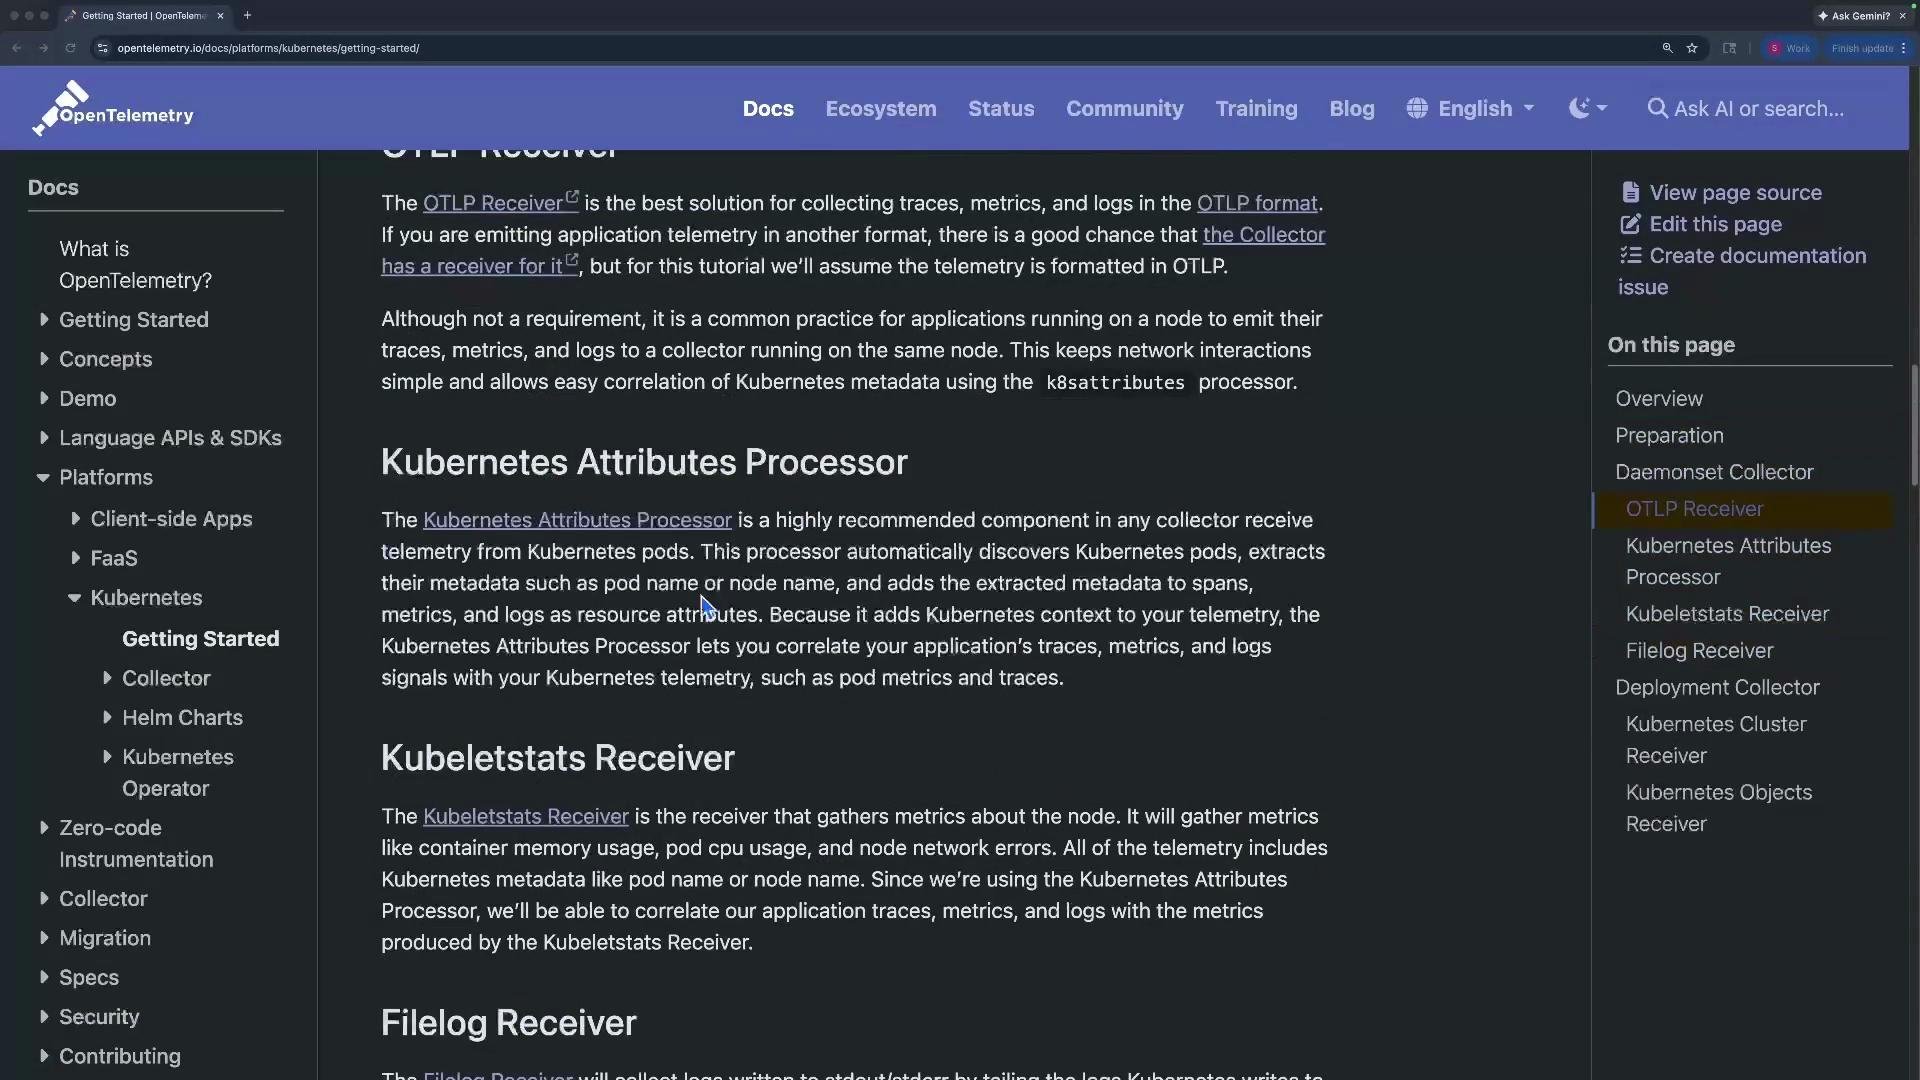
1 — Prepare a local values.yaml
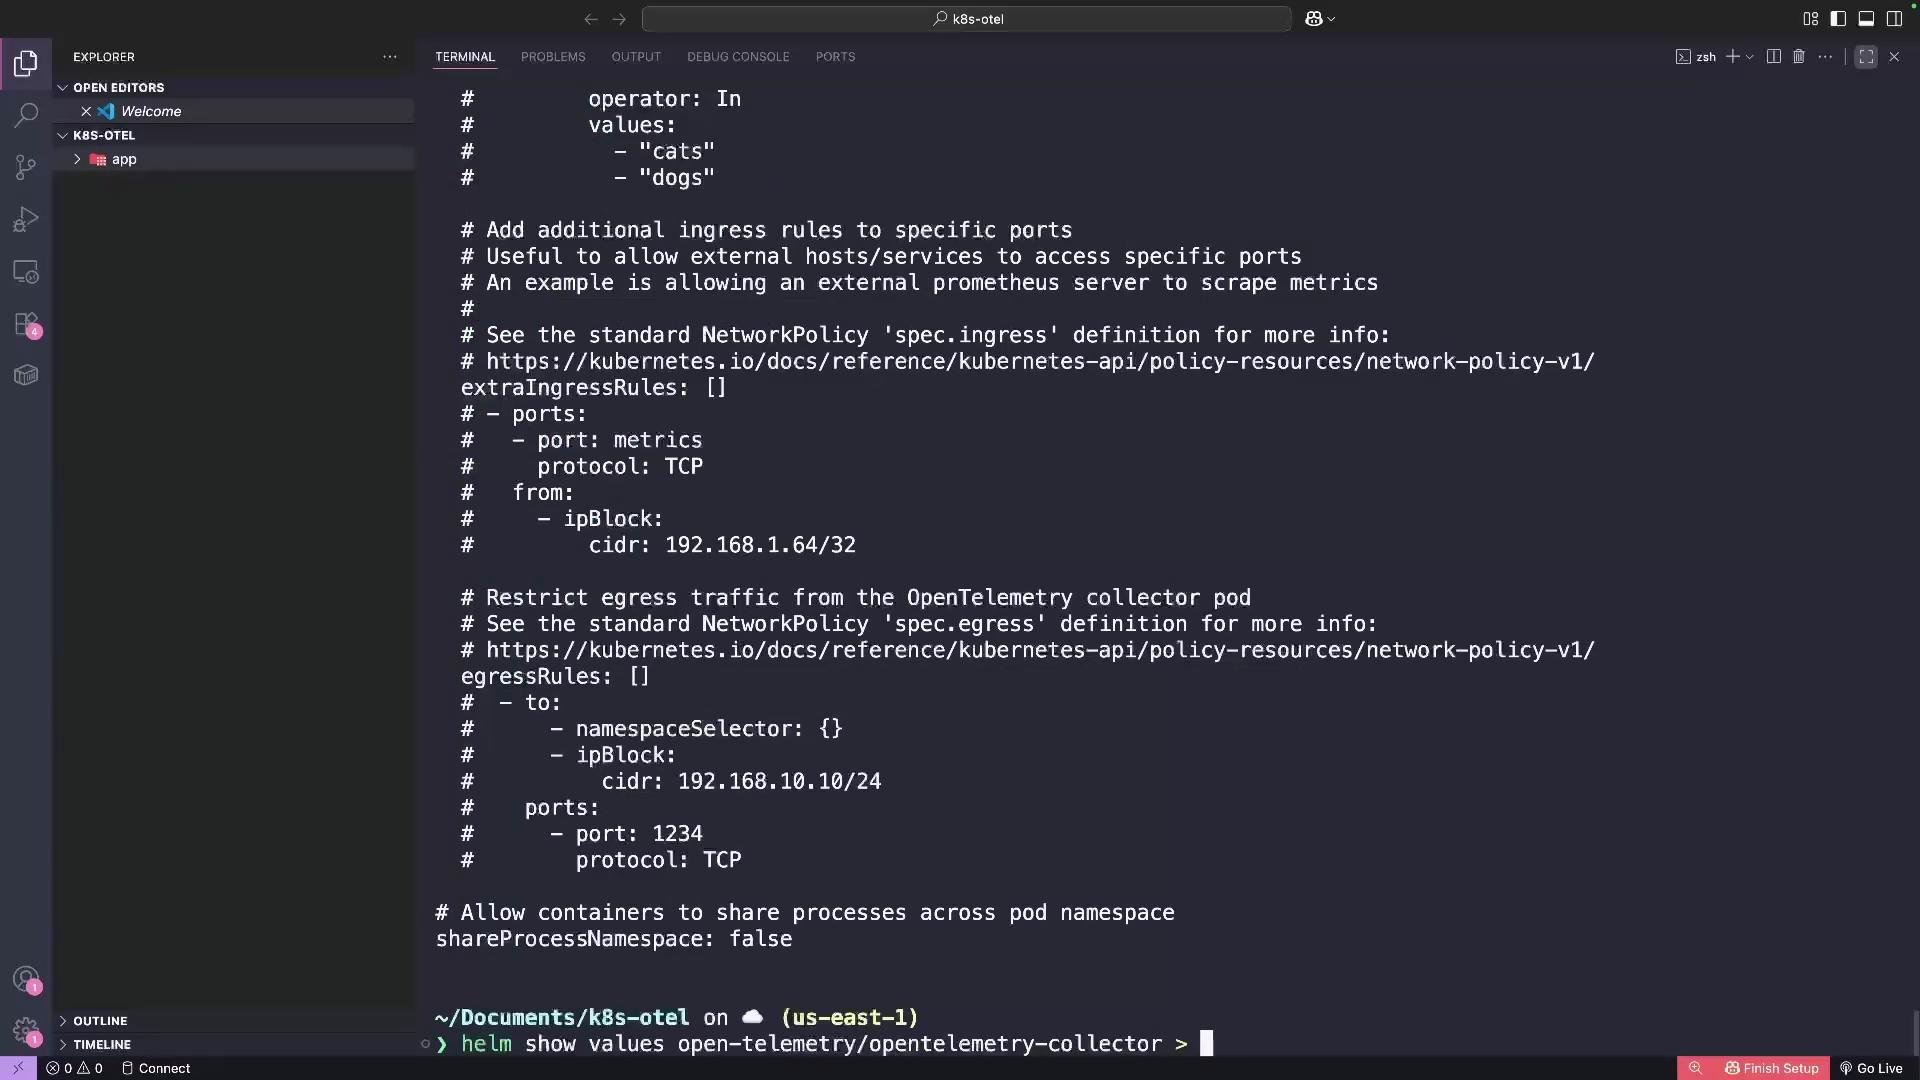
Fetch the chart’s default values into a localvalues.yaml so you can edit the Collector configuration (mode, image, presets, config):
values.yaml in your editor/IDE and edit the sections you need: mode, image, presets, and config (receivers/processors/exporters/pipelines). I prefer editing locally for clarity and versioning.
2 — Presets: enable built-in Kubernetes integrations
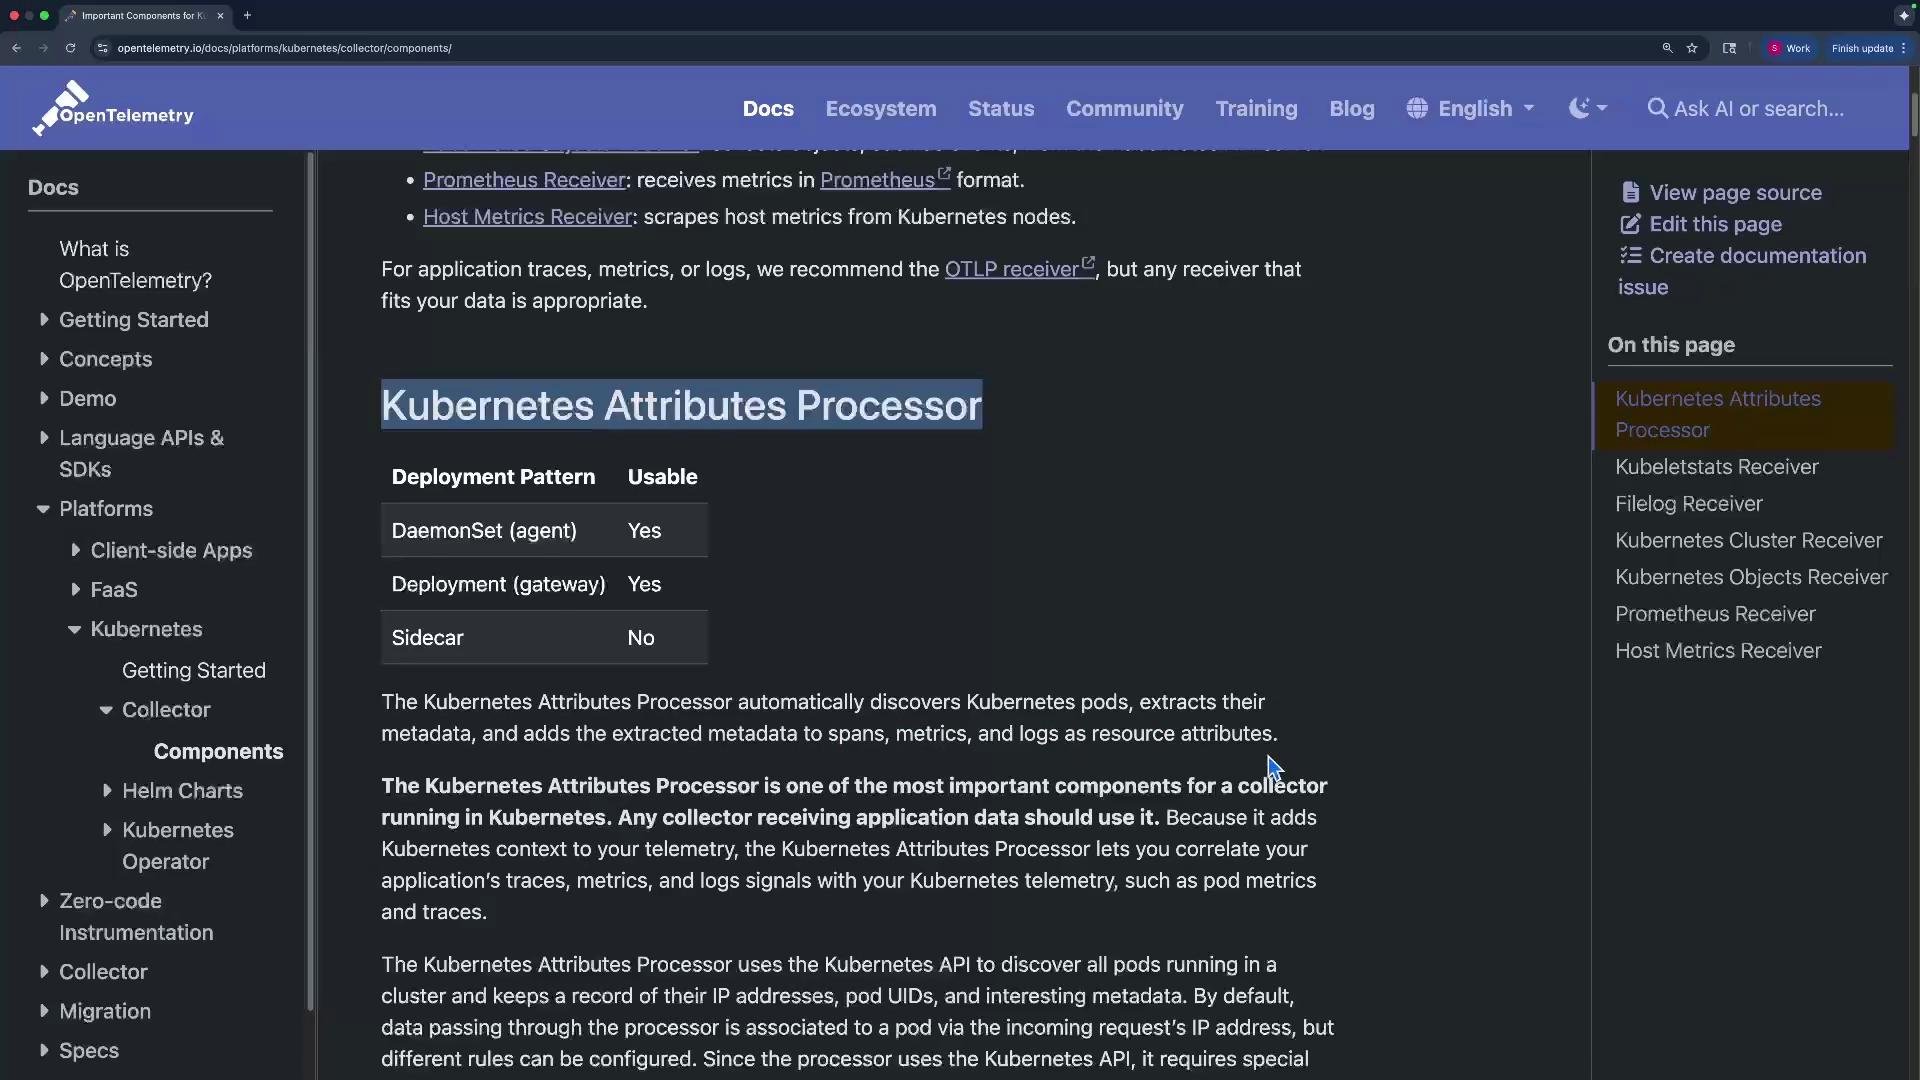
The Helm chart exposes “presets” that add common Kubernetes-related components (kubernetesAttributes processor, kubeletstats receiver, host metrics, file log collection, etc.). Enabling a preset also adjusts RBAC, volumes, and mounts automatically. Example minimal preset snippets to include underpresets: in values.yaml:
kubernetesAttributes enriches telemetry with pod, container, and node metadata (pod name, pod UID, node name, labels, etc.), which is highly valuable when troubleshooting or visualizing traces/metrics/logs.
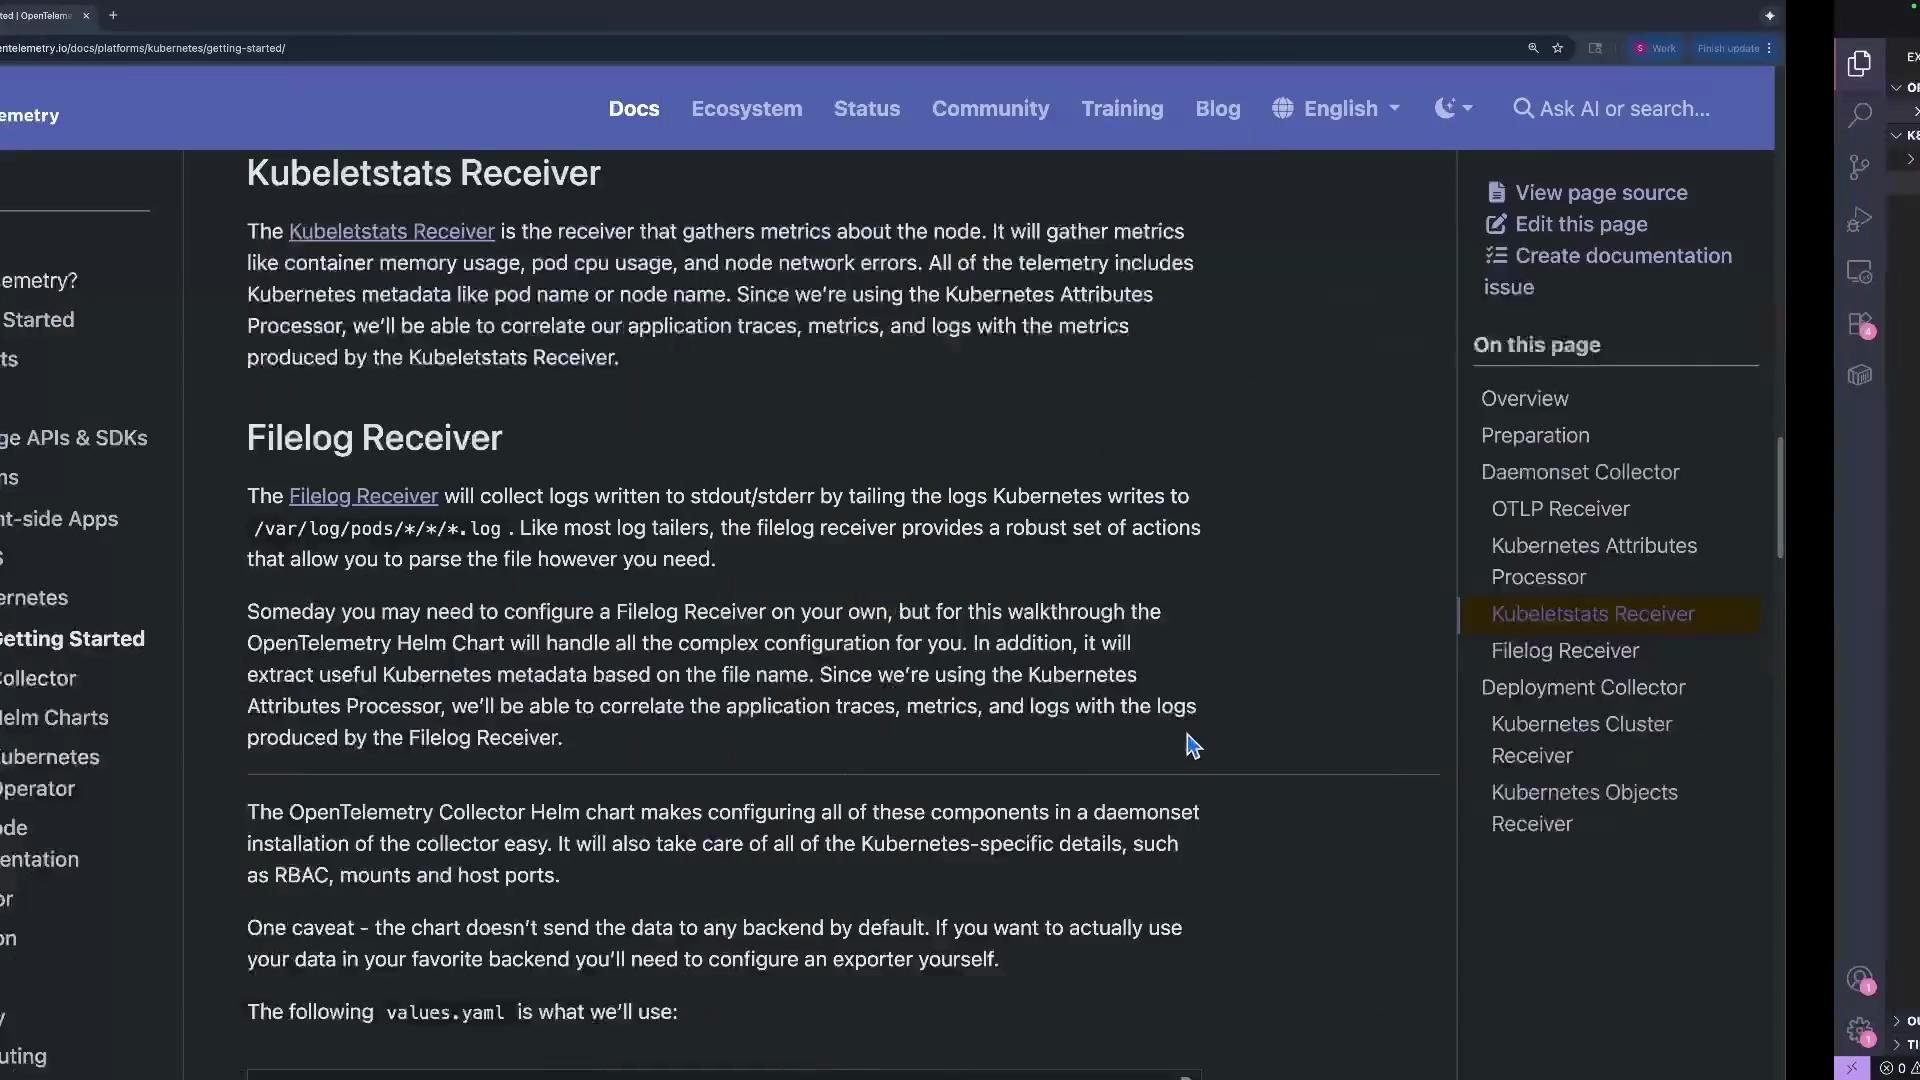
kubeletstats to collect node/pod/container metrics:
3 — Mode: daemonset vs deployment (choose the right topology)
A Collector can run as a DaemonSet (node-local), Deployment (centralized), or StatefulSet. Choose based on collection needs, latency, and scaling.DaemonSet ensures a collector runs on every node (useful to keep network hops low and to collect host-level metrics). Deployment gives centralized collectors and may be easier to scale for ingestion/backpressure.
mode: daemonset so apps can send OTLP to a collector running on the same node.
4 — Collector configuration (receivers / processors / exporters / pipelines)
Underconfig: in values.yaml define receivers, processors, exporters, extensions, and service pipelines. A simple example enabling OTLP receivers and a debug exporter:
Do not remove the
health_check extension unless you update the liveness/readiness probes. Removing it can cause the Helm chart’s probes to fail and result in CrashLoopBackOff.5 — Install the Collector with Helm
Install the customized chart:Troubleshooting CrashLoopBackOff
If Collector pods crash, inspect logs to find configuration errors:values.yaml and update the release:
6 — How the DaemonSet exposes OTLP on node host ports
When usingmode: daemonset, the chart config maps container ports to host ports (hostPort) so OTLP traffic sent to http://<node-ip>:4318 or gRPC to <node-ip>:4317 is delivered to the local collector pod.
Inspect the DaemonSet YAML and node IPs:
http://<node-ip>:4318/v1/traces or OTLP gRPC to <node-ip>:4317 will reach the node-local collector.
7 — Deploy a sample instrumented application
This sample app (sloppy-networks/traces-py) periodically generates a trace and exports it via OTLP HTTP to the collector. The app reads the collector host from an environment variable K8S_NODE_IP which we populate from the node’s IP using a fieldRef.
Python tracer configuration excerpt:
app-deployment.yaml:
kubernetesAttributes preset enabled earlier.
8 — Forward traces to Jaeger (optional)
To visualize traces, deploy Jaeger and configure the Collector to export traces to Jaeger. Example Jaeger Deployment (all-in-one):values.yaml for the Collector to include an exporter pointing to jaeger-internal:4317 (OTLP gRPC) or http://jaeger-internal:4318 (OTLP HTTP). Example config.exporters and pipeline snippet:
http://<node-ip>:30007) and you should see traces from the instrumented flight-service.
Summary checklist
- Added the OpenTelemetry Helm repository and used
helm show valuesto create a localvalues.yaml. - Enabled presets:
kubernetesAttributes,kubeletMetrics,logsCollectionto simplify Collector configuration and RBAC. - Deployed the Collector as a DaemonSet (node-local) with
hostPortmappings for OTLP (4317/4318). - Deployed an instrumented Python app that reads the node IP via
status.hostIPand sends OTLP tohttp://<node-ip>:4318/v1/traces. - (Optional) Deployed Jaeger and configured the Collector to export traces to a ClusterIP
jaeger-internalservice, then verified traces via Jaeger UI.
Links and references
- OpenTelemetry Helm charts: https://github.com/open-telemetry/opentelemetry-helm-charts
- OpenTelemetry Collector docs: https://opentelemetry.io/docs/collector/
- Kubernetes docs: https://kubernetes.io/docs/
- Jaeger: https://www.jaegertracing.io/