

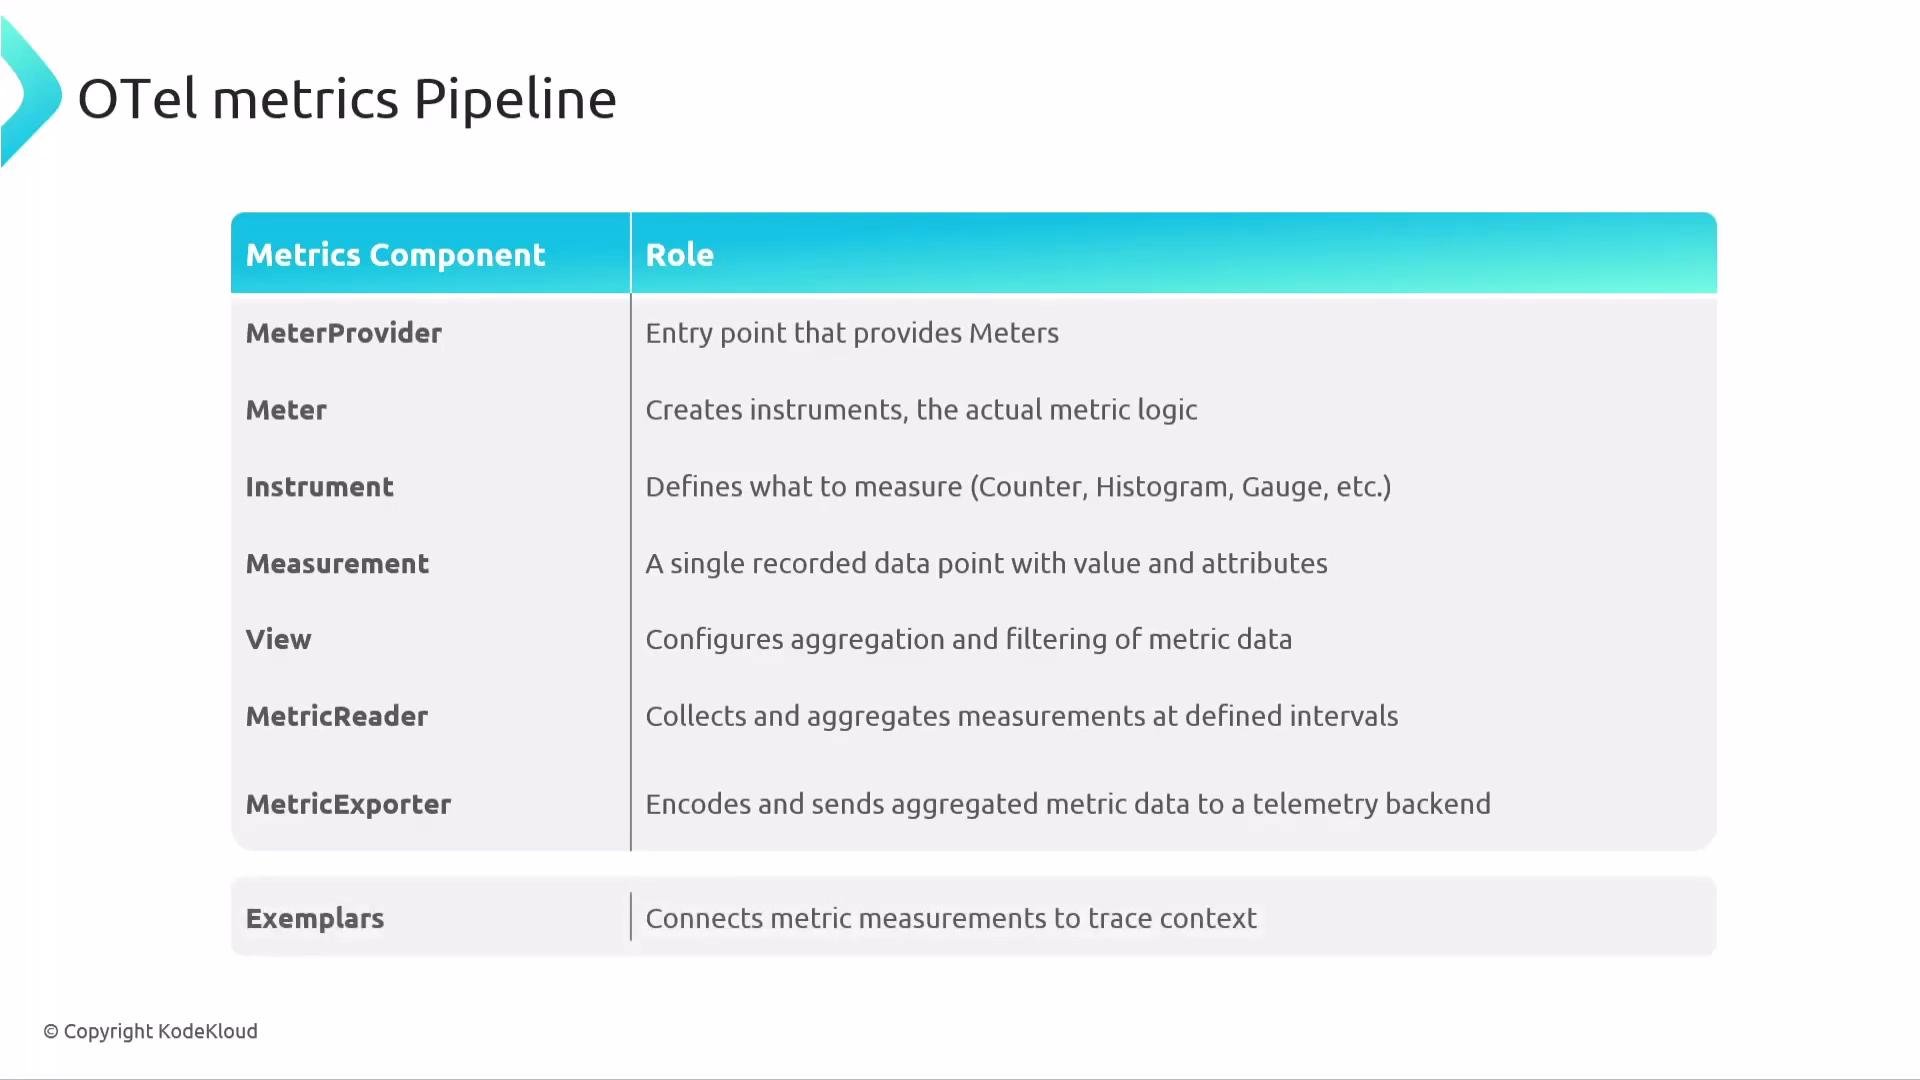
- MeterProvider: the entry point that provisions meters and configures the pipeline.
- Meter: represents an instrumentation scope (a library or component) and creates instruments.
- Instrument: counters, histograms, and up-down counters that record measurements.
- Measurement: a single recorded data point emitted by an instrument.
- View: an optional transformation layer to configure aggregation, filtering, renaming, or attribute changes without changing application code.
- MetricReader: controls collection and aggregation intervals and triggers exports.
- MetricExporter: encodes aggregated metric data (e.g., in OTLP) and sends it to a backend.
- Exemplars: sampled metric measurements that include trace/context information linking the metric to the exact trace/span that produced it.
Exemplars are sampled measurement points that include trace/span identifiers or other context. They let you jump from an interesting metric value to the trace(s) that generated it—great for root-cause analysis and drill-down.
MeterProvider and how it ties the pipeline together
The MeterProvider is the root of the Metrics SDK pipeline. It:- Owns one or more Meters (each represents an instrumentation scope such as a library or component).
- Configures pipeline behavior (views, readers, exporters, and resource attribution).
- Applies any meter configurator logic that can enable/disable meters by scope.
Avoid empty or vague meter names. The SDK may return a functional meter for an empty name (sometimes with a warning), but you’ll lose important attribution metadata.
A full lifecycle example
The example below illustrates a typical end-to-end setup: initialize a MeterProvider with a Resource and meter configurator, attach a periodic MetricReader with a Console exporter, create a Meter and instrument, record measurements, and register a runtime View to filter attributes.- Initialize MeterProvider with a
Resource(for example,service.nameandenv) and optionally supply ameter_configuratorto enable/disable meters by scope. - Attach a
PeriodicExportingMetricReaderand aMetricExporter(Console in this demo) to control export timing and serialization. - Create a
Meterwith a descriptive name and version, then create Instruments and record Measurements with attributes. - Register an optional
Viewat runtime to transform or filter attributes before export (this keeps instrumentation code untouched while applying policy).
Pipeline summary
Think of the MeterProvider as your metrics factory and central configurator. The main pipeline stages are:
Mnemonic: “Please Make Insight Via Reliable Exports”
(P = Provider, M = Meter, I = Instrument, V = View, R = Reader, E = Exporter) Links and references
- OpenTelemetry Metrics specification and SDKs: https://opentelemetry.io/docs/
- OTLP (OpenTelemetry Protocol) details: https://github.com/open-telemetry/opentelemetry-specification