

Exporters should not perform aggregation or alter temporality. If a destination requires a custom metric format that the SDK does not natively support, the exporter must surface this clearly in logs and documentation.
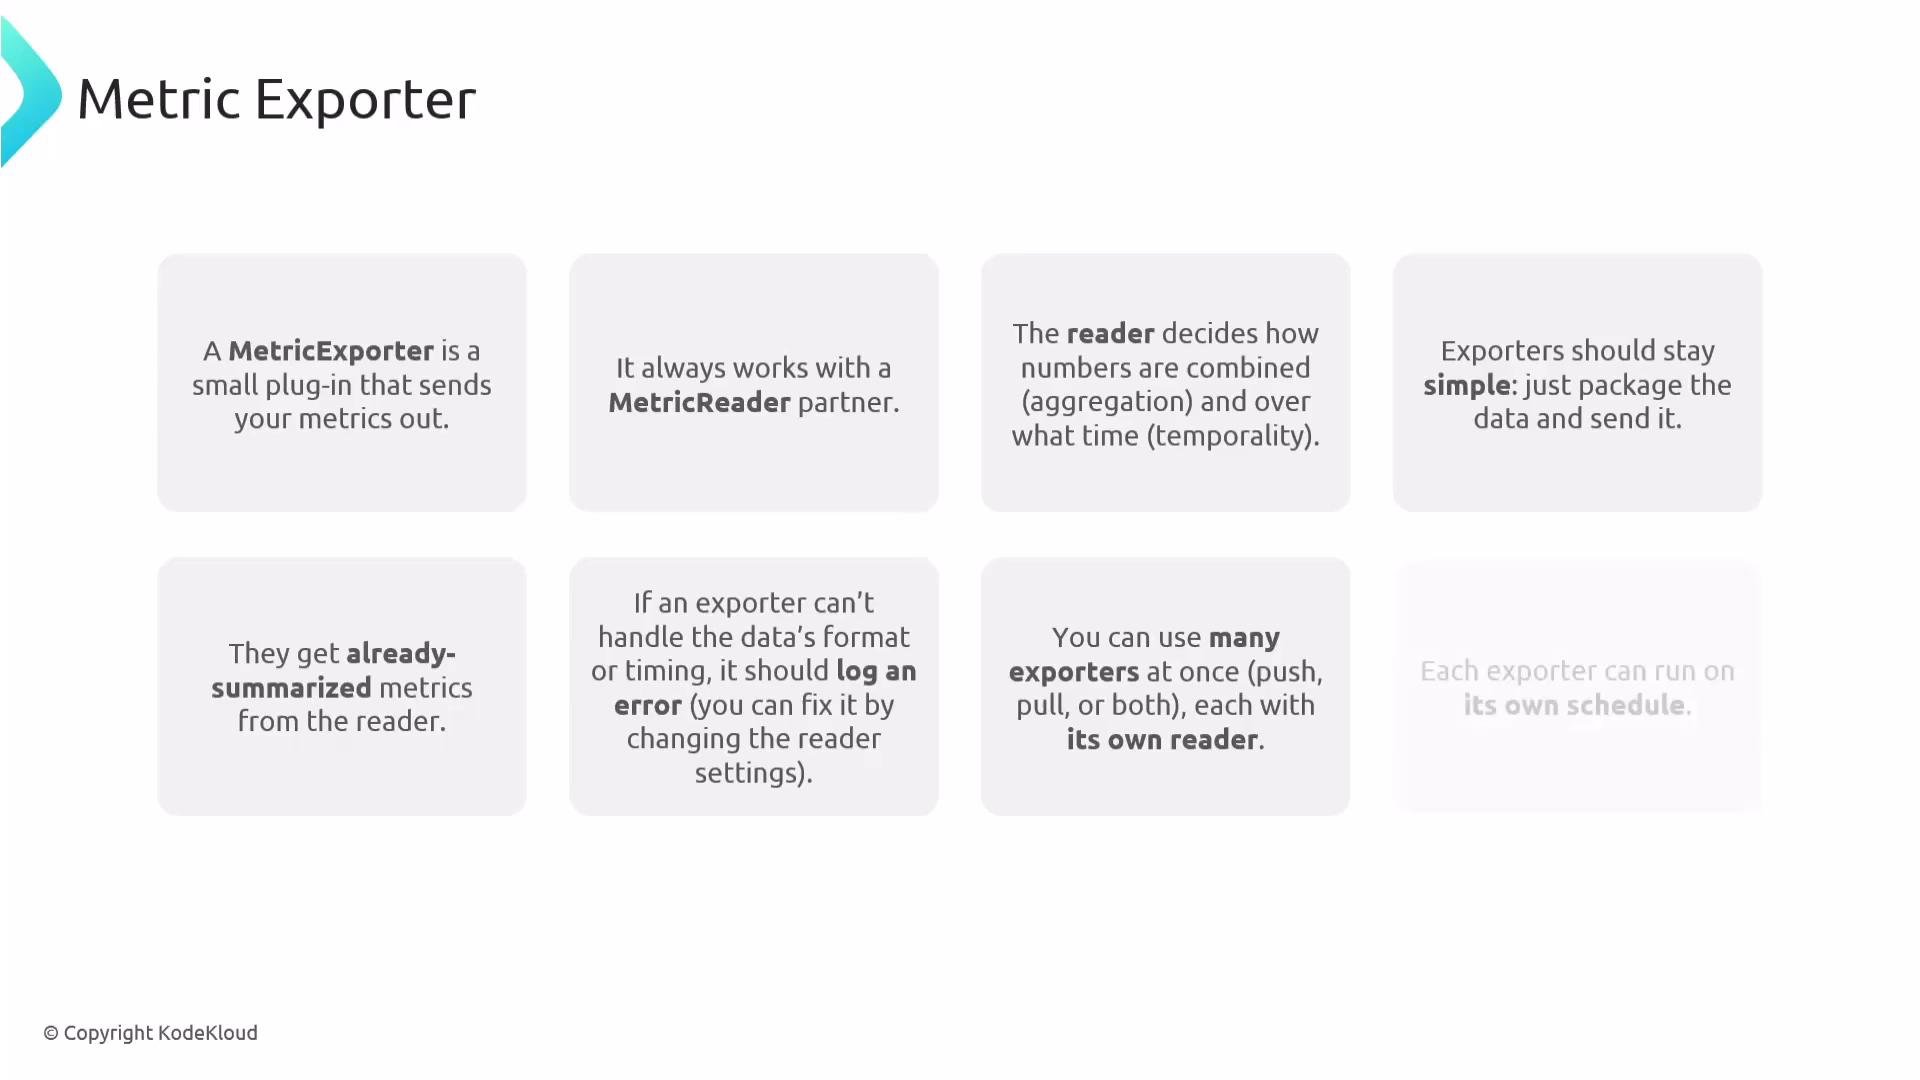
- MetricReaders decide when and how to collect metrics (periodic, on-demand) and perform aggregation and temporality.
- MetricExporters remain agnostic of aggregation logic; they receive the reader’s summarized metrics and transmit them.
- This separation makes SDKs flexible: you can attach multiple exporters (push and/or pull) to a MeterProvider, each with its own reader configuration.
Push-based exporters
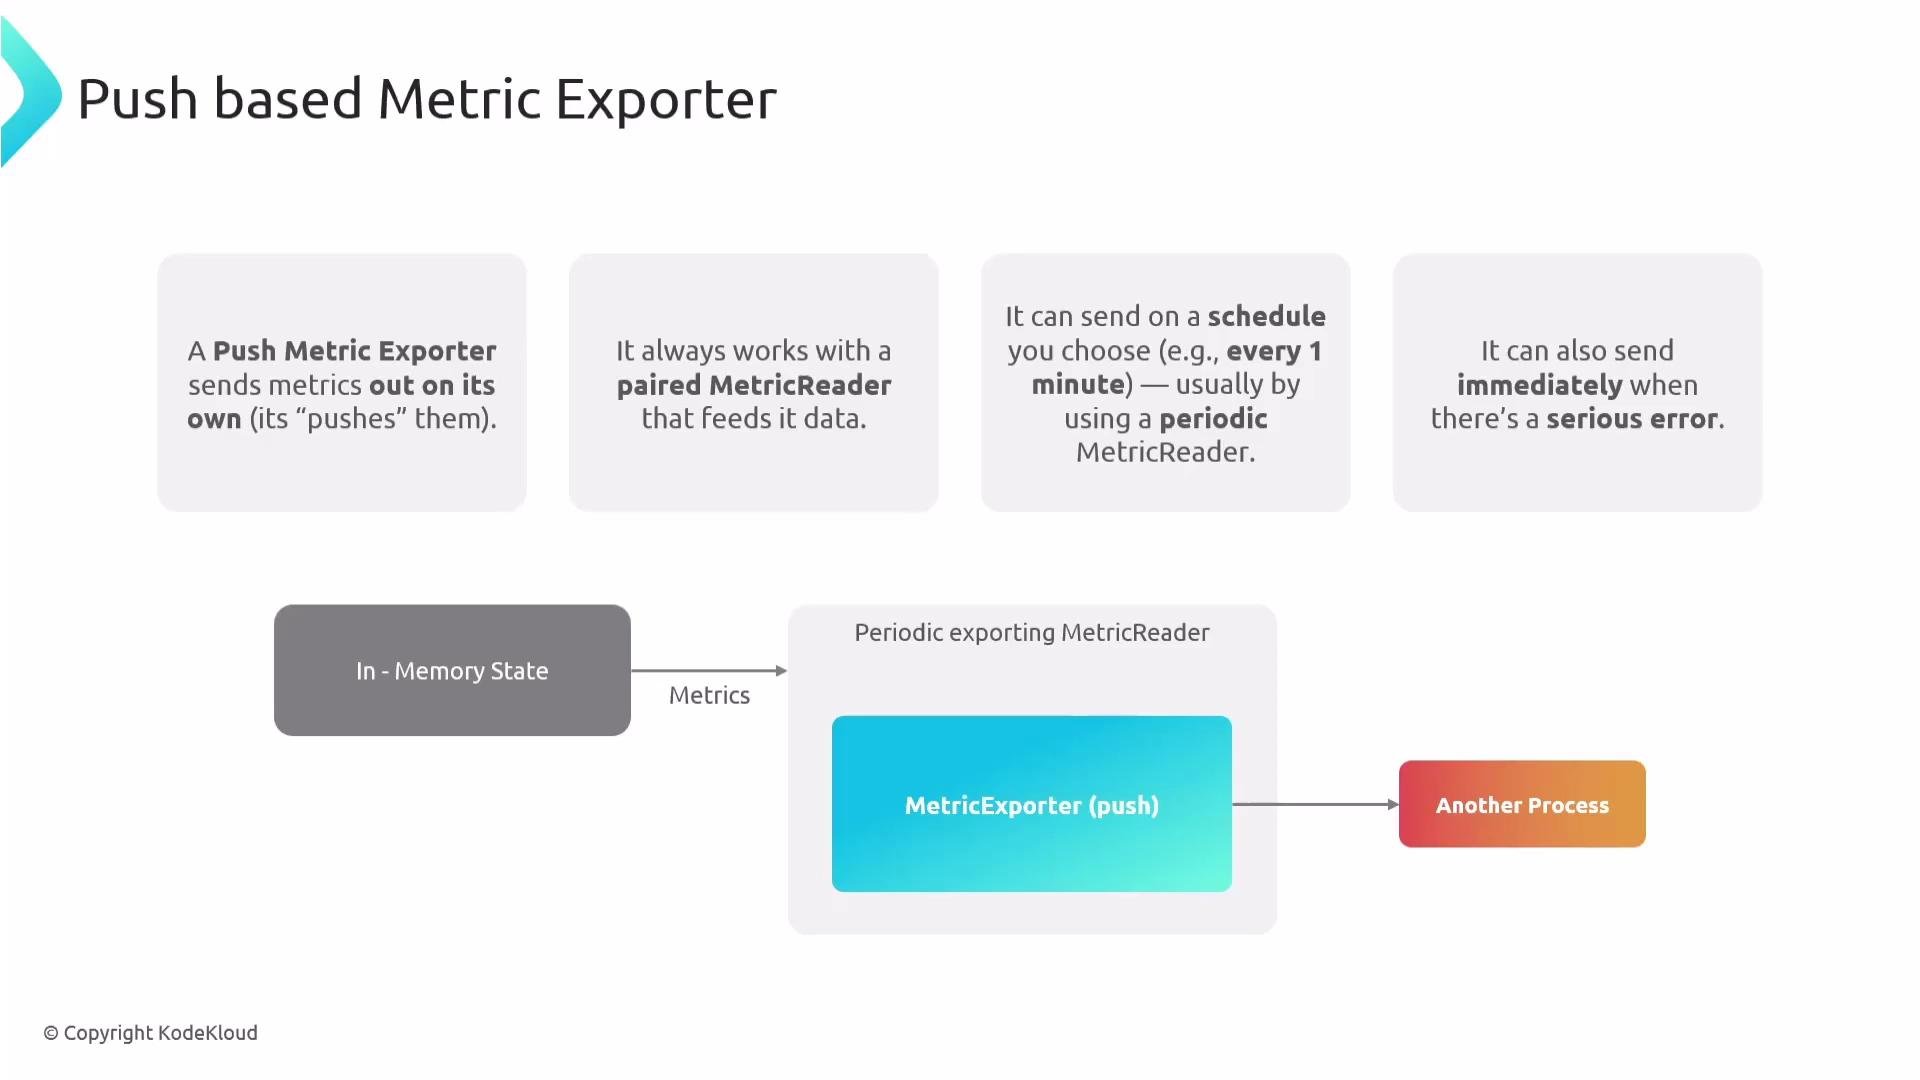
In push workflows, a MetricReader controls collection cadence (for example, periodic polling). The reader collects and aggregates the in-memory metrics, then calls the exporter to transmit that summarized data to its destination. Push exporters can also be triggered by immediate requests such as
ForceFlush or direct application signals (for example, when an application logs a critical incident and requests an immediate export).
Typical push flow:
- Instrument data is recorded in in-memory state.
- MetricReader collects and summarizes those metrics from the SDK.
- MetricExporter packages and sends the summarized metrics to an external process (collector or backend).
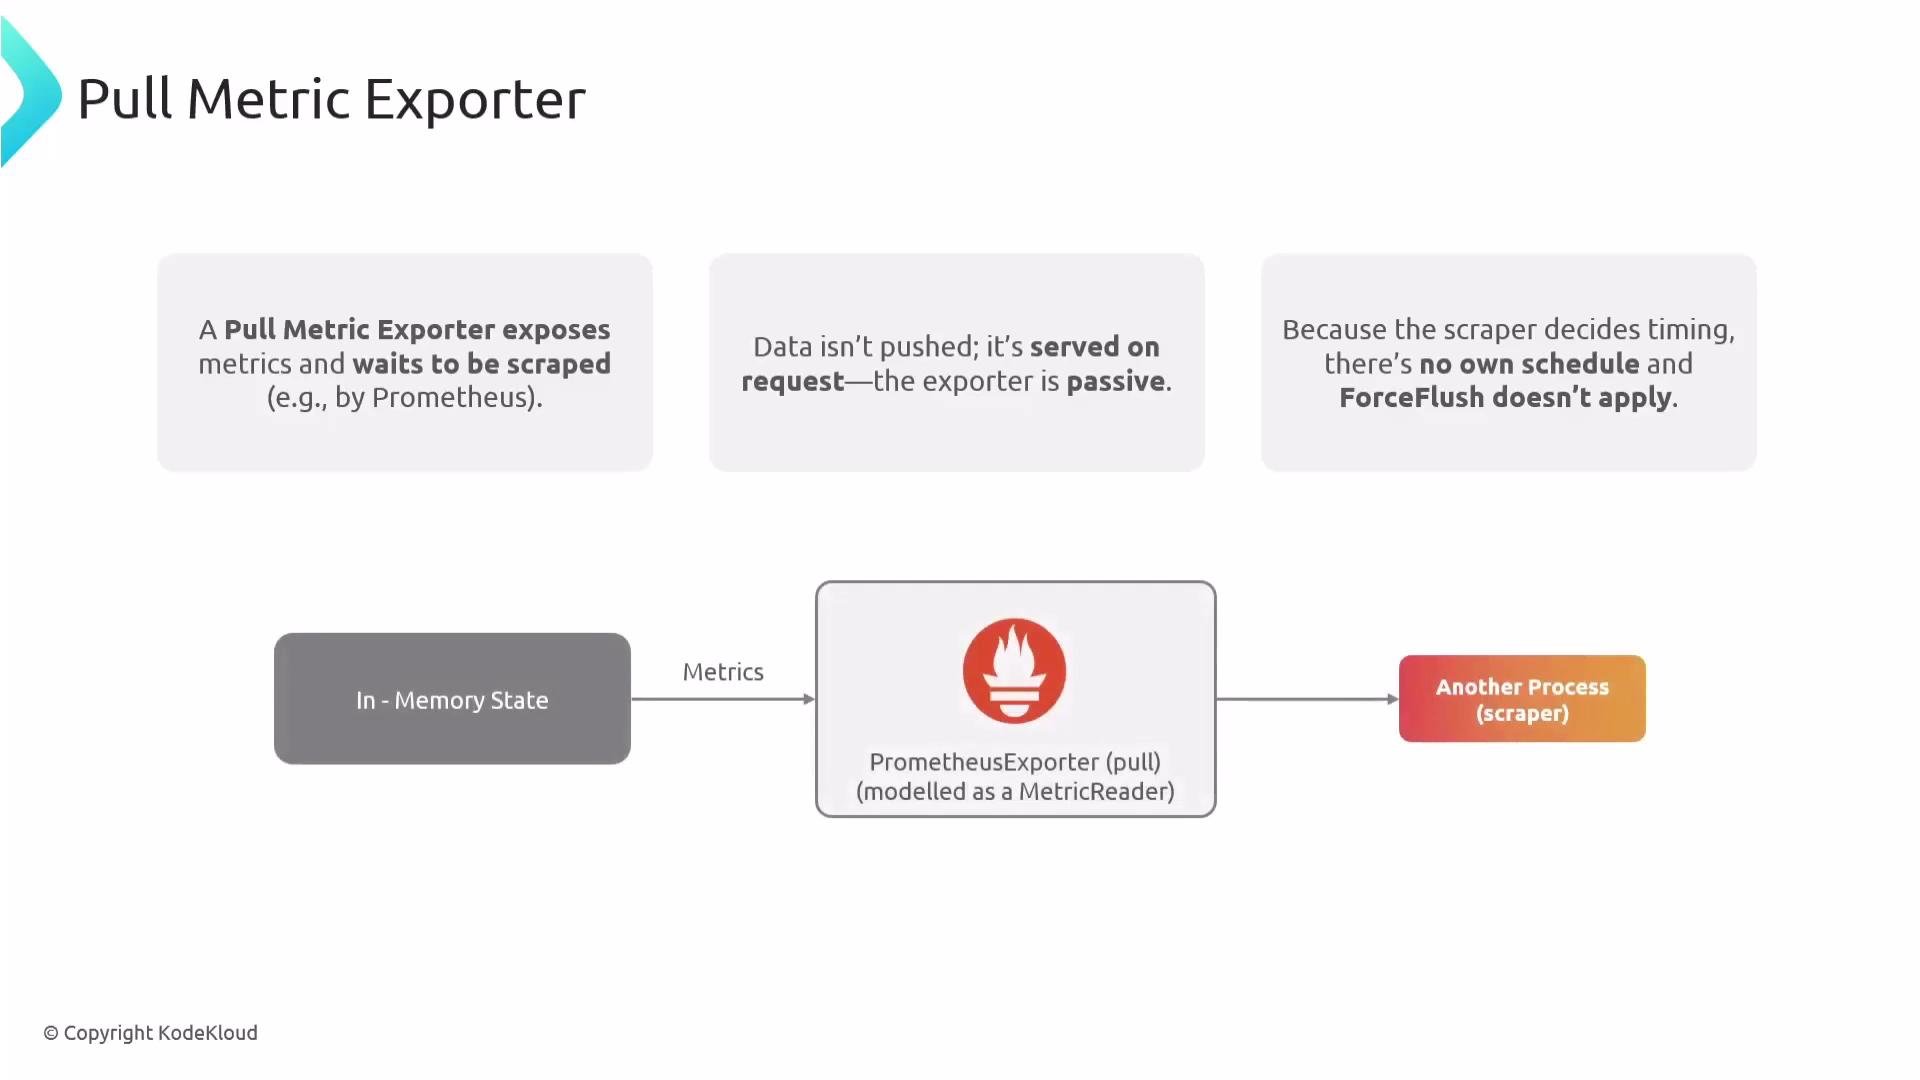
- Instrument data remains in in-memory state.
- The pull exporter exposes summarized data on an endpoint.
- An external scraper periodically requests (scrapes) the endpoint and forwards metrics to the backend.
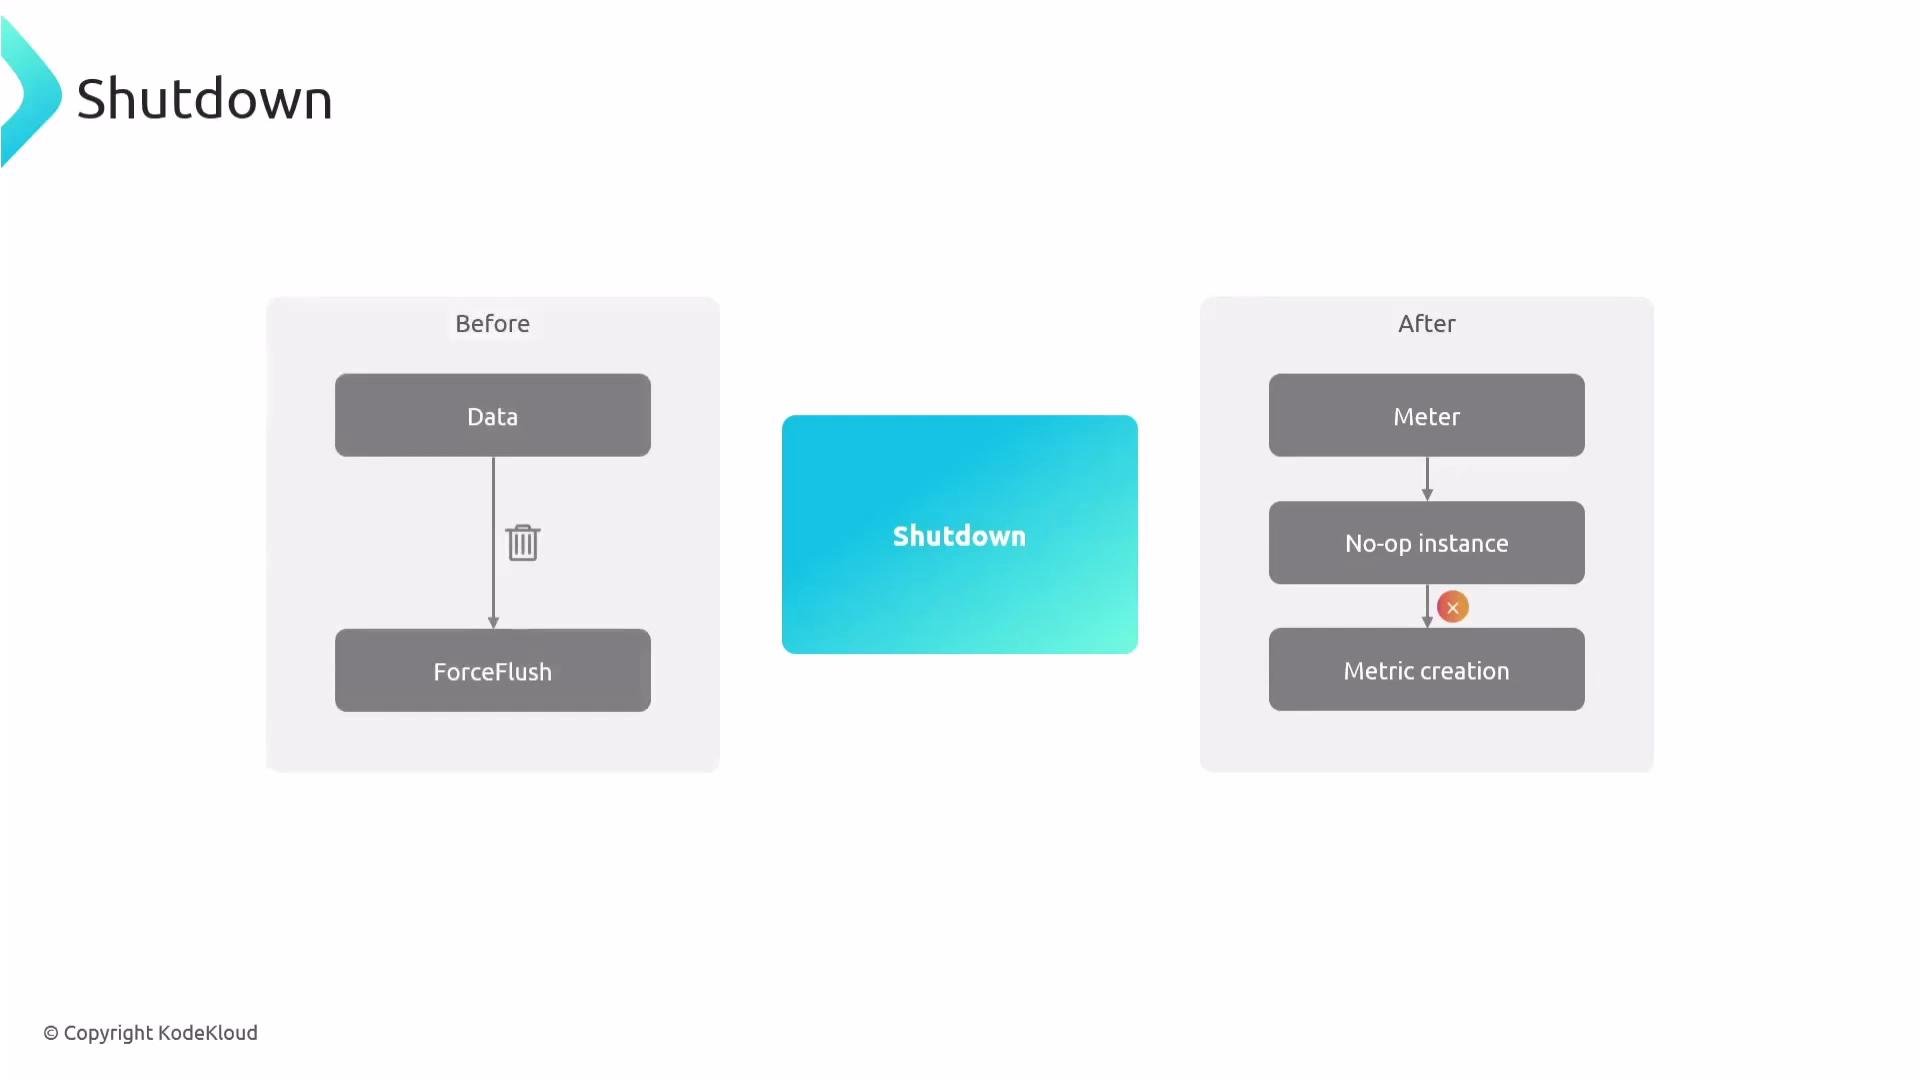
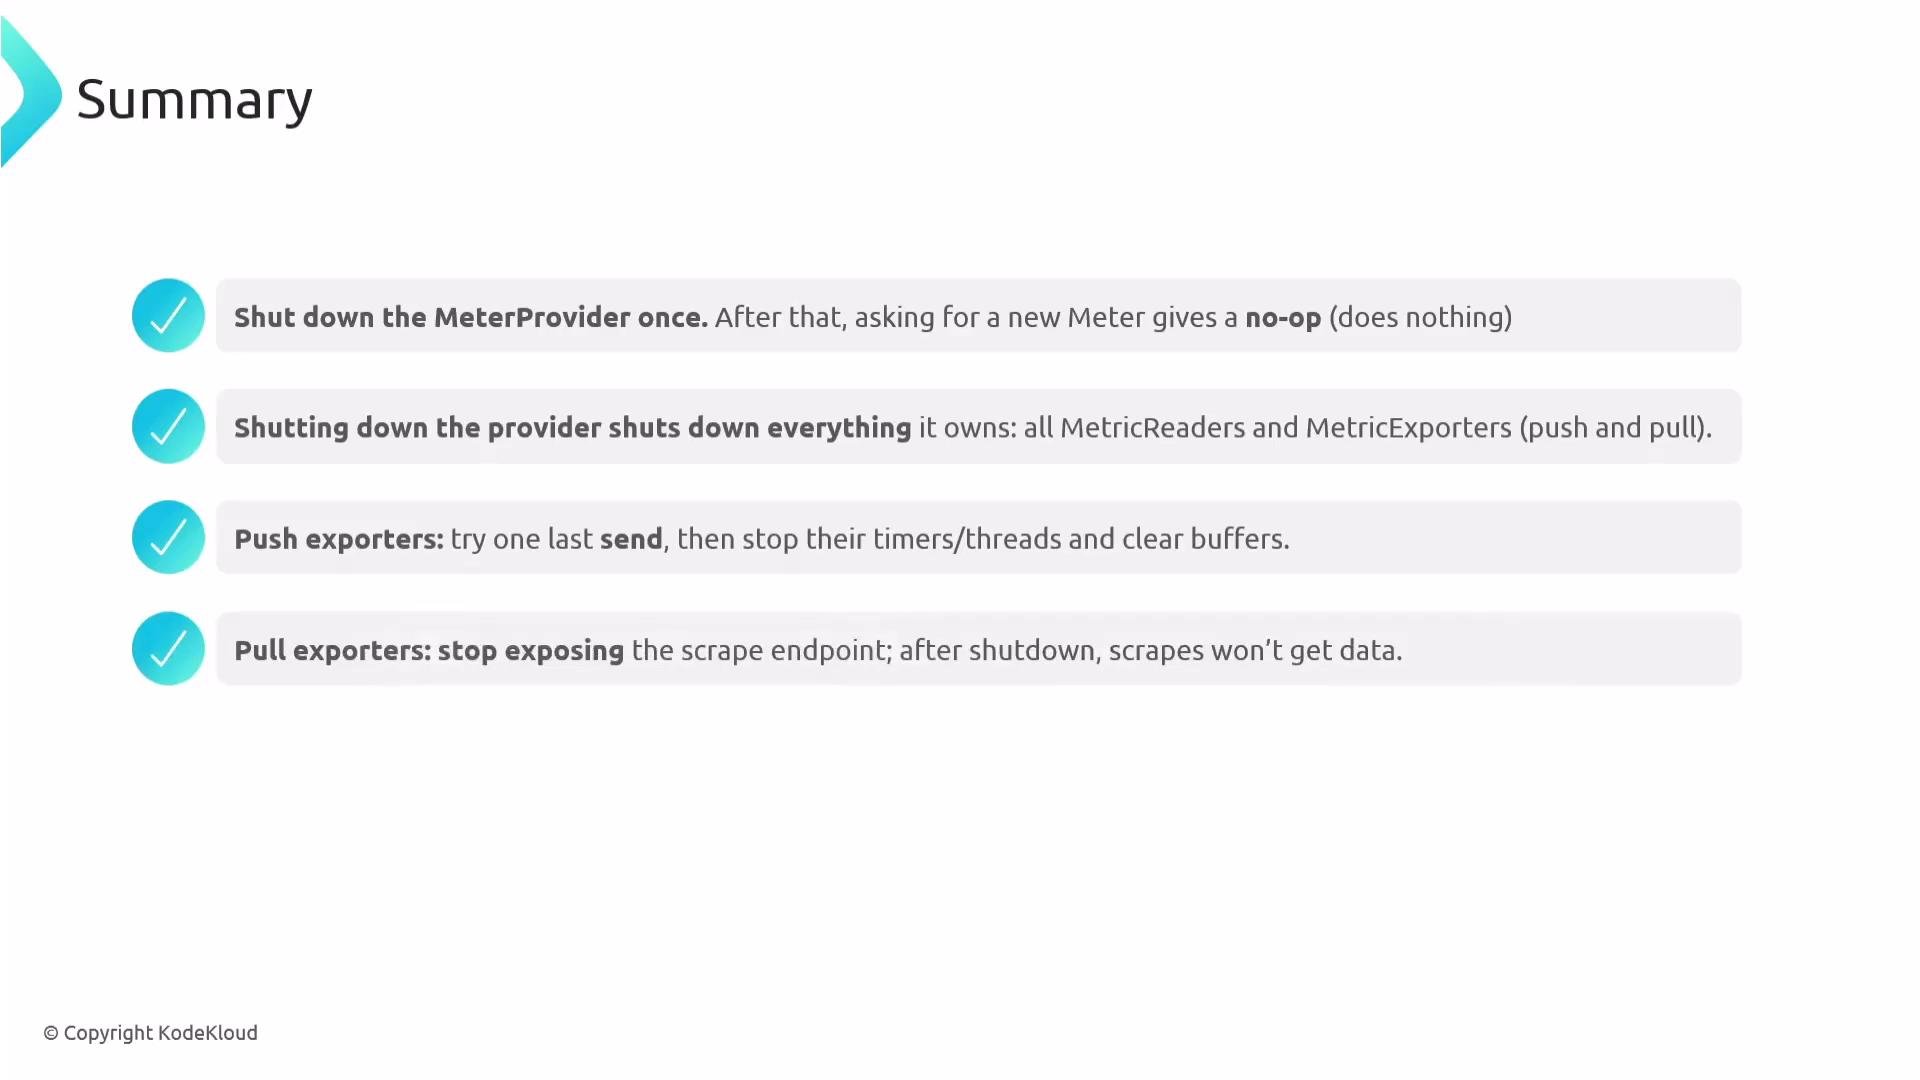
Shutdownis the termination API on the MeterProvider. It should be called exactly once to perform cleanup and to stop metric processing.- On shutdown the provider should cascade the
shutdowncall to all registered MetricReaders and MetricExporters. - SDKs may block synchronously up to a timeout and should report whether shutdown succeeded, failed, or timed out.
- After shutdown, the provider should refuse to create functional meters. Returning no-op meters is preferred so the application can keep running while preventing new metrics from being recorded.
ForceFlushasks push-based MetricReaders (and, transitively, their exporters) to immediately collect and export any buffered metrics.- It is intended for push-based workflows where you want to ensure buffered metrics are delivered before shutdown or at critical moments.
- Pull exporters (scrape-based) are unaffected by
ForceFlush; they only expose metrics in response to scrapes. For scrape-based setups, ensure the external scraper performs a final scrape if you need the last metrics exported.
ForceFlush is intended for push-based workflows (e.g., ensuring buffered metrics are sent before shutdown). For scrape-based setups (Prometheus), ensure the scraper scrapes the endpoint at least once before shutdown if you need the final data exported.
- Call
Shutdownon the MeterProvider once to terminate metric processing cleanly and cascade cleanup to all MetricReaders and MetricExporters. - After shutdown, the provider should return no-op meters to prevent further metric creation while allowing the app to continue running.
- Push exporters:
- Attempt to
ForceFlushany pending data during shutdown. - Stop timers/background threads, clear buffers, and release resources.
- Attempt to
- Pull exporters:
- Stop exposing the scrape endpoint so subsequent scrapes return no data.
- Document how consumers should perform a final scrape if they require last-minute metrics.
- Provide explicit feedback about shutdown outcome (success, failure, timeout) to orchestration or monitoring systems.
- OpenTelemetry Metrics: https://opentelemetry.io/docs/ (see Metrics SDK and exporter guidelines)
- Prometheus documentation: https://prometheus.io/docs/
ForceFlush, and Shutdown semantics, including best practices for ensuring final metrics are reliably exported.