

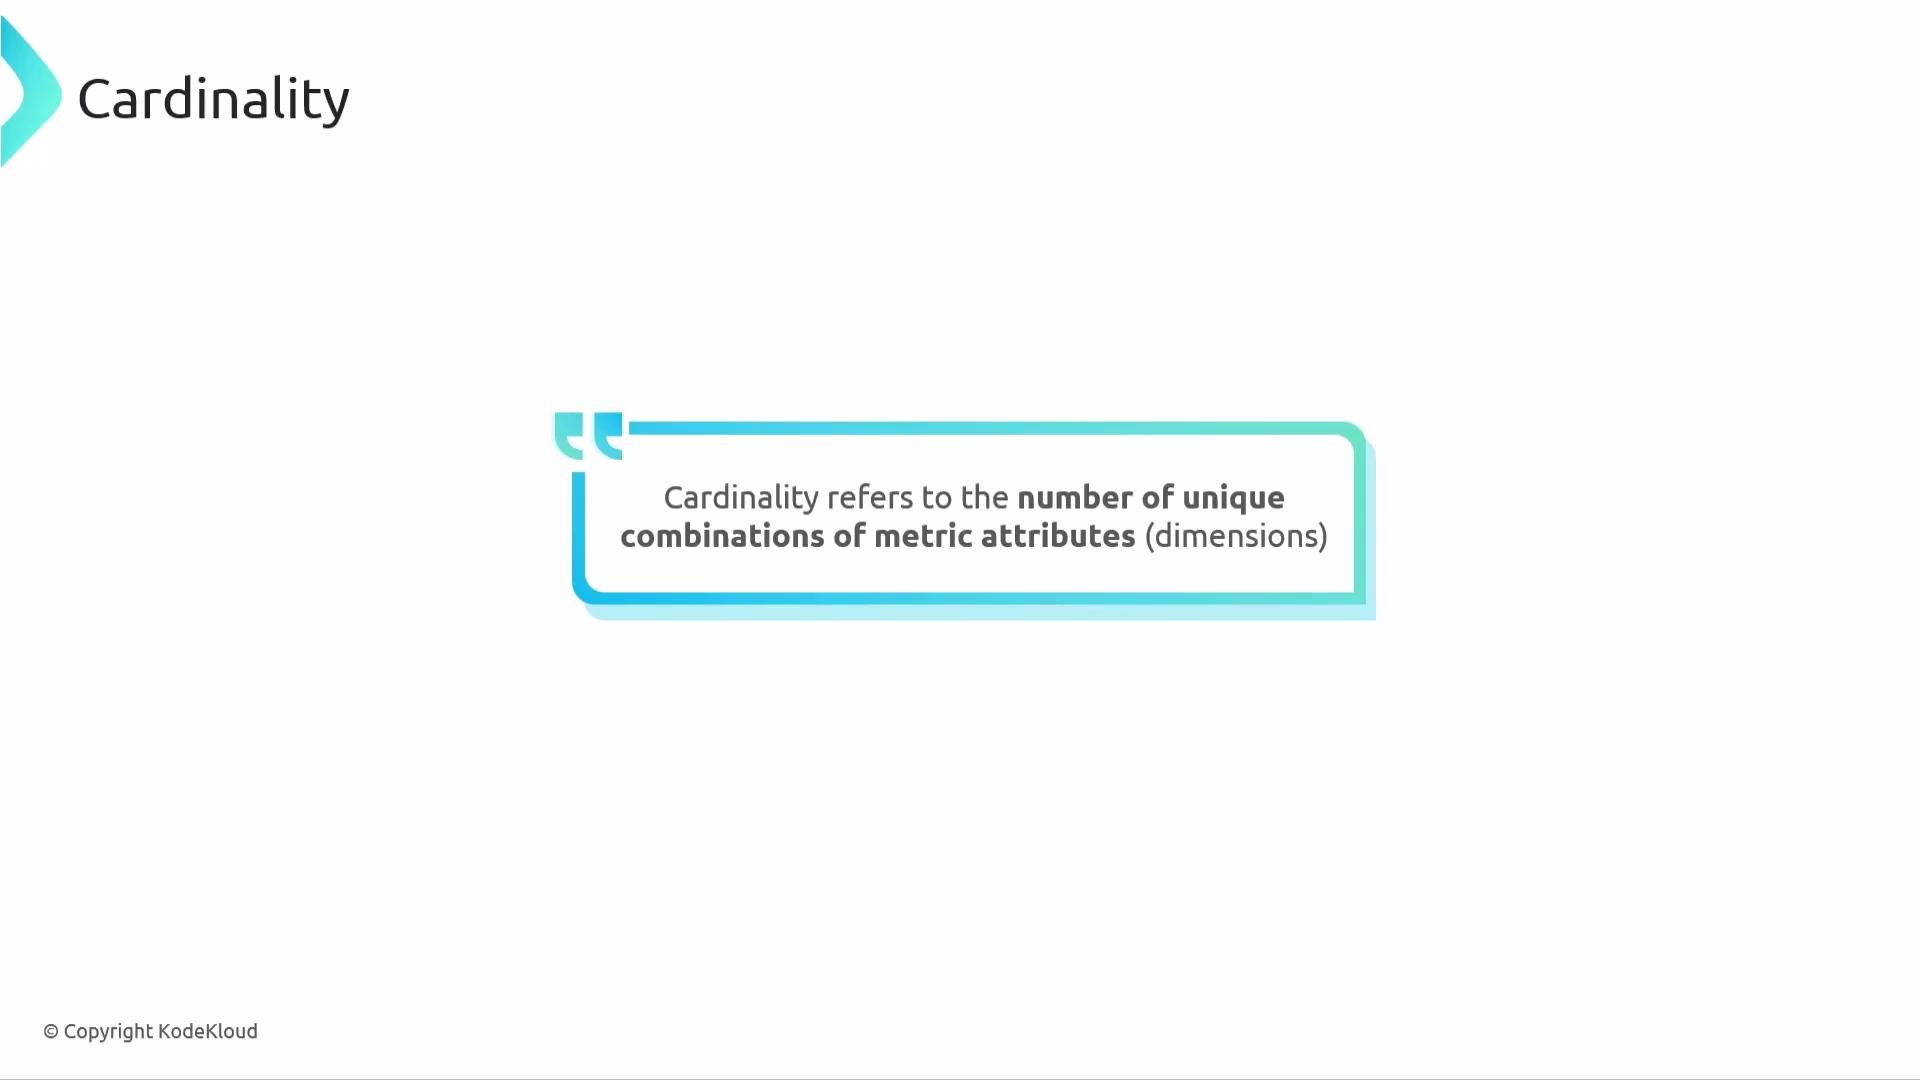
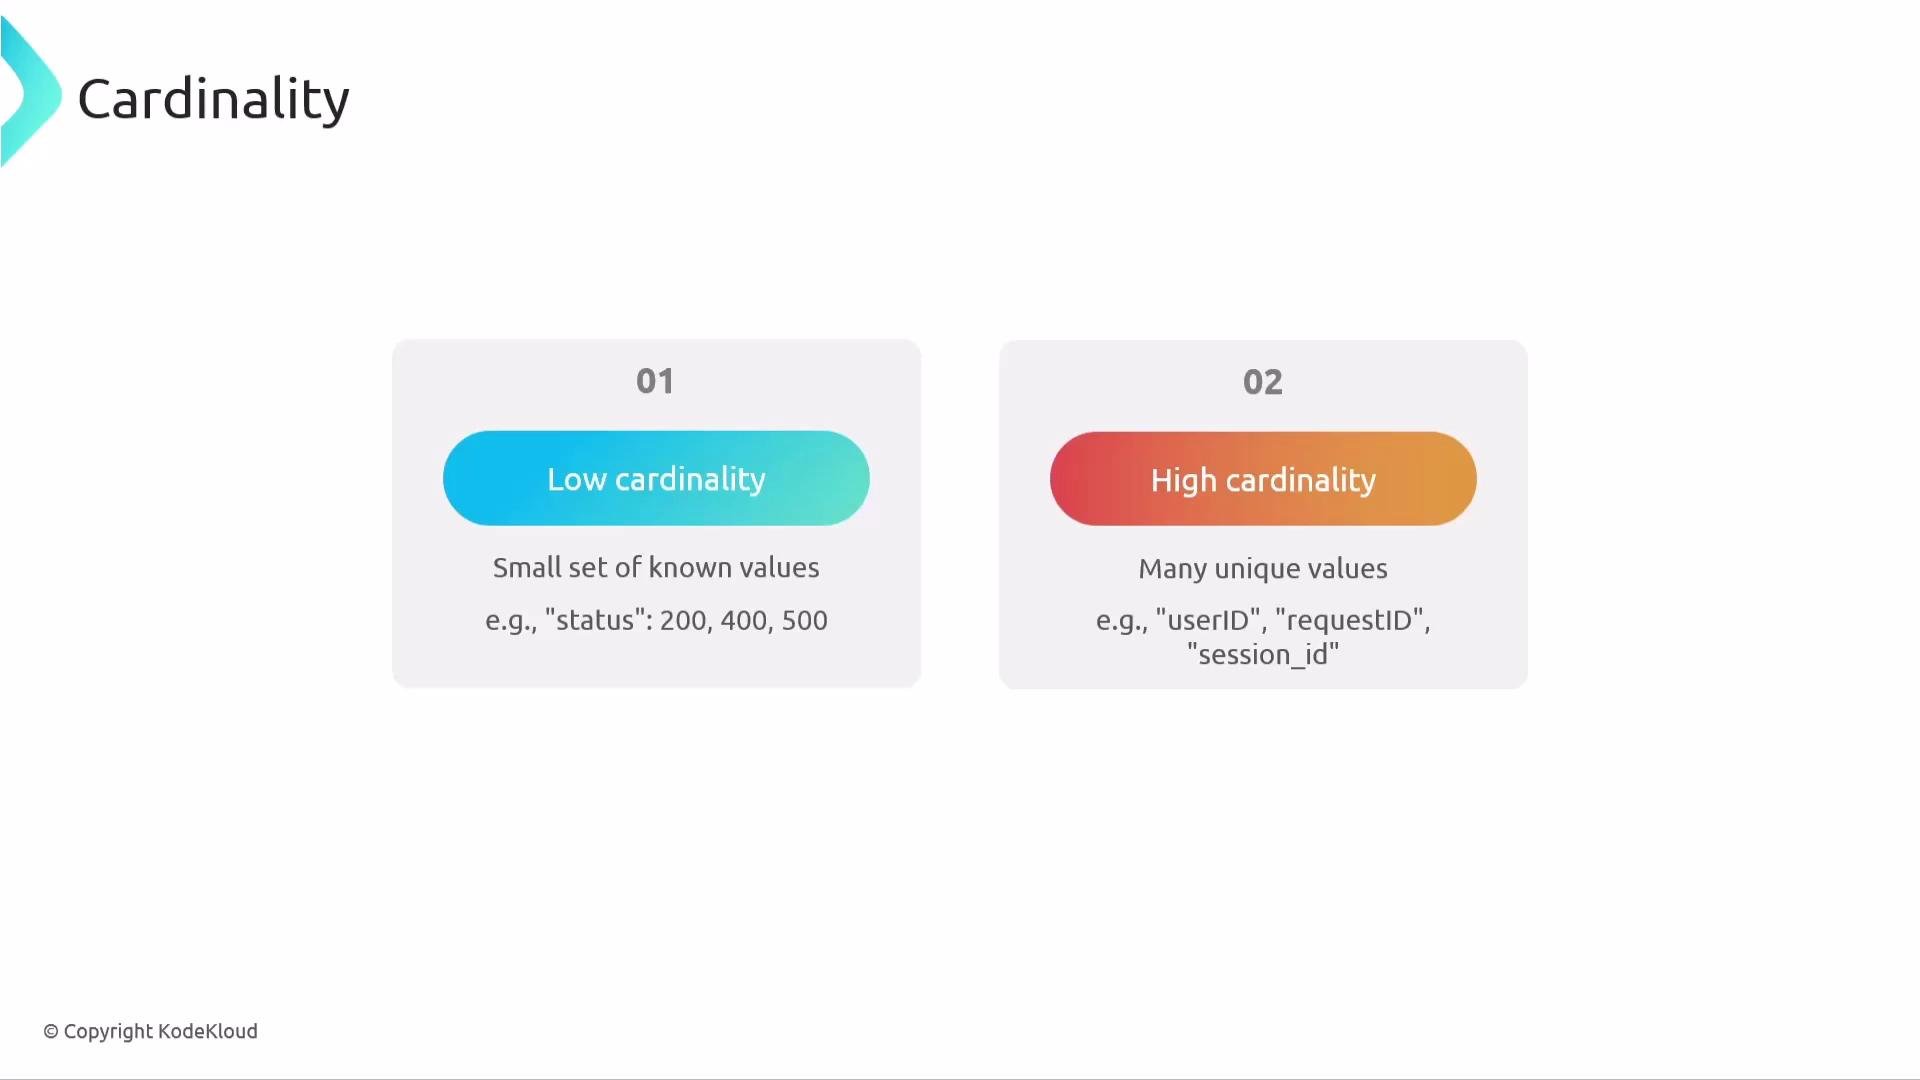
Cardinality levels (quick summary)
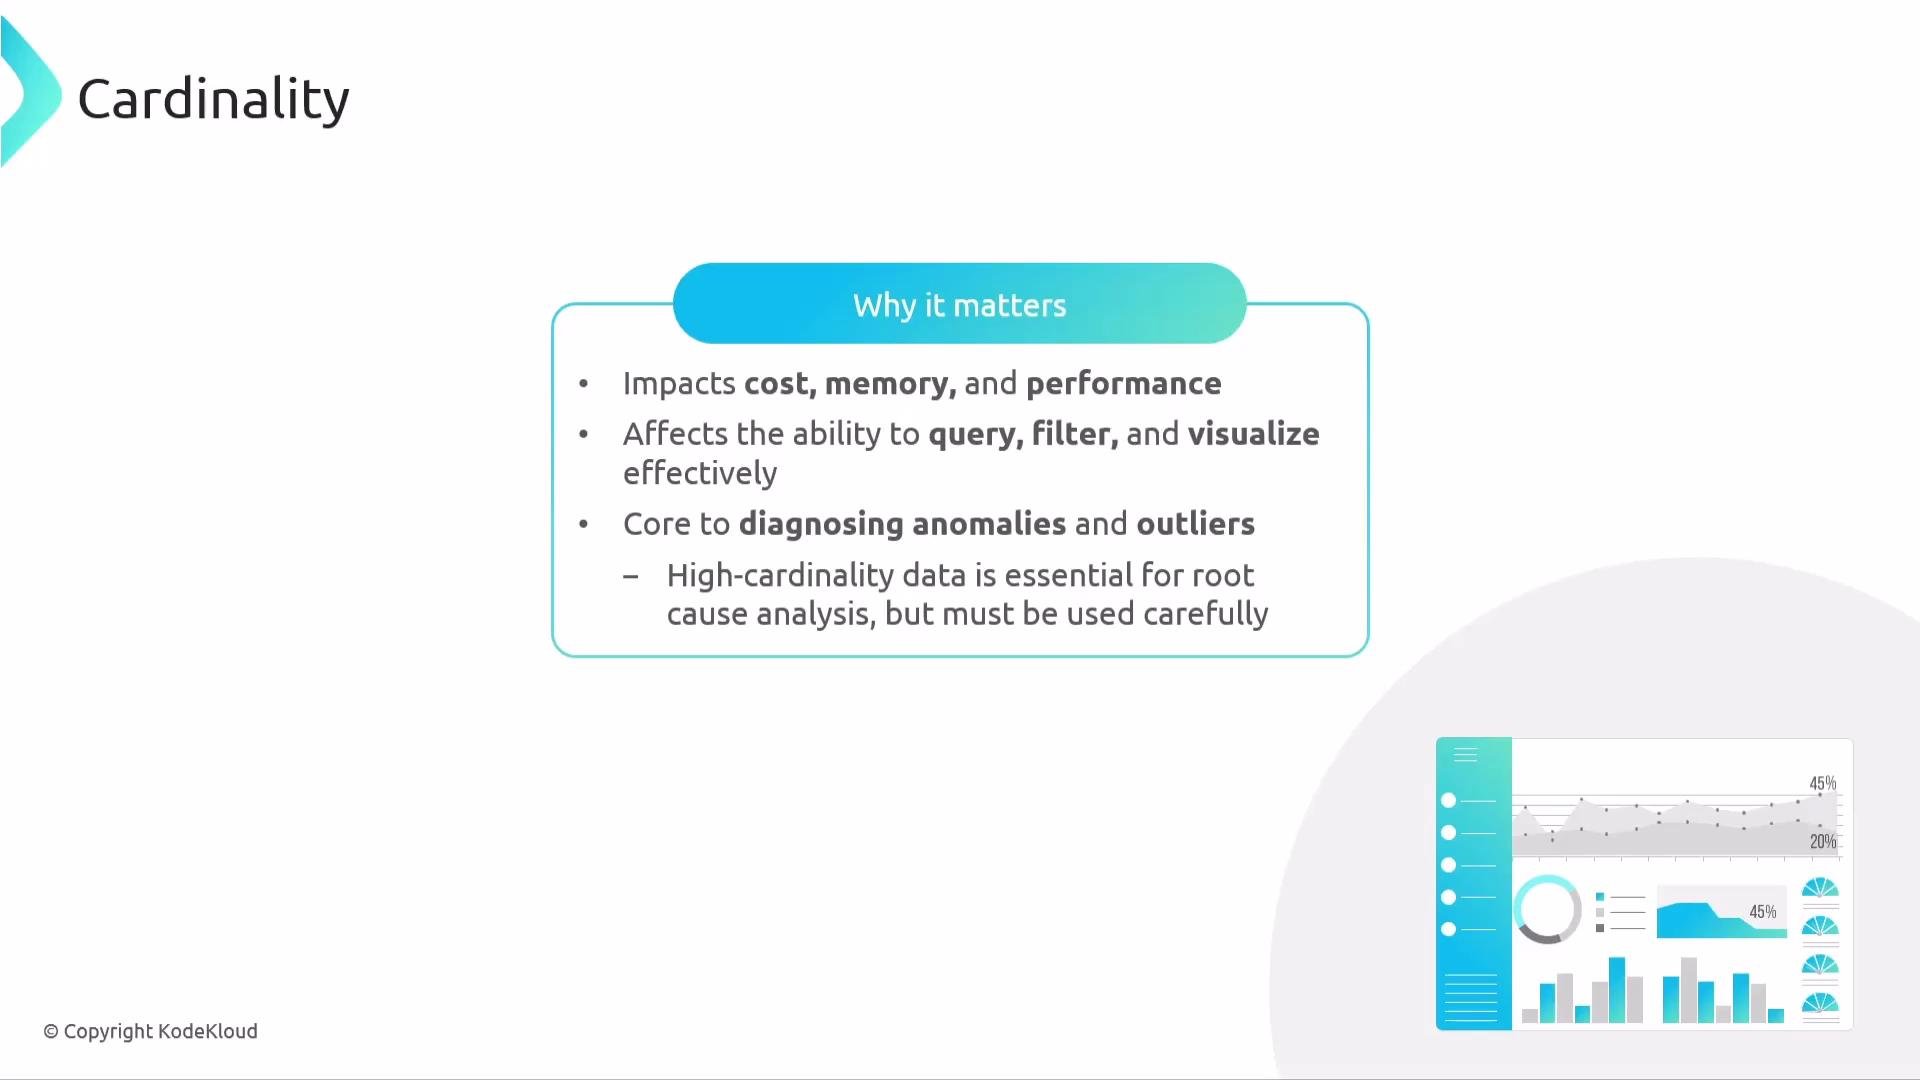
Why cardinality matters
Cardinality affects cost, memory, query time, and dashboard responsiveness. Each unique combination of labels typically becomes a separate metric series:- Low-cardinality metrics are cheap to store and fast to query.
- High-cardinality metrics can explode the number of series and increase ingestion and query costs.
- High-cardinality data is invaluable for targeted troubleshooting and identifying outliers, but requires careful design so your observability backend is not overwhelmed.
Example: vehicle telemetry (low → high)
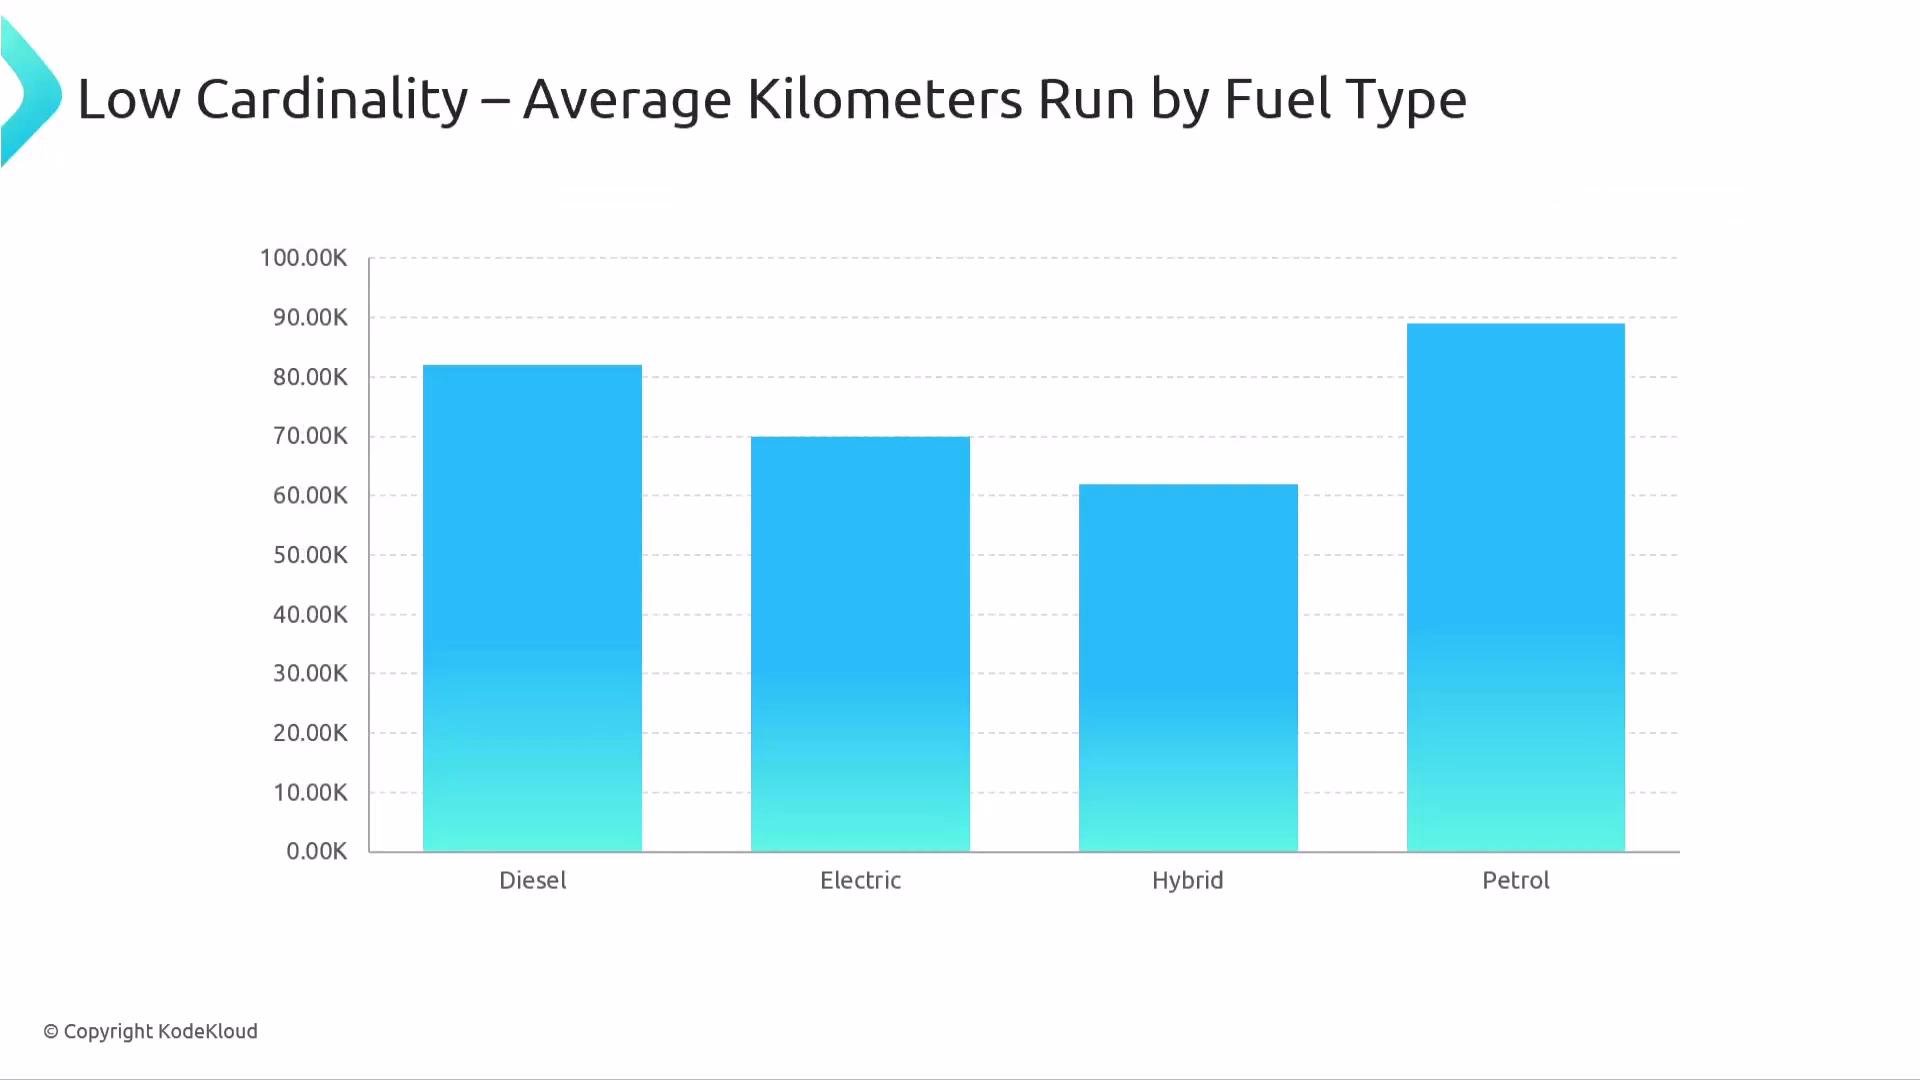
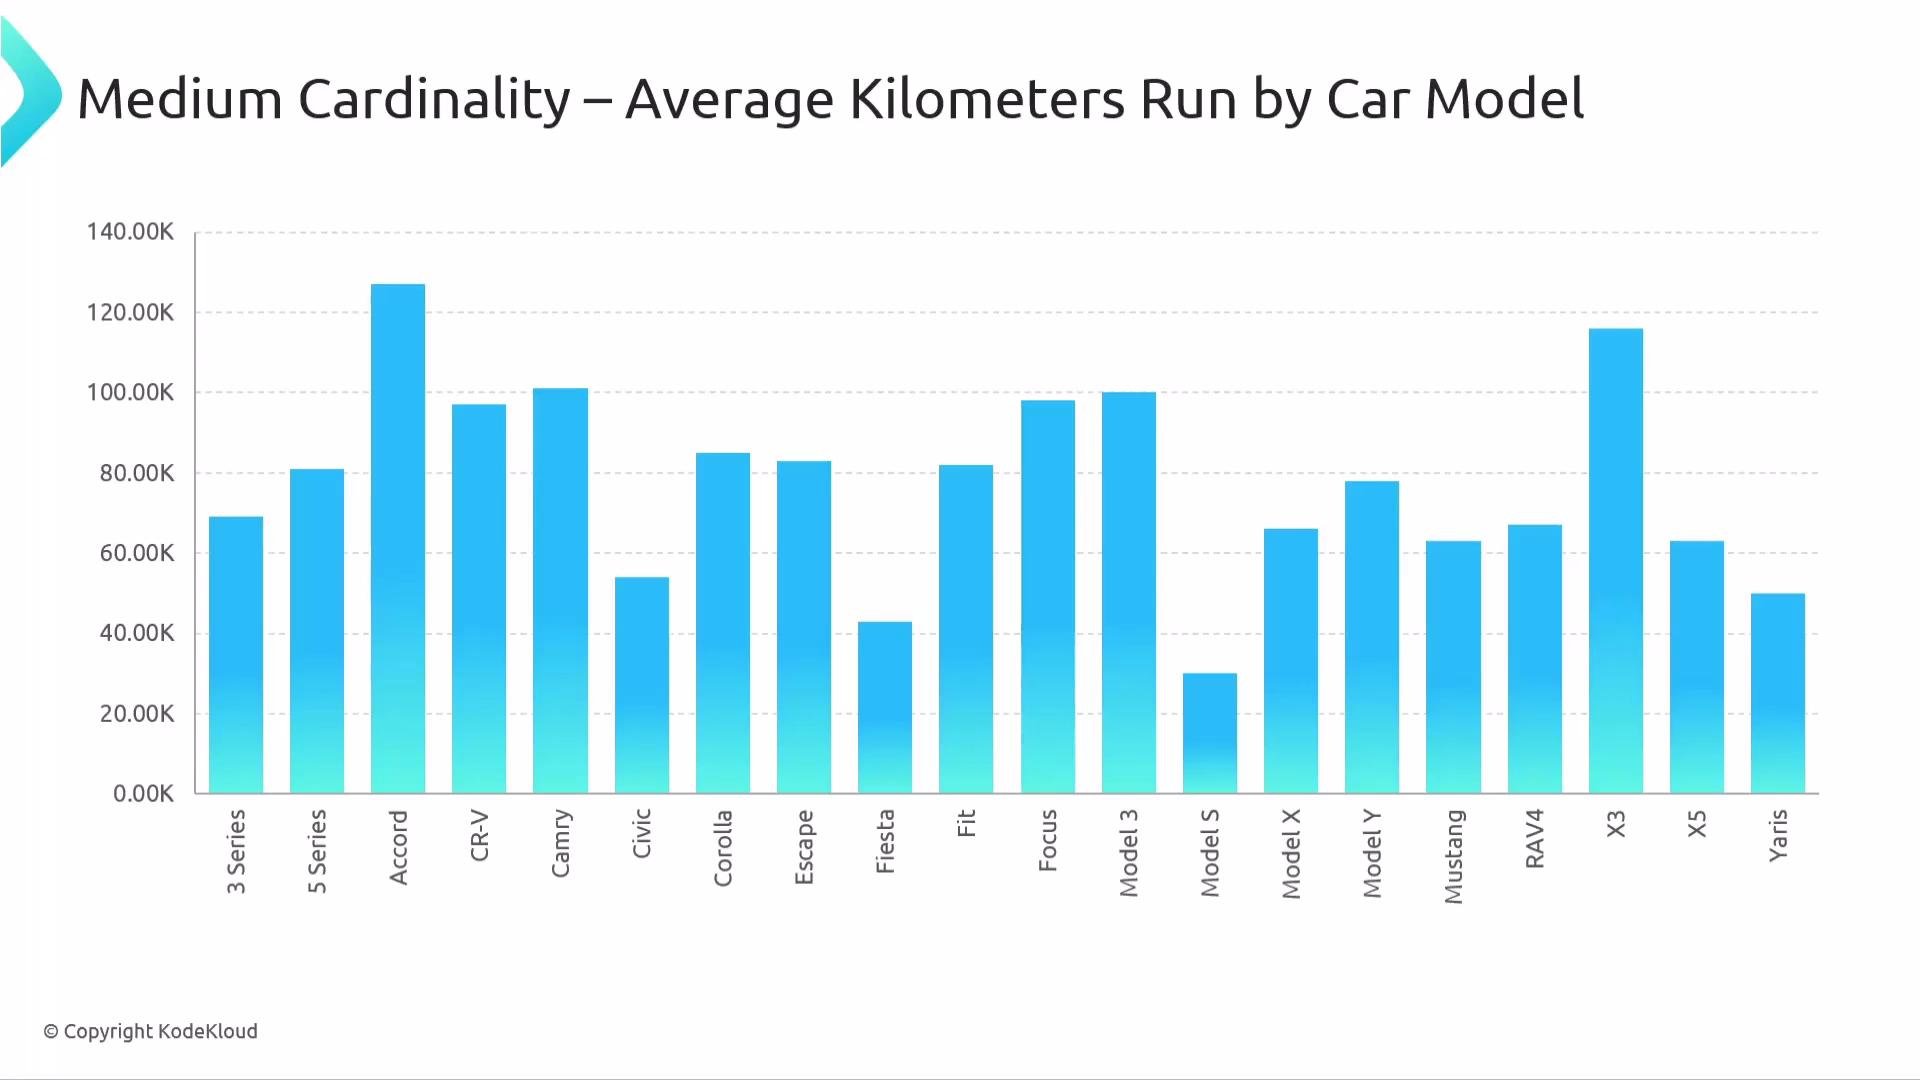
The following JavaScript snippet shows vehicle records where attributes vary in cardinality. This illustrates how different groupings produce different analytical granularity.- Group by
fuel_type(low cardinality) — good for broad, cost-effective insights. - Group by
model(medium cardinality) — reveals more granular trends by model. - Group by
registration(high cardinality) — inspects specific vehicles (one point per entity).
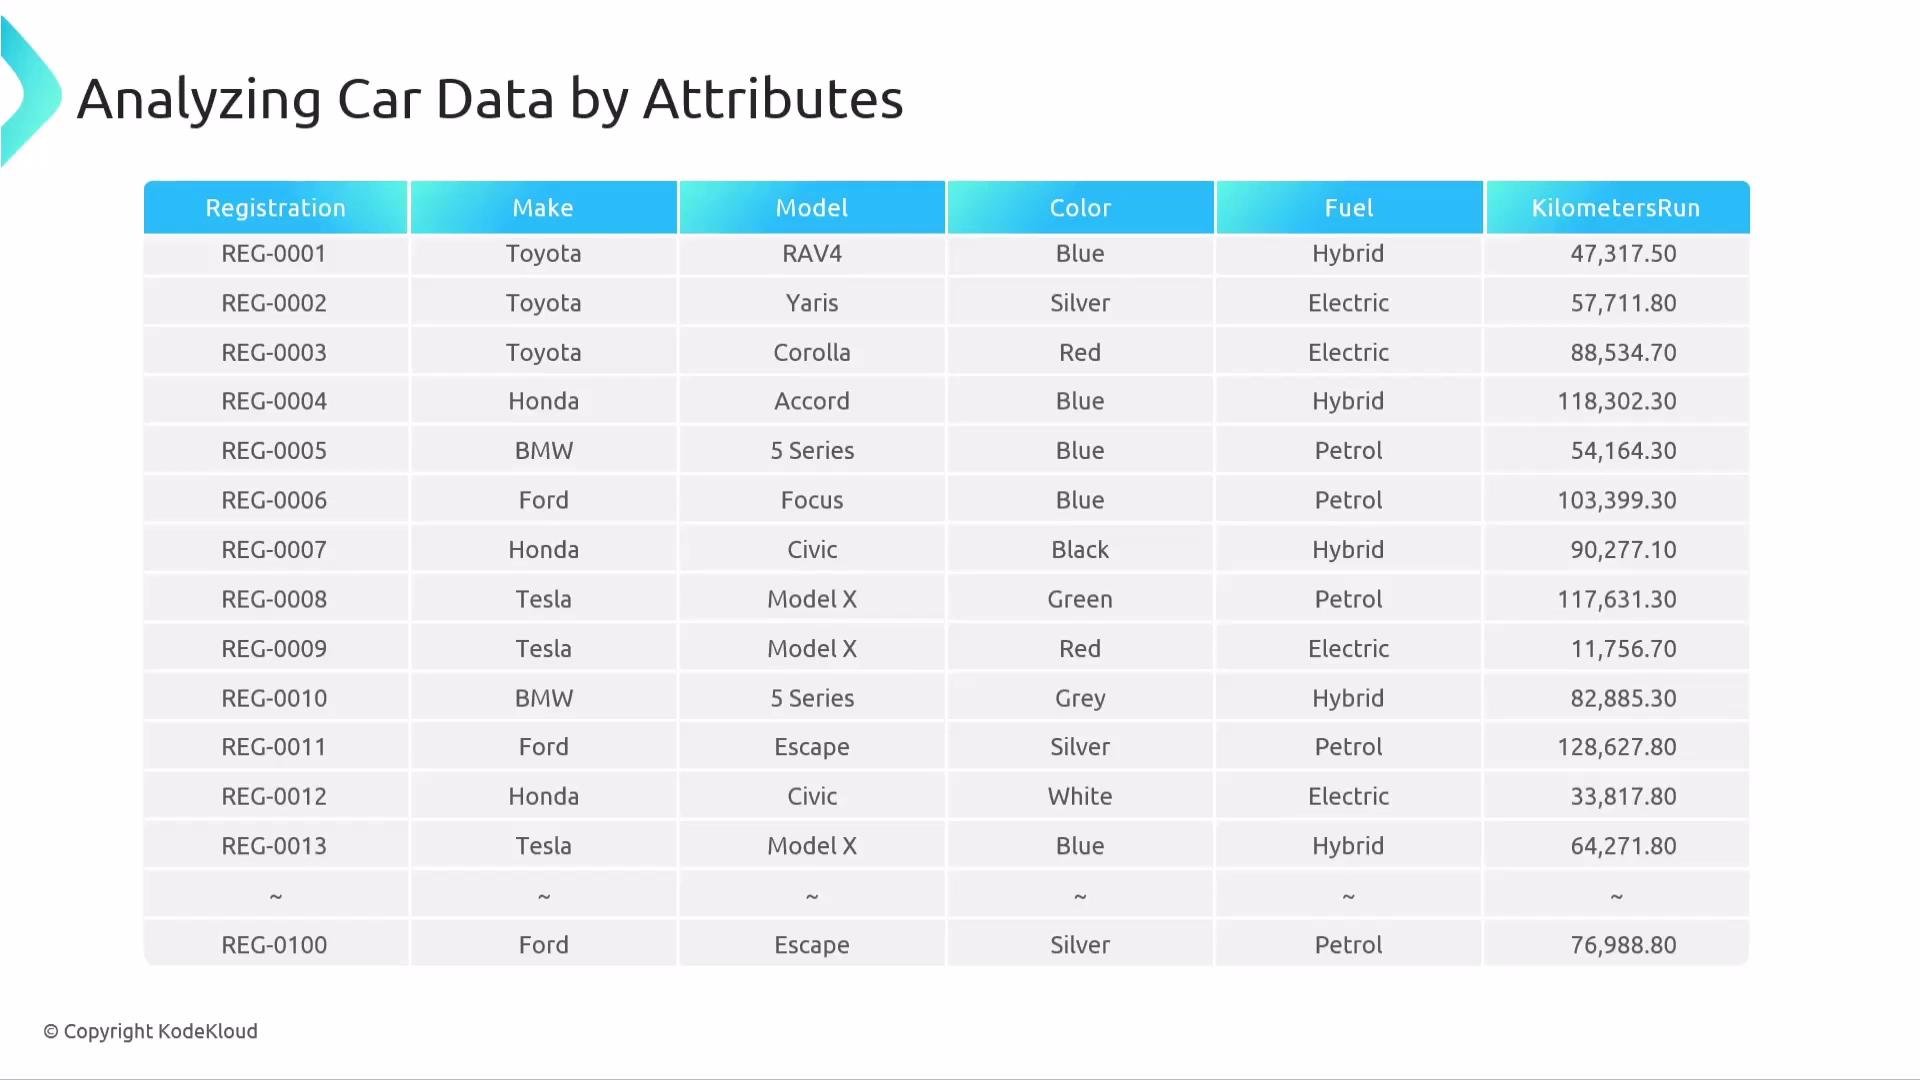
registration (per-vehicle) is high cardinality and useful when you must pinpoint an exact entity.
Real-world example: e-commerce
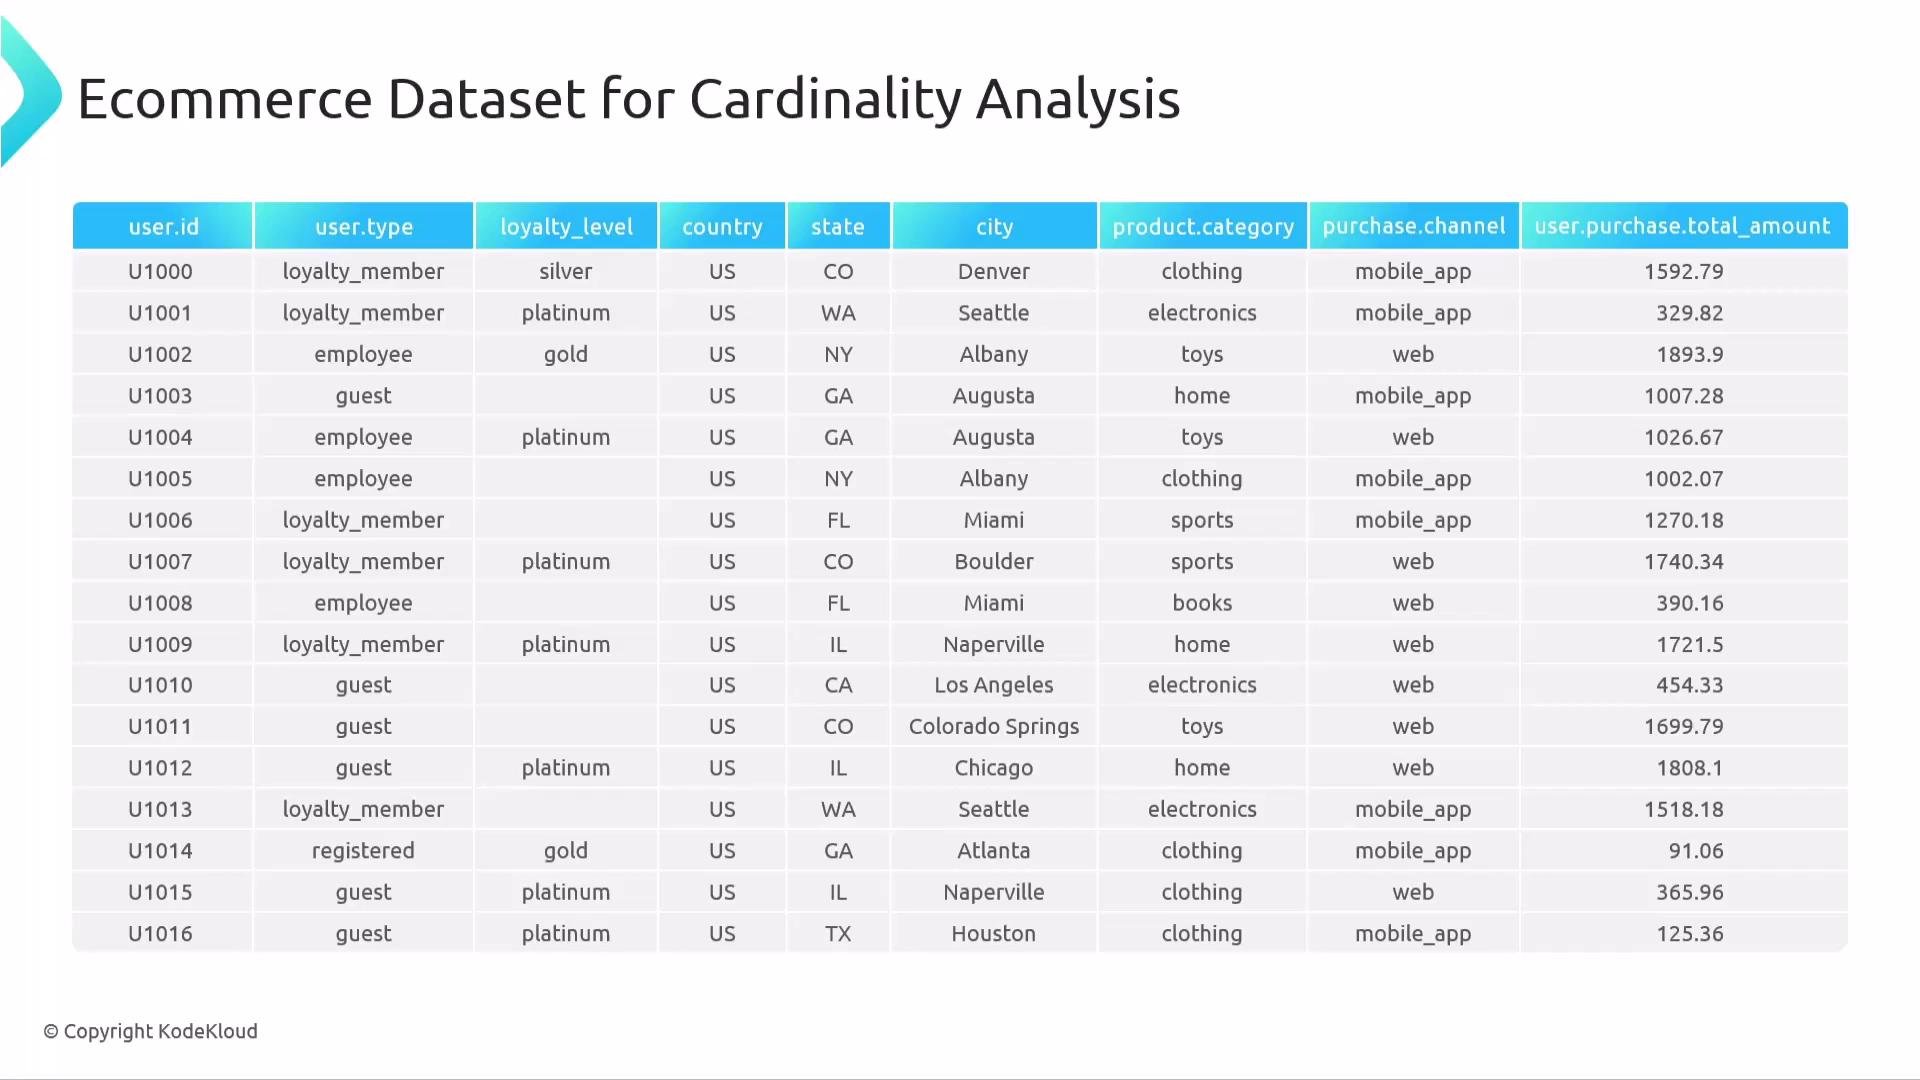
In e-commerce, datasets might includeuser_id, loyalty_tier, country, city, product_category, purchase_channel, and total_spend. Choose grouping keys based on the analysis you need:
- Group by
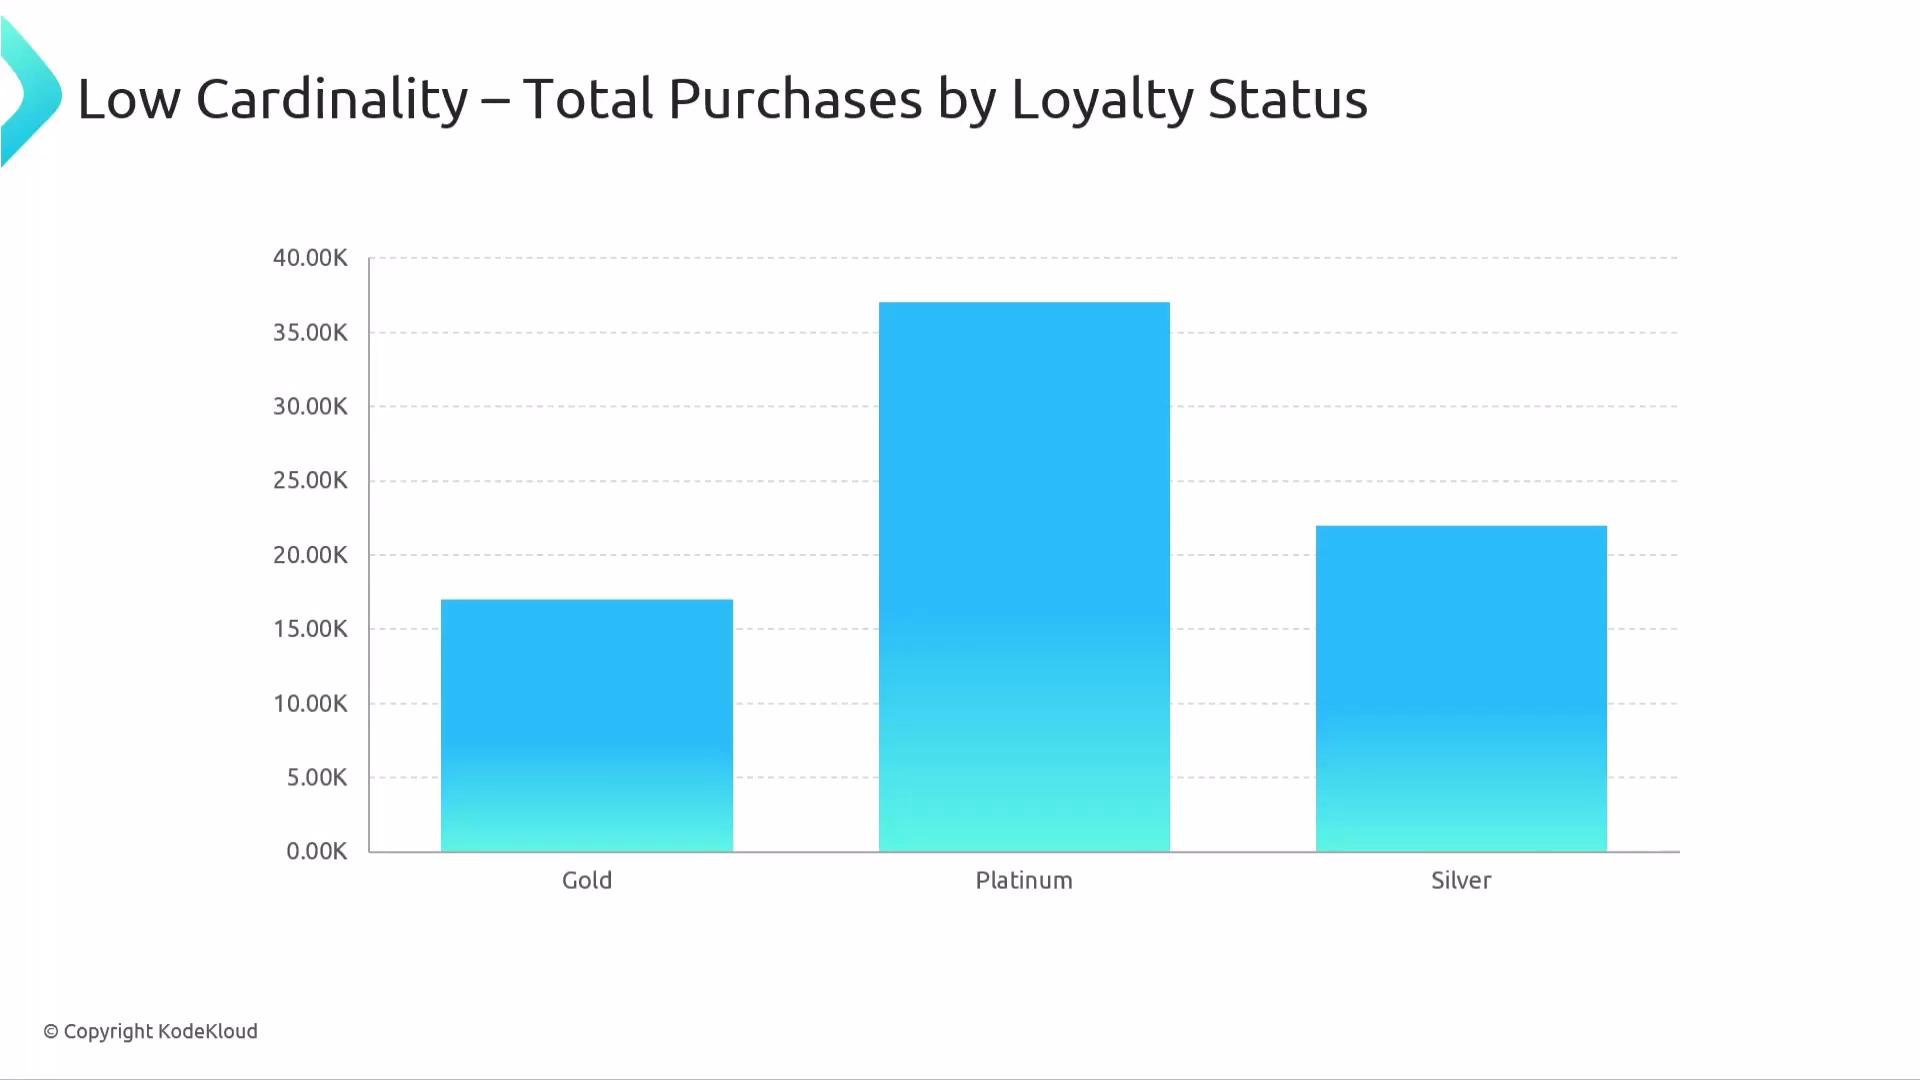
loyalty_tier(low cardinality) to view overall trends quickly:
- Group by
city(medium cardinality) for regional insights. - Group by
user_id(high cardinality) to surface top individual spenders or investigate an individual user issue.
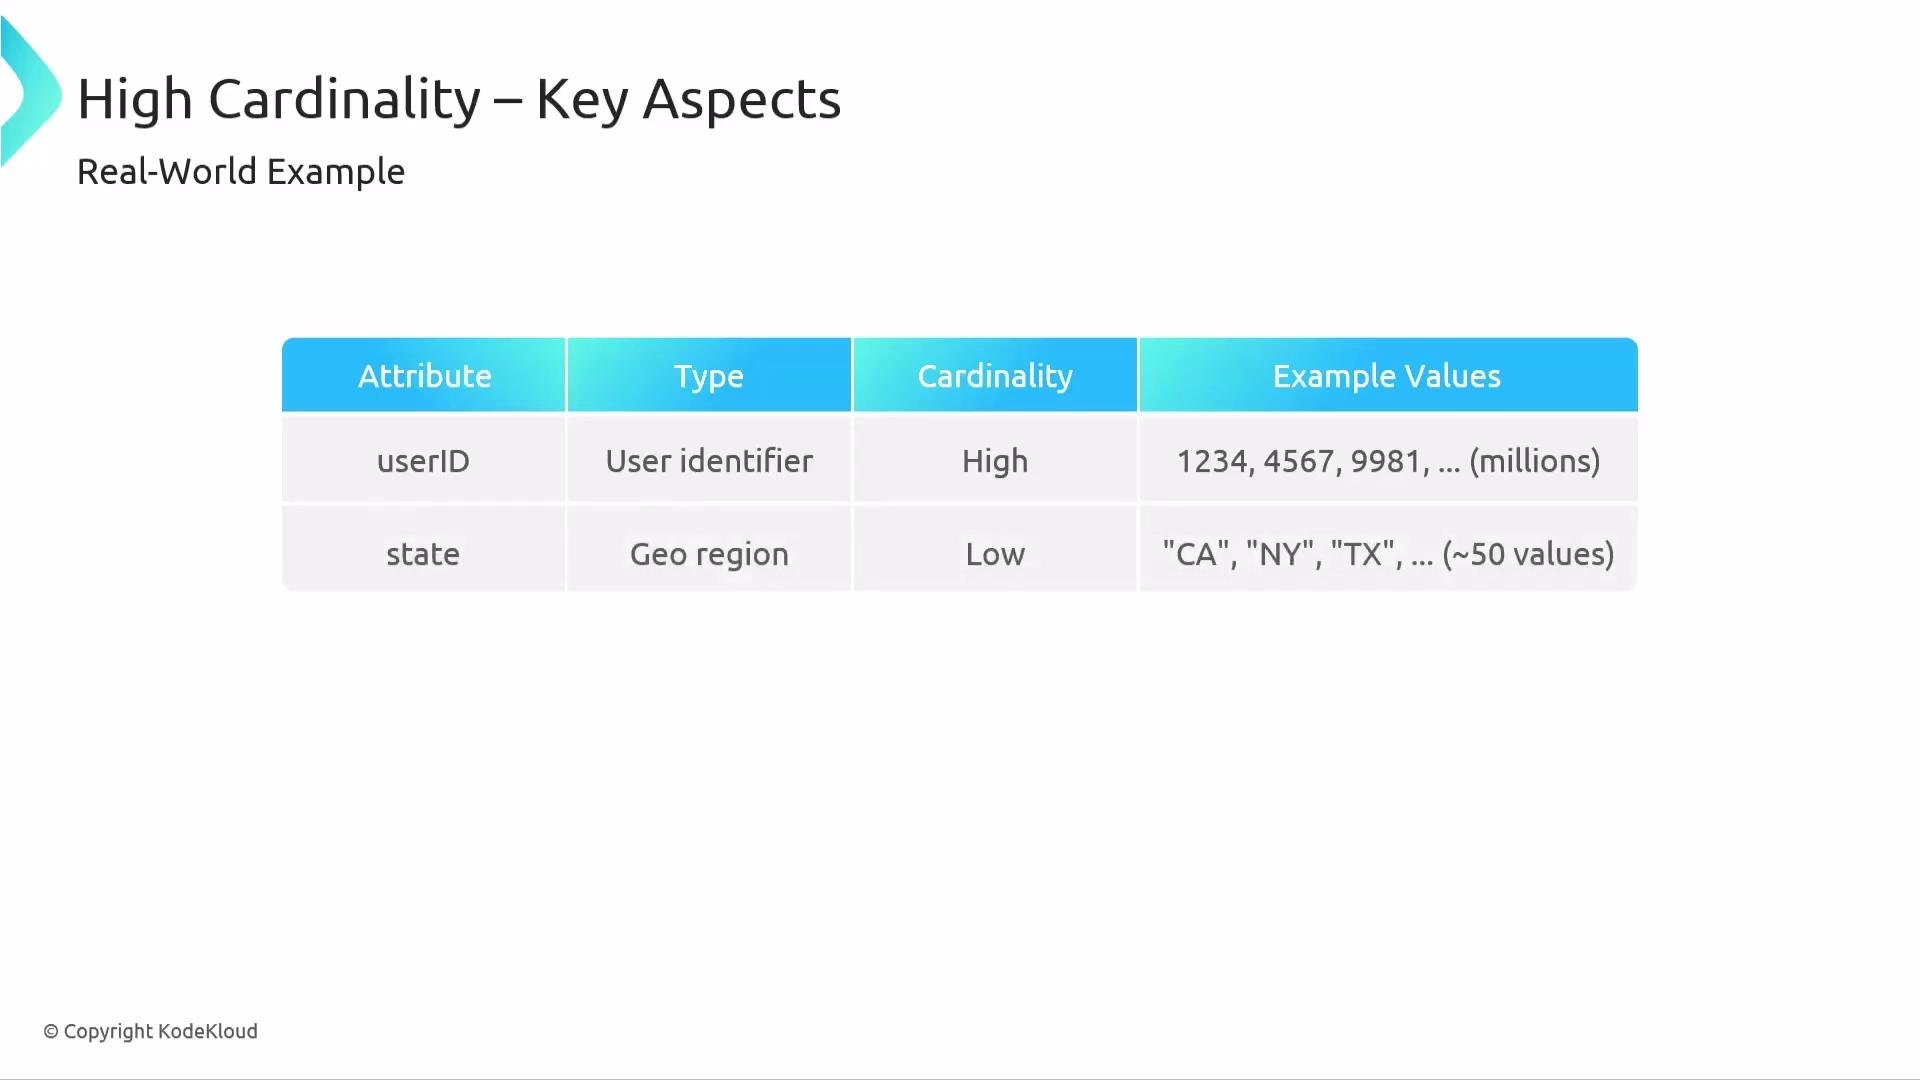
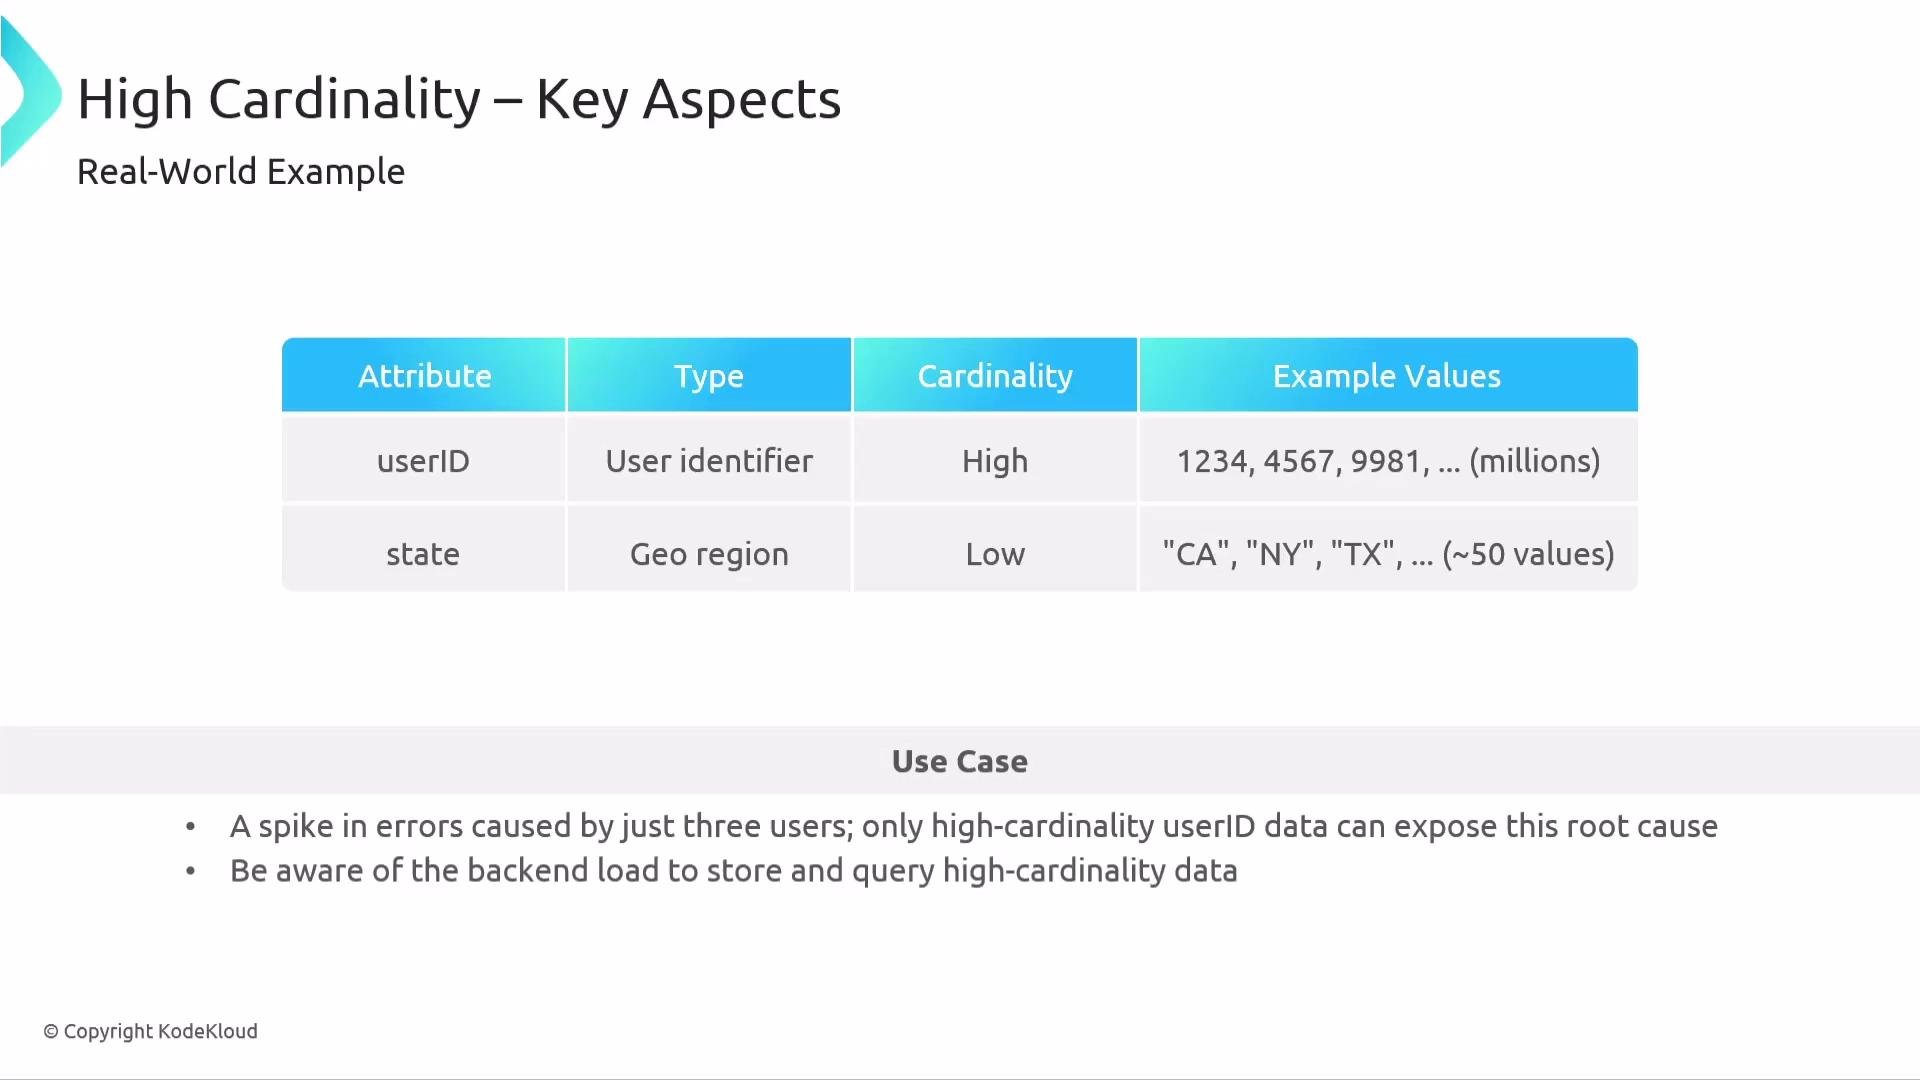
High-cardinality metrics provide detailed, actionable insight but increase the number of metric series. Design labels to balance operational needs with backend cost and performance.
Warning: storing and querying high-cardinality data increases backend load. Confirm your observability backend can handle the ingestion and query volume before adding many high-cardinality labels.
Practical guidance and patterns
- Use low-cardinality attributes for broad monitoring and alerting: cheaper and faster.
- Use medium cardinality for deeper trend analysis and segmentation.
- Use high-cardinality attributes sparingly for root-cause analysis or specific investigations.
- If you need per-entity visibility but want to limit metric cost:
- Apply sampling for high-frequency entities.
- Aggregate or bucket values (e.g., percentile or range buckets).
- Store high-cardinality details in traces or logs and link them to aggregated metrics when necessary.
- Use labeling strategies that avoid combinatorial explosion (e.g., avoid mixing many high-cardinality labels on a single metric).
Summary
Cardinality is a key design decision in observability. Thoughtful selection of labels and aggregation levels ensures useful insights while keeping costs and backend load manageable. Balance granularity with practicality: instrument enough detail to troubleshoot and analyze, but avoid unnecessary high-cardinality series.Links and references
- OpenTelemetry metrics concepts: https://opentelemetry.io/docs/
- Prometheus documentation (time series & labels): https://prometheus.io/docs/introduction/overview/
- Observability best practices: https://landing.google.com/sre/sre-book/ (relevant SRE guidance)