

This guide assumes you have traces being exported to a Jaeger-compatible backend and Grafana configured with a Jaeger datasource. If you need setup guidance, see the OpenTelemetry, Jaeger, and Grafana docs linked in References.
- Open Grafana → Explore.
- Select the Jaeger datasource.
- Enter filters such as
serviceoroperation(span name), and optional attribute matches or min/max duration. - Limit the time range (e.g., last 5 minutes) before running the query.
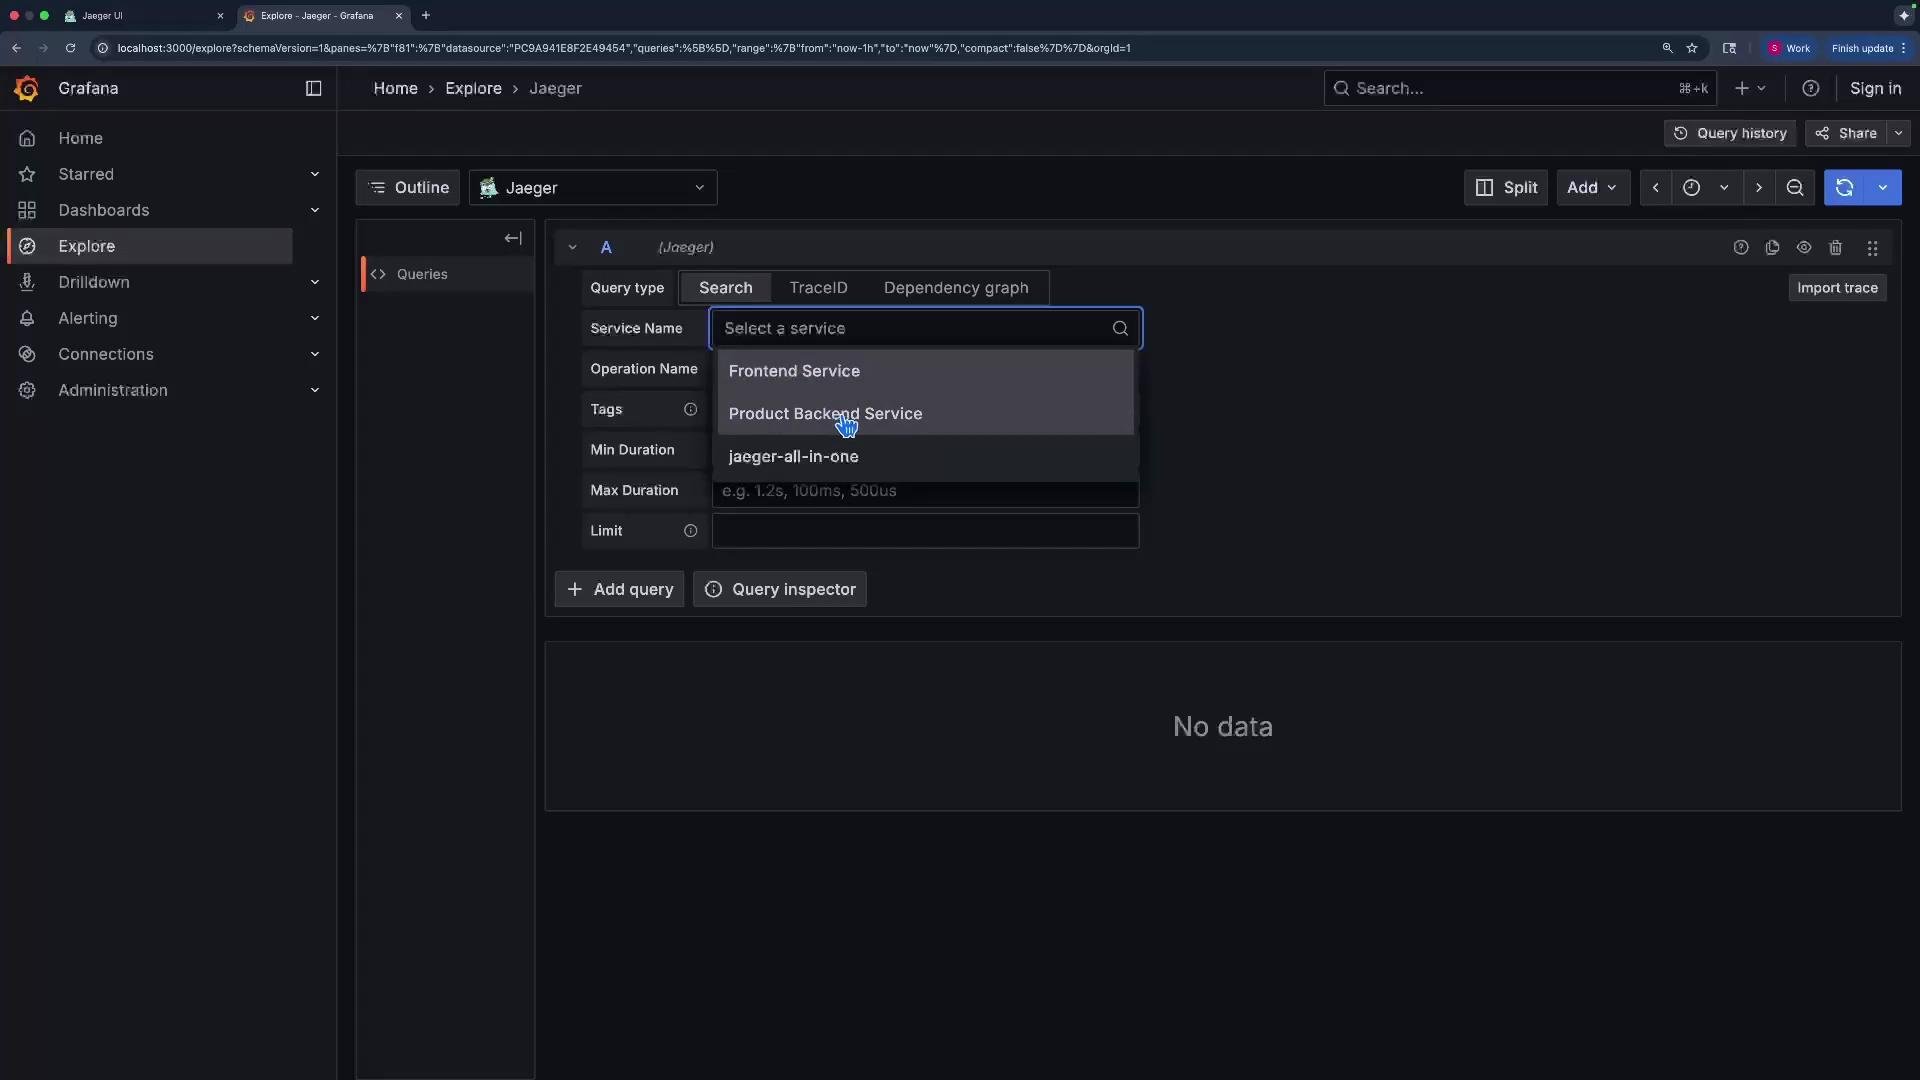
getUserCart, getIndividualProduct, getRecommendedProduct, requestToTheProductsAPI, updateProduct. For this walkthrough I select all operations to capture a representative trace.
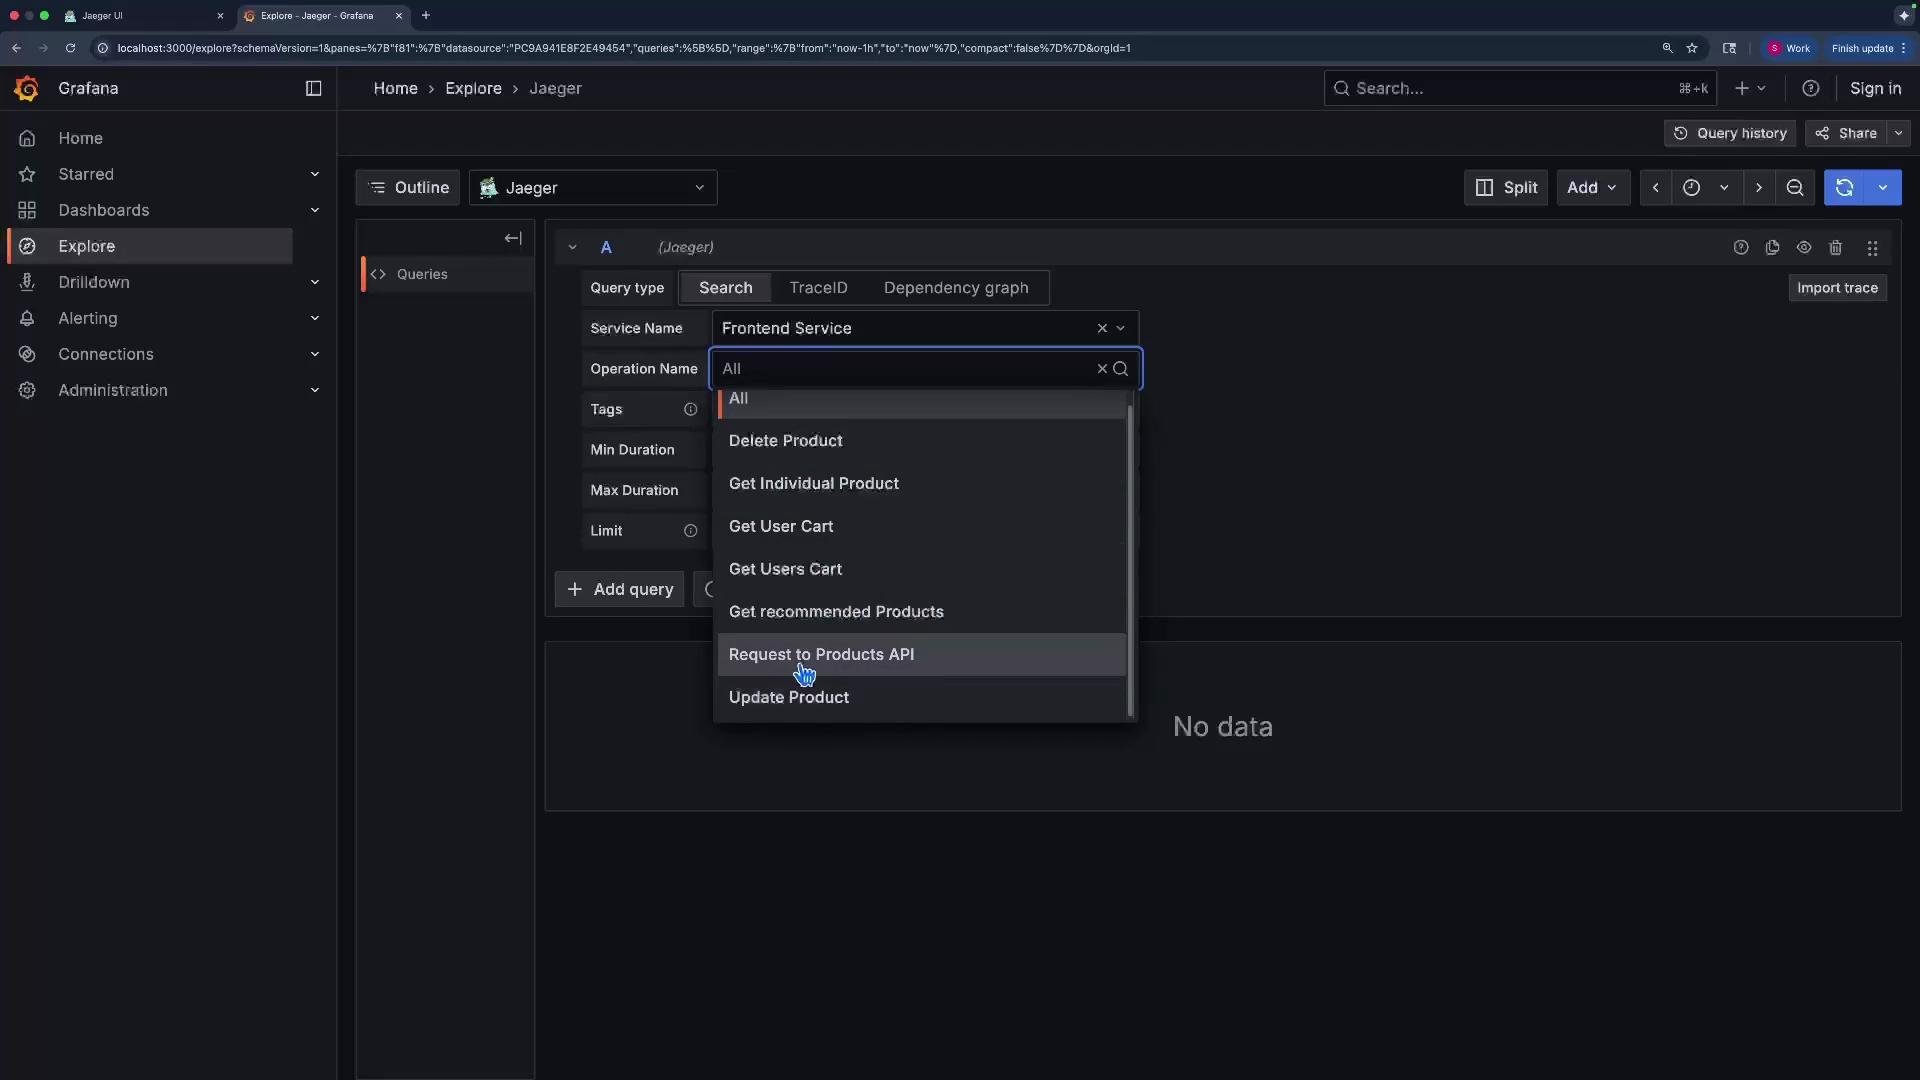
- Trace ID and start timestamp.
- Total duration (~80 ms).
- Involved services: frontend and backend.
- Total spans: four.
Expand each span to view service-level or span-level details. The first span is the frontend root span representing the initial update product action.
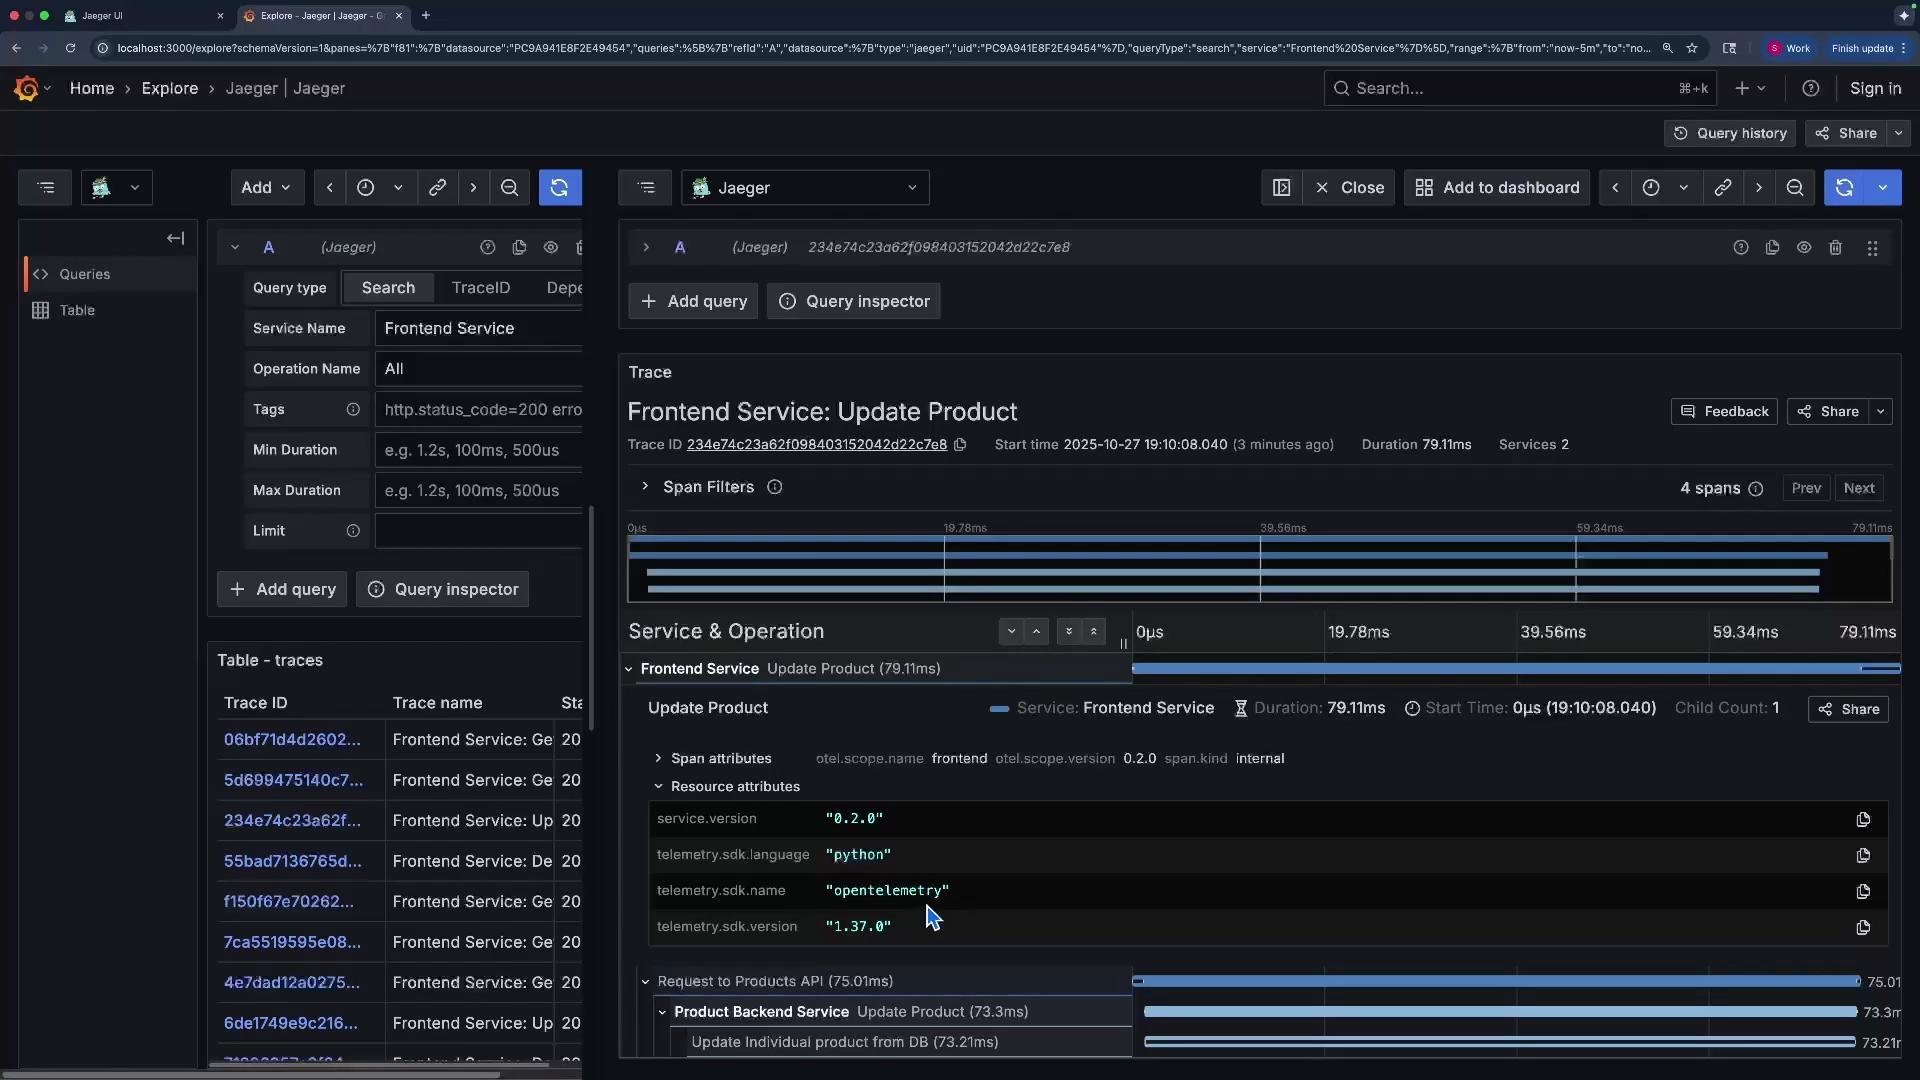
- Root span: starts at 0 relative to the trace.
- Duration: ~79 ms (matches trace total because the root waits for children).
- Resource attributes: host, pod, region, etc. (this demo instruments a minimal set).
- Span attributes: in-application metadata such as service name and version.
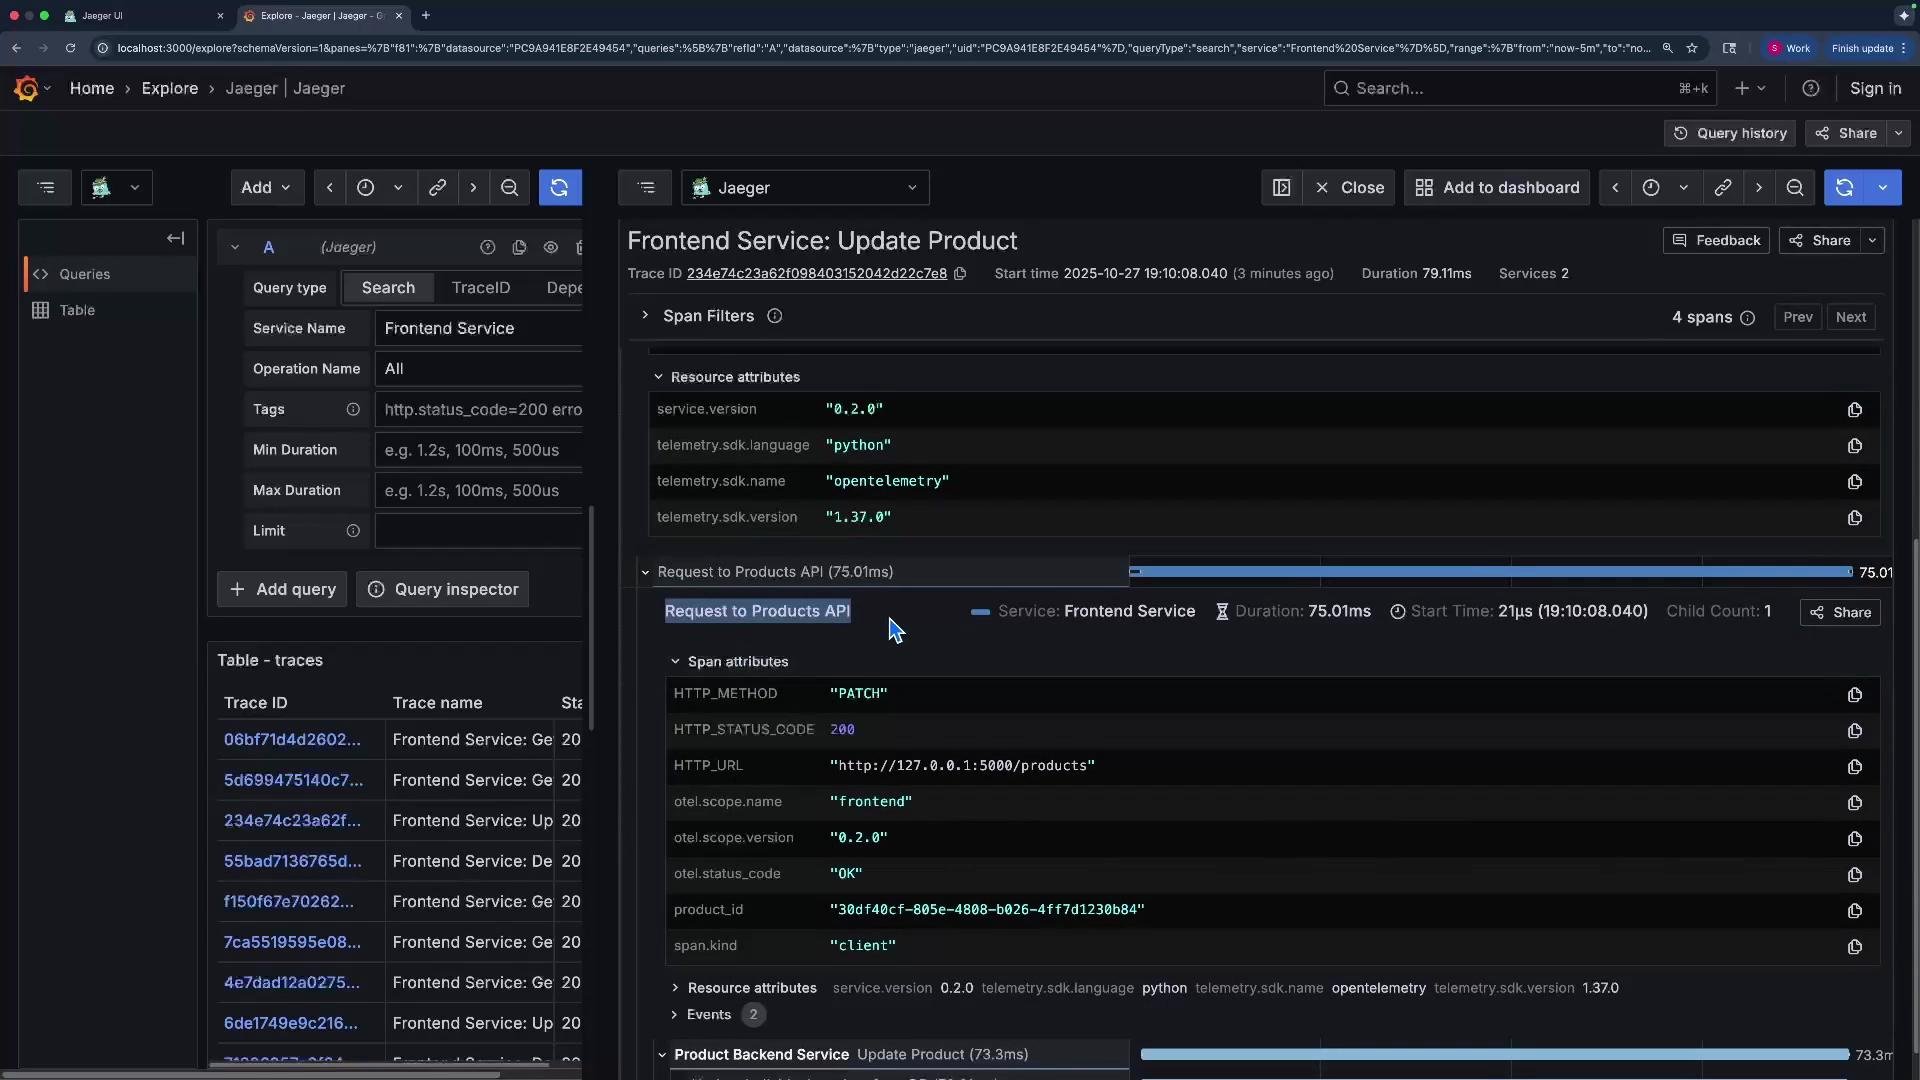
- Request URL and path (backend endpoint).
- HTTP method (
PATCH) and status code (200). - Span kind:
client. - Events: timestamped logs such as
request.sent. Events are ideal for attaching exceptions or custom logs to spans.
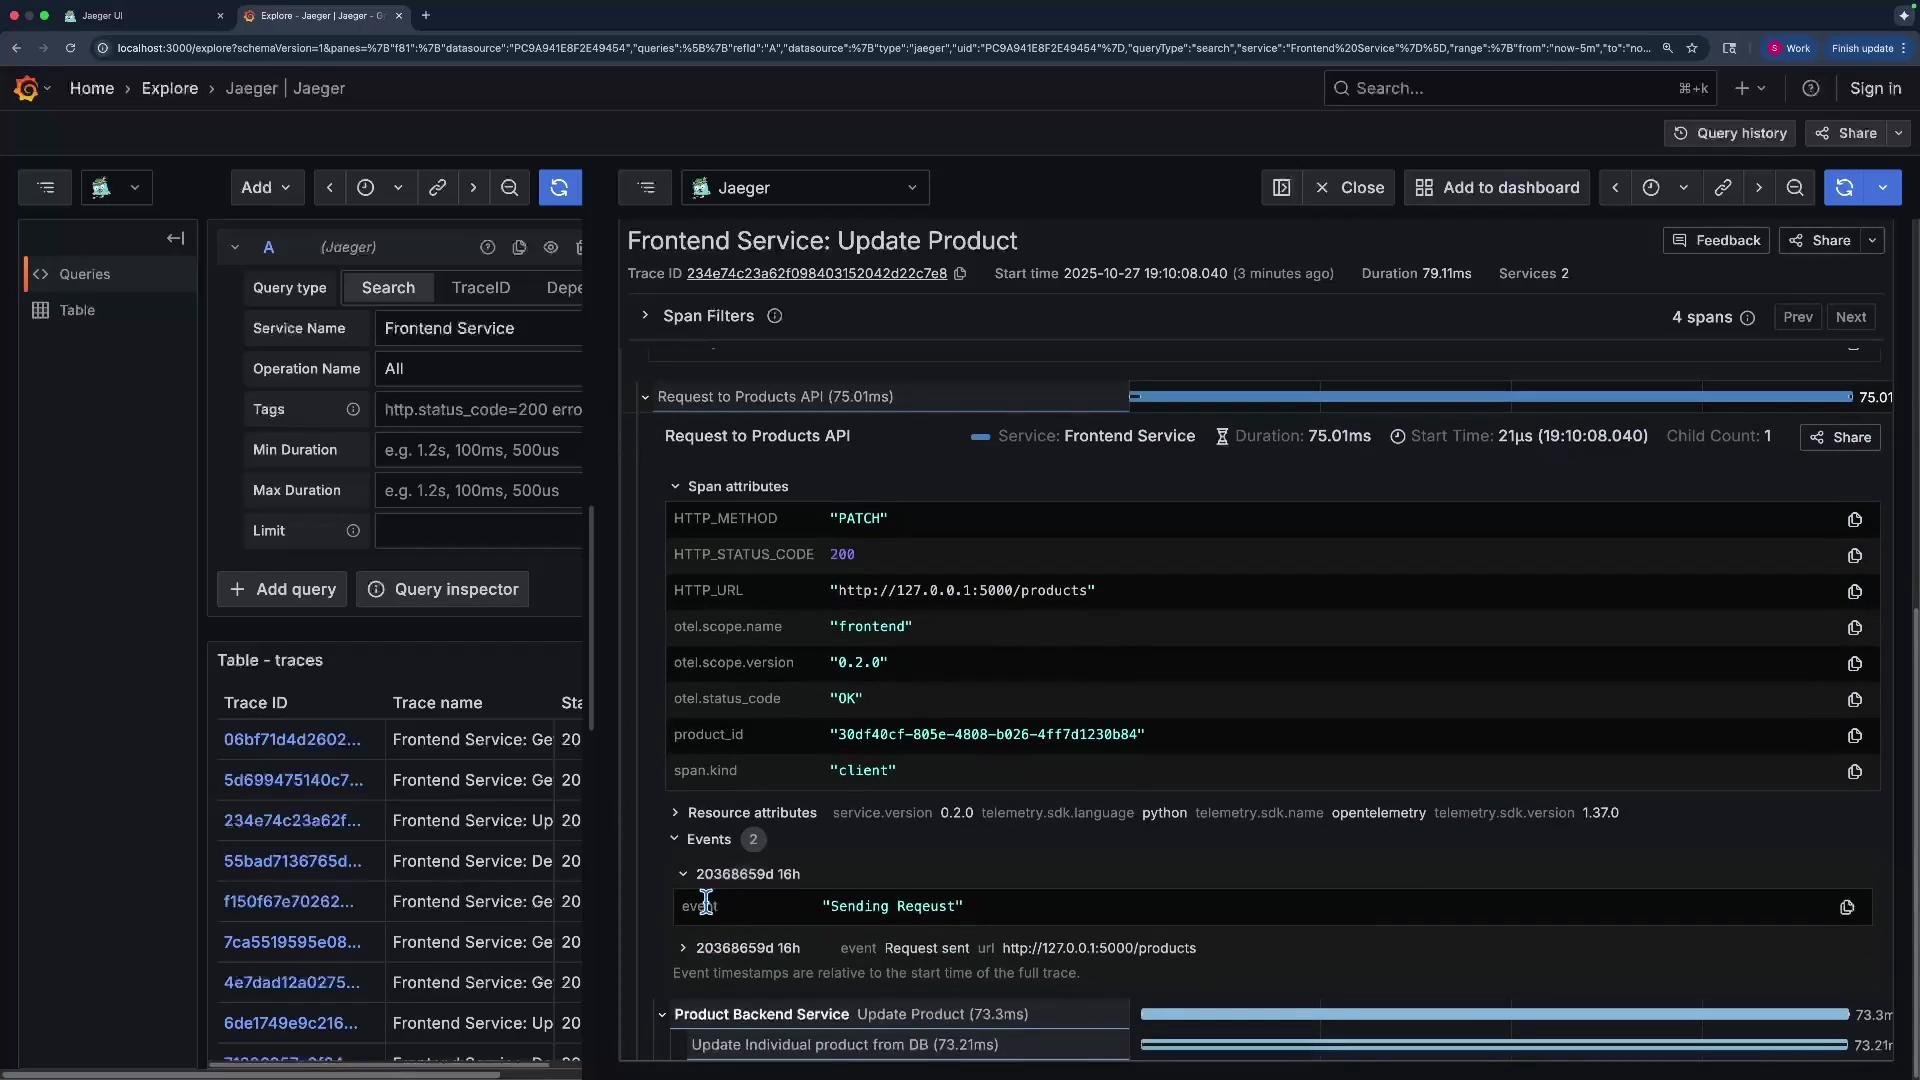
update-product operation.
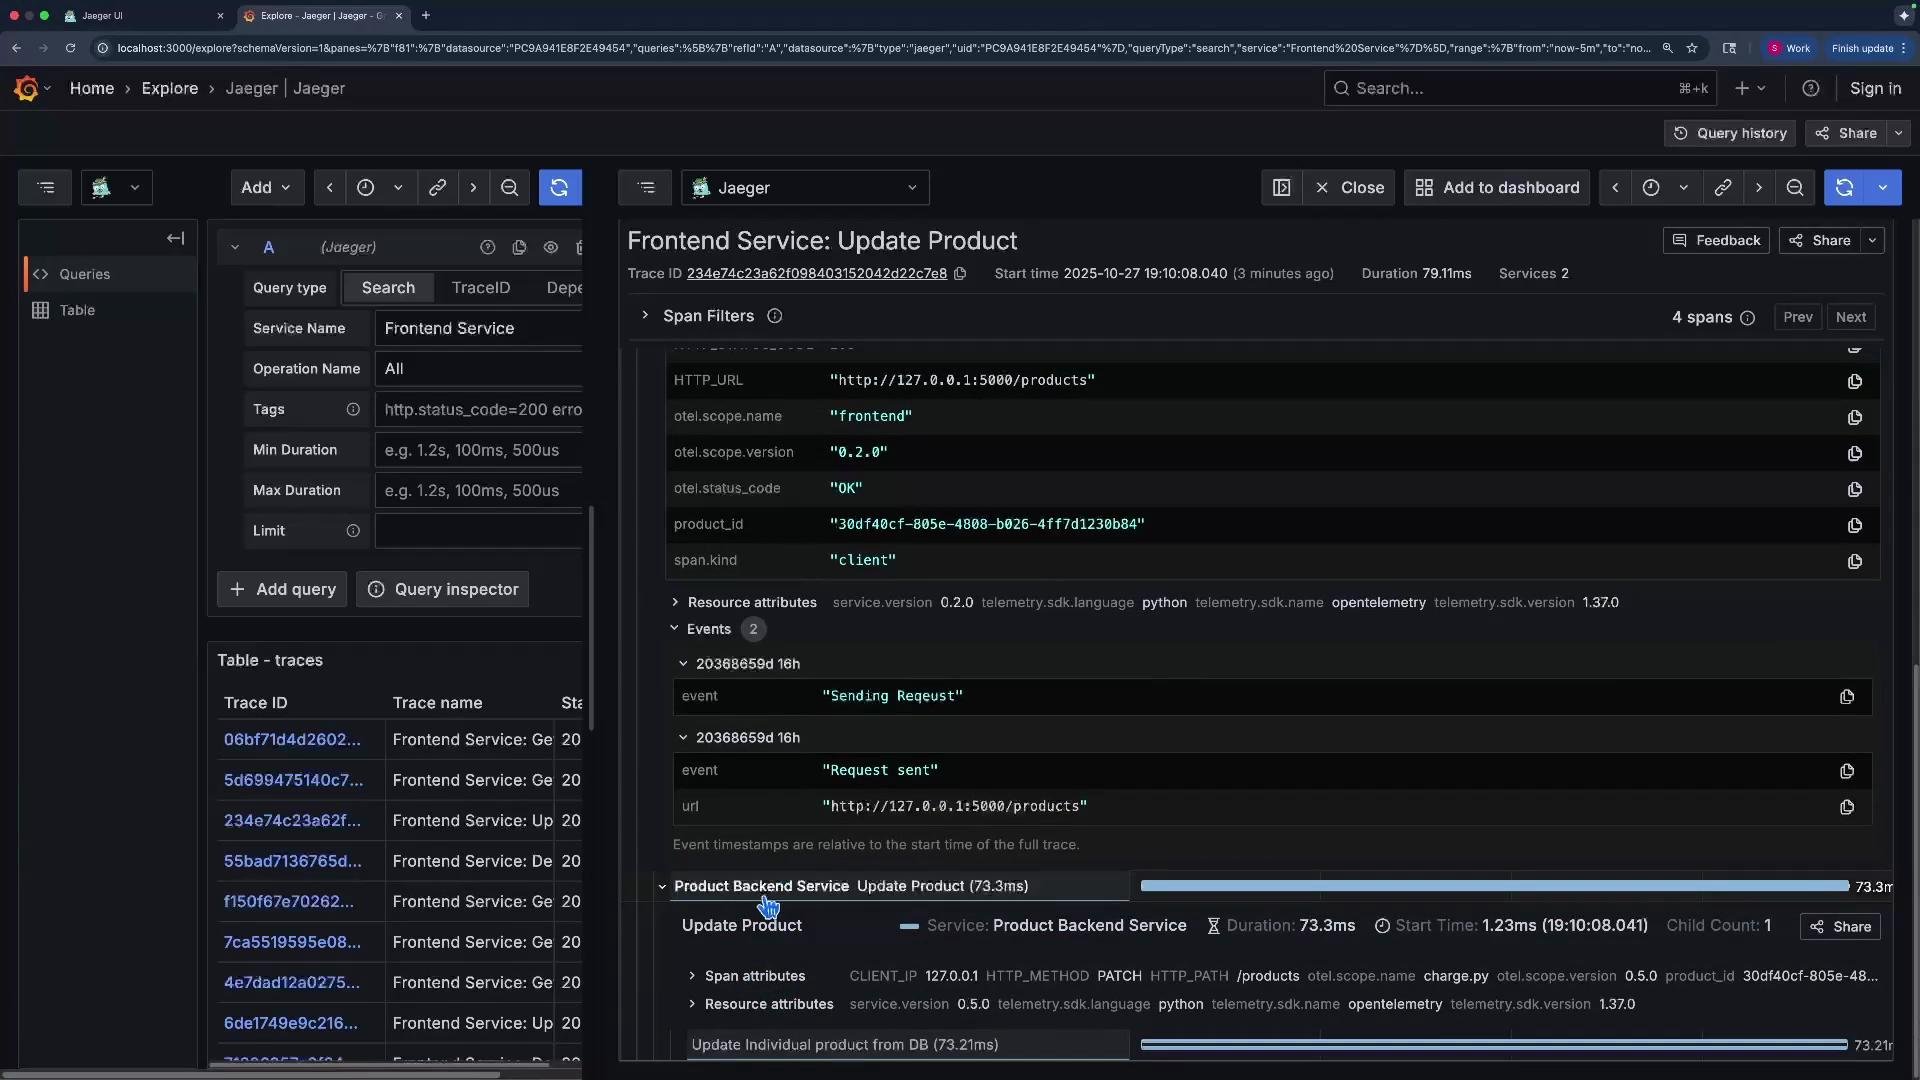
- Service name:
product-backend-service. - Backend span total: ~73 ms.
- A DB child span: ~1.23 ms.
- Start times are relative to the trace root; e.g., frontend root = 0 µs, backend starts at ~21 µs, DB child at ~1.23 ms — these offsets show timing relationships between steps.
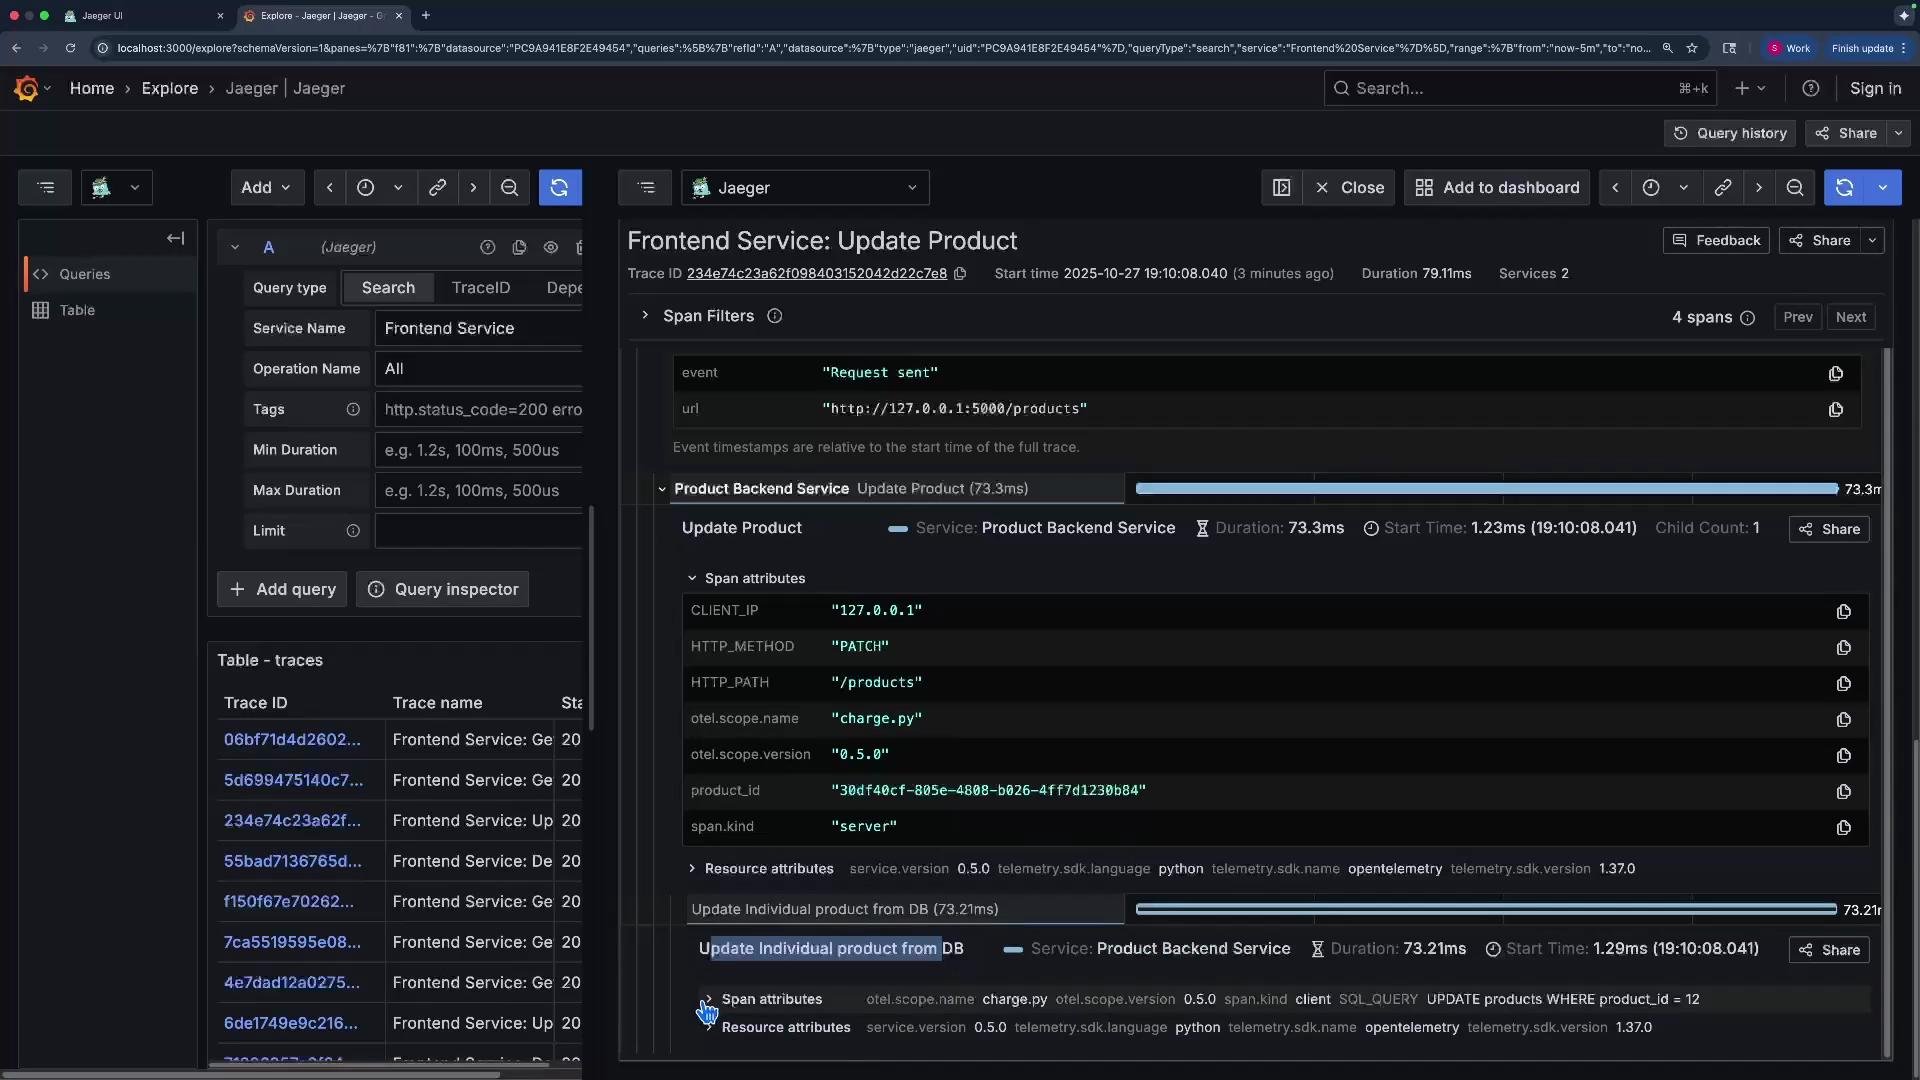
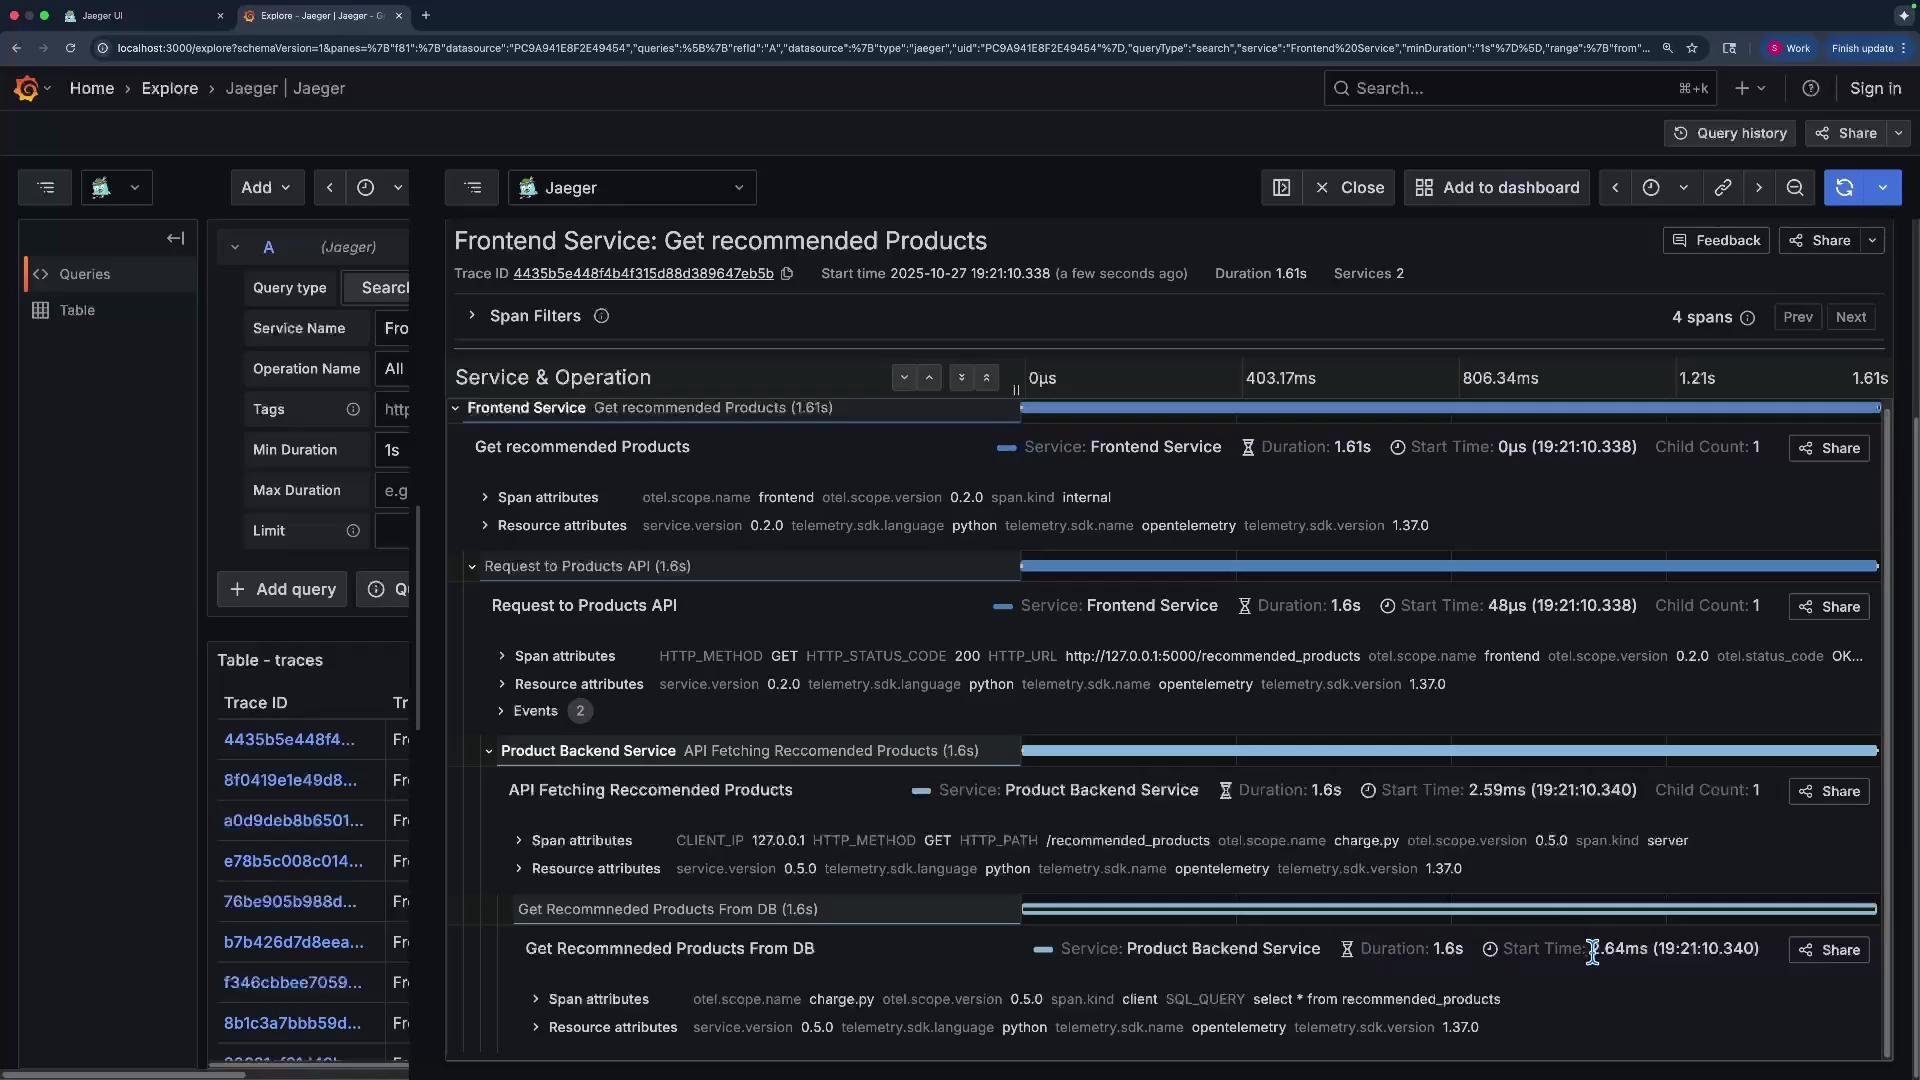
otel.scope.name: “charge.py”otel.scope.version: “0.5.0”span.kind: “client”SQL_QUERY: “select * from recommended_products”
Use duration filters when troubleshooting performance problems: start broad (for example,
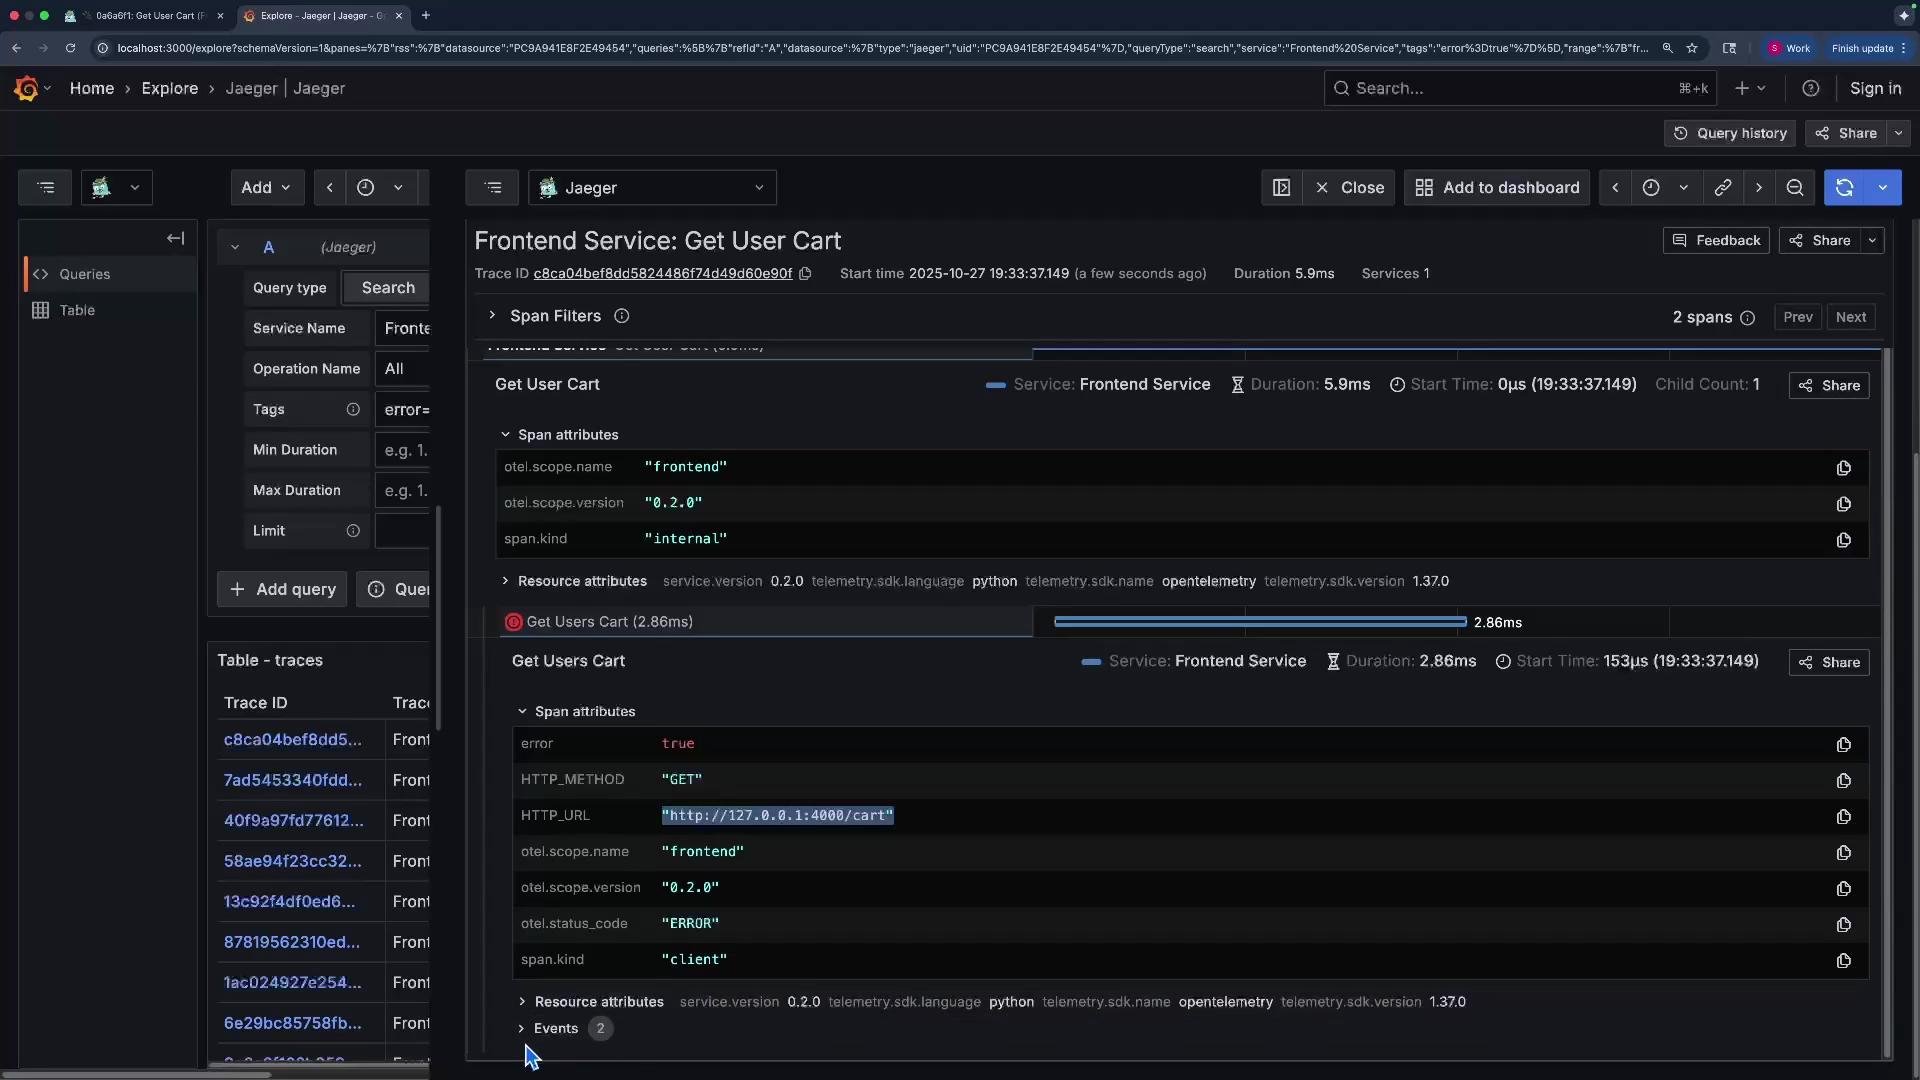
min duration > 1s) and then drill into individual traces to identify the single offending span(s).error = true and include an exception event with a stack trace. Searching for traces where error = true helps you quickly surface failing requests.
Below is an example exception recorded as a span event. The frontend failed to connect to the cart service (connection refused). The exception payload includes the HTTP client error message and the Python stack trace, which drastically reduces time-to-fix.
- Traces provide correlated, time-ordered telemetry across service boundaries to pinpoint latency hotspots and failing calls.
- Instrument your services with the OpenTelemetry SDK for your language and configure an exporter (e.g., Jaeger) so services emit spans like the ones shown above.
- Focus on these practical steps when troubleshooting:
- Filter traces by duration to find slow flows.
- Drill into a trace and inspect per-span attributes and events.
- Look for
error = truespans and exception events for root cause details. - If available, use
db.statementorSQL_QUERYto escalate DB problems.