

DaemonSet
Running the collector as a DaemonSet launches one collector pod on every node, ensuring full node coverage. This is ideal for collecting node-local telemetry such as kubelet stats, host metrics, cAdvisor data, container and host logs, and workload telemetry that originates on the same node.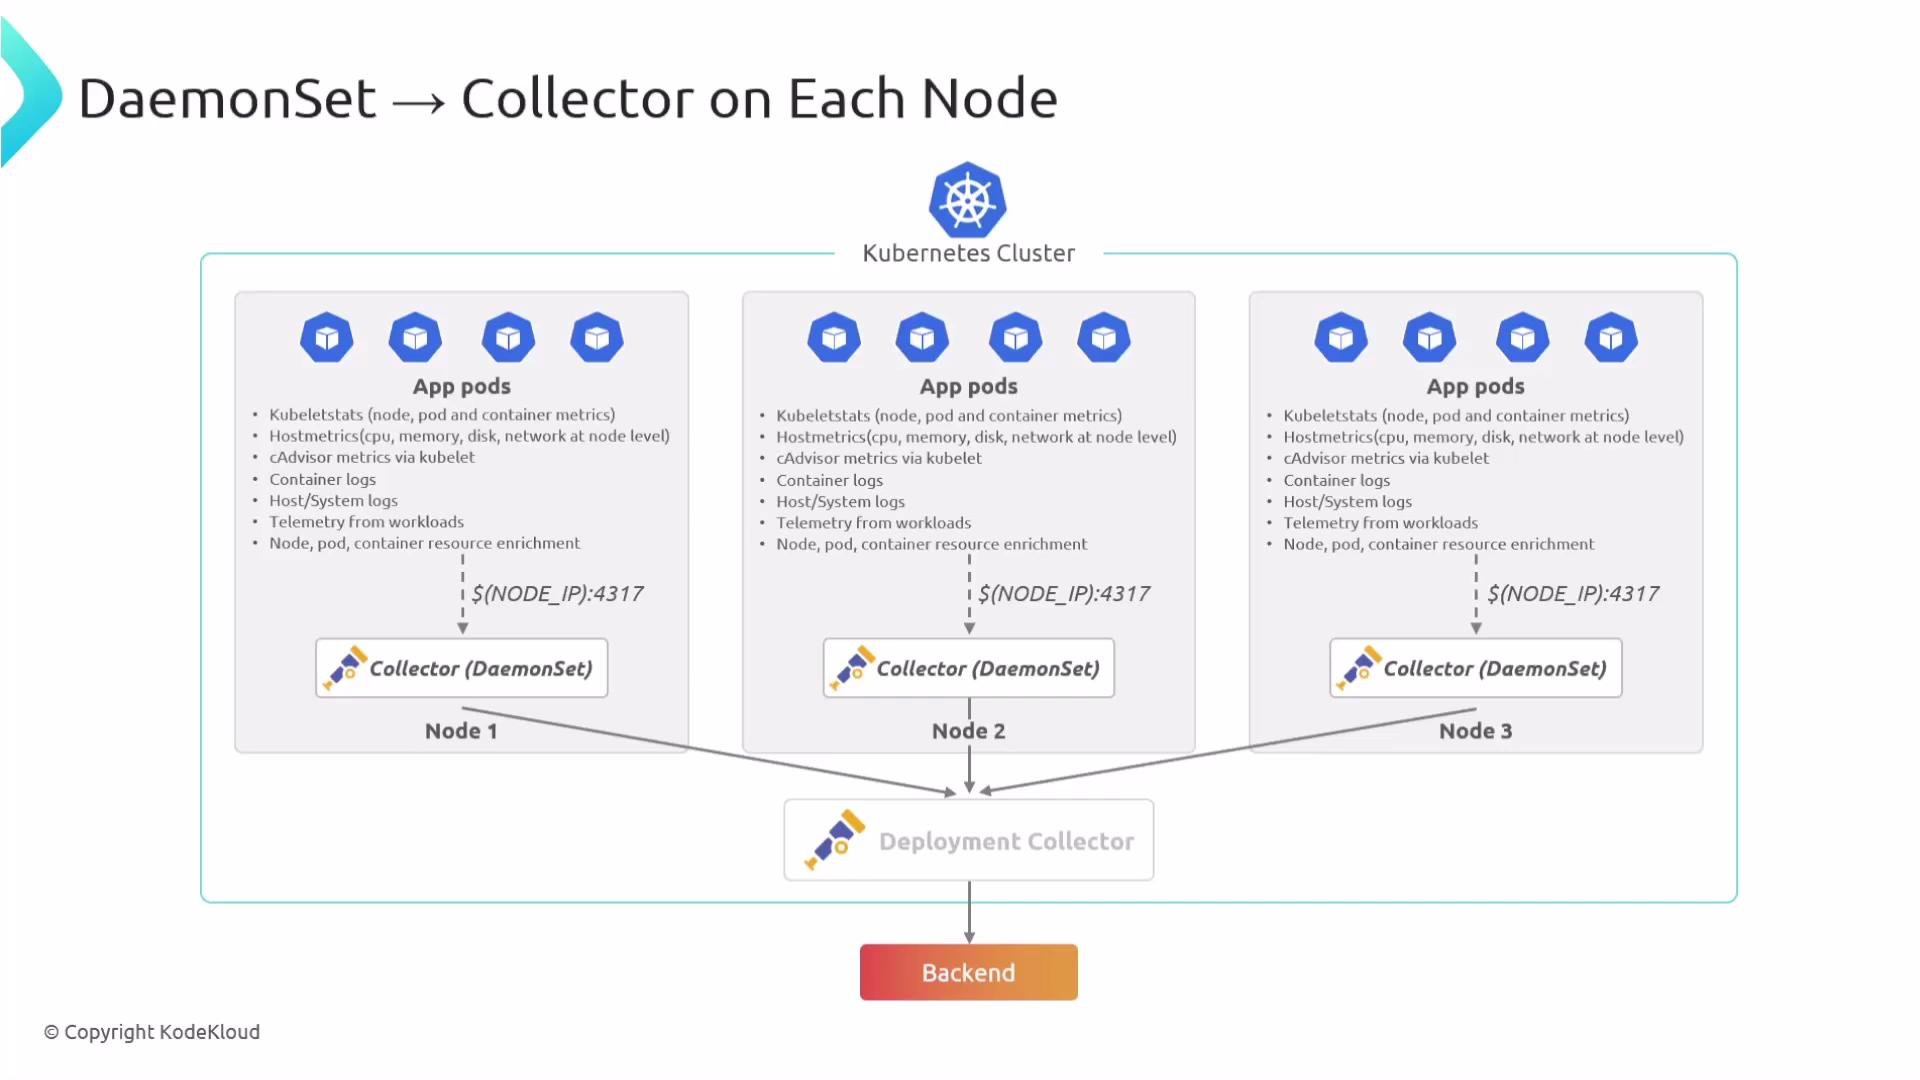
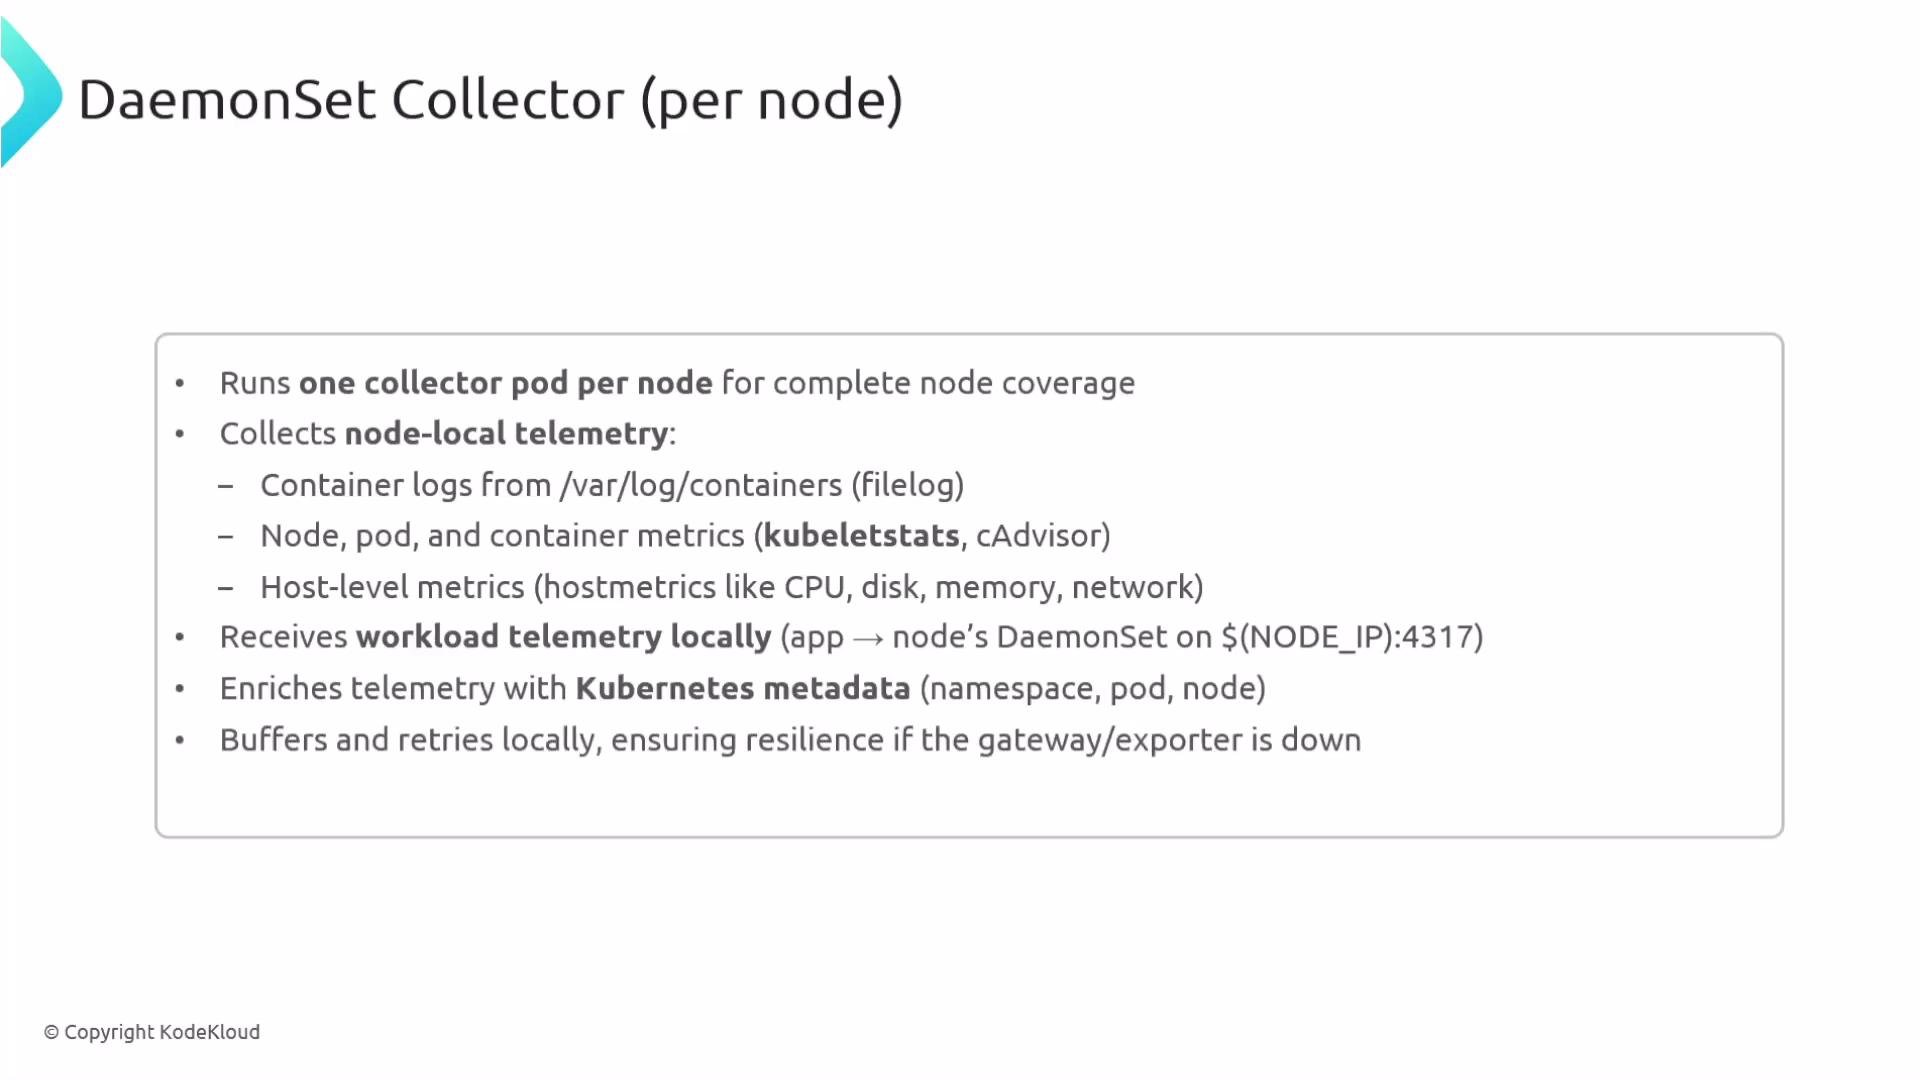
- Collect node-local telemetry (container logs, pod/container metrics, kubelet stats, host metrics, disk and memory usage).
- Receive workload telemetry locally from applications on the same node (reducing network hops).
- Enrich telemetry with Kubernetes metadata (namespace, pod name, node name).
- Buffer and retry locally to improve resilience against transient network or next-hop failures.
- DaemonSet -> Gateway: DaemonSet collectors commonly forward to a centralized Deployment (gateway) collector for centralized processing (sampling, aggregation, redaction).
- DaemonSet -> Backend: You can also configure DaemonSet collectors to export directly to external backends if per-node processing is sufficient.
Deployment (Gateway)
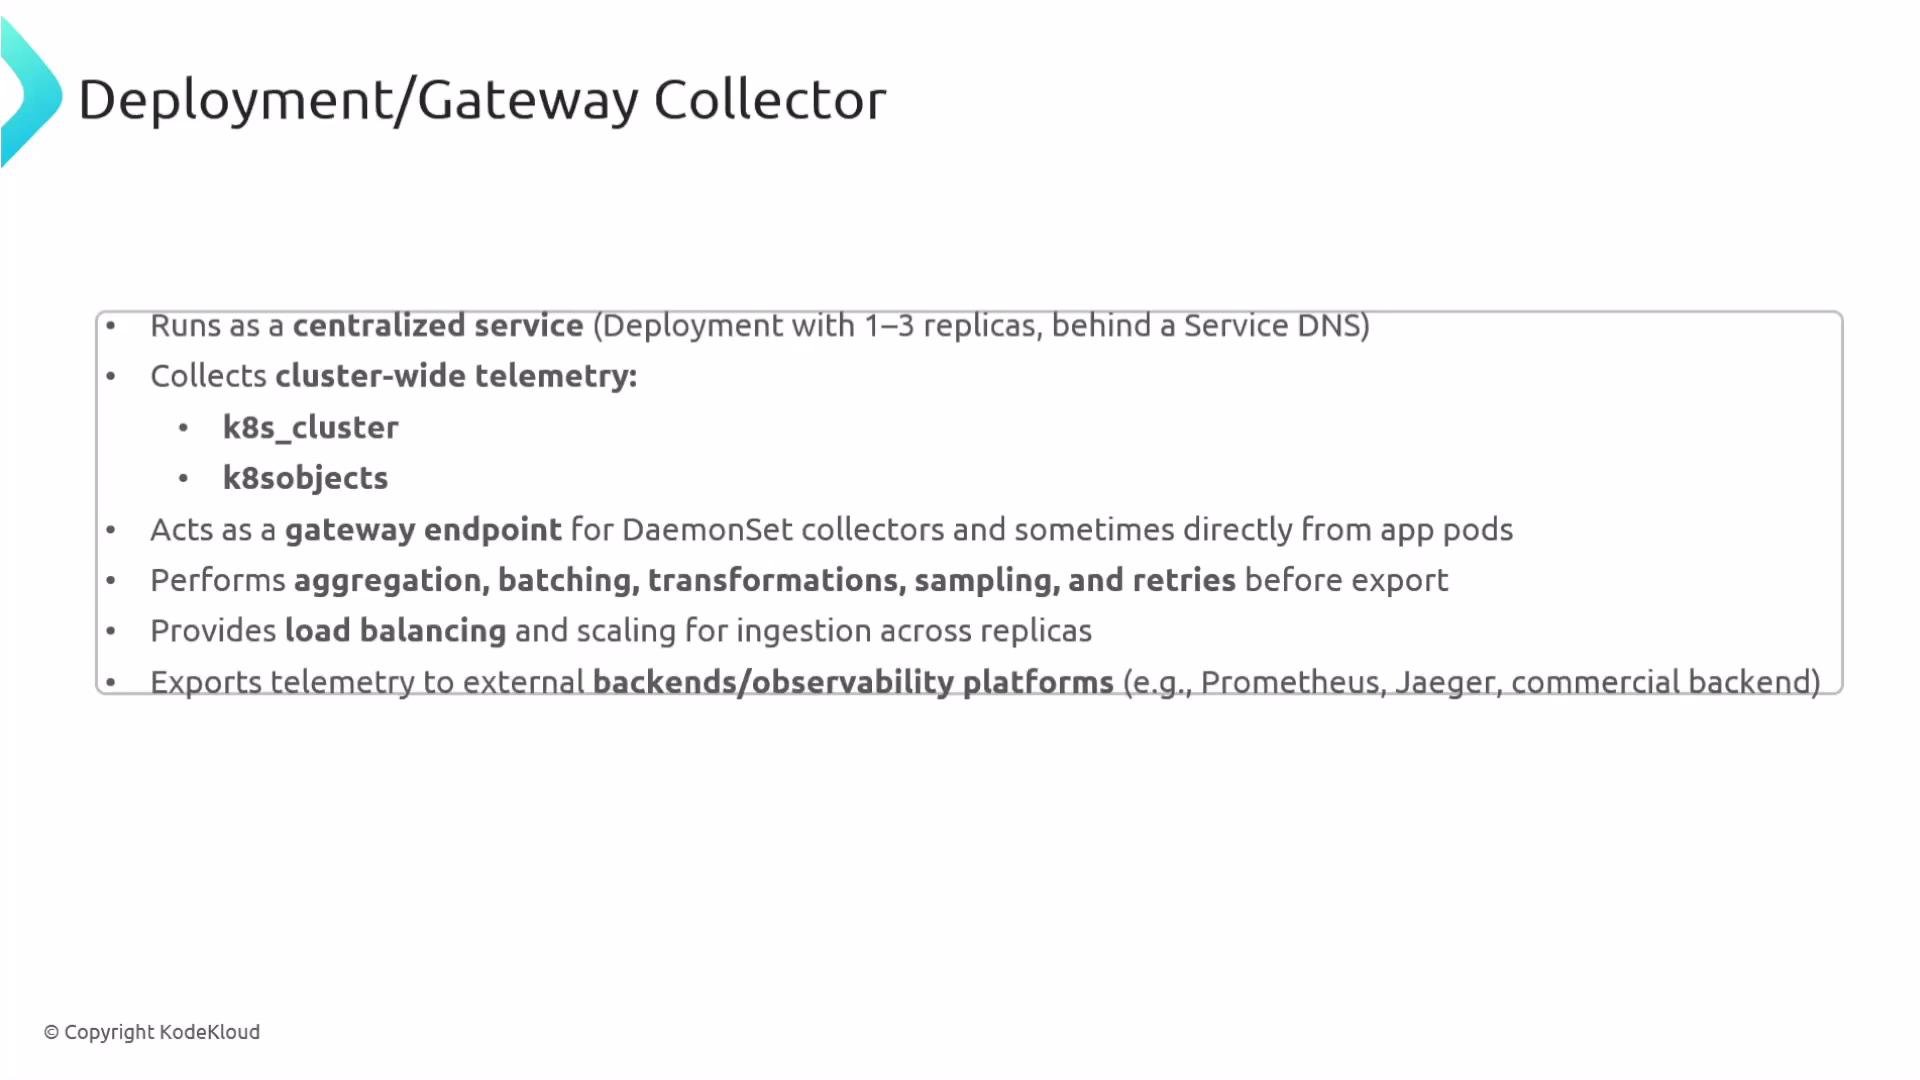
A Deployment-mode collector (often called a gateway) acts as a shared, stateless cluster endpoint. It aggregates telemetry from many workloads and is typically fronted by a Kubernetes Service so traffic can be load-balanced across replicas.- Receives cluster-wide telemetry (via receivers or forwarded from DaemonSets/sidecars).
- Stateless and horizontally scalable—run multiple replicas and load-balance via a Service.
- Common use cases: batching, sampling, transformation, PII redaction, centralized buffering.
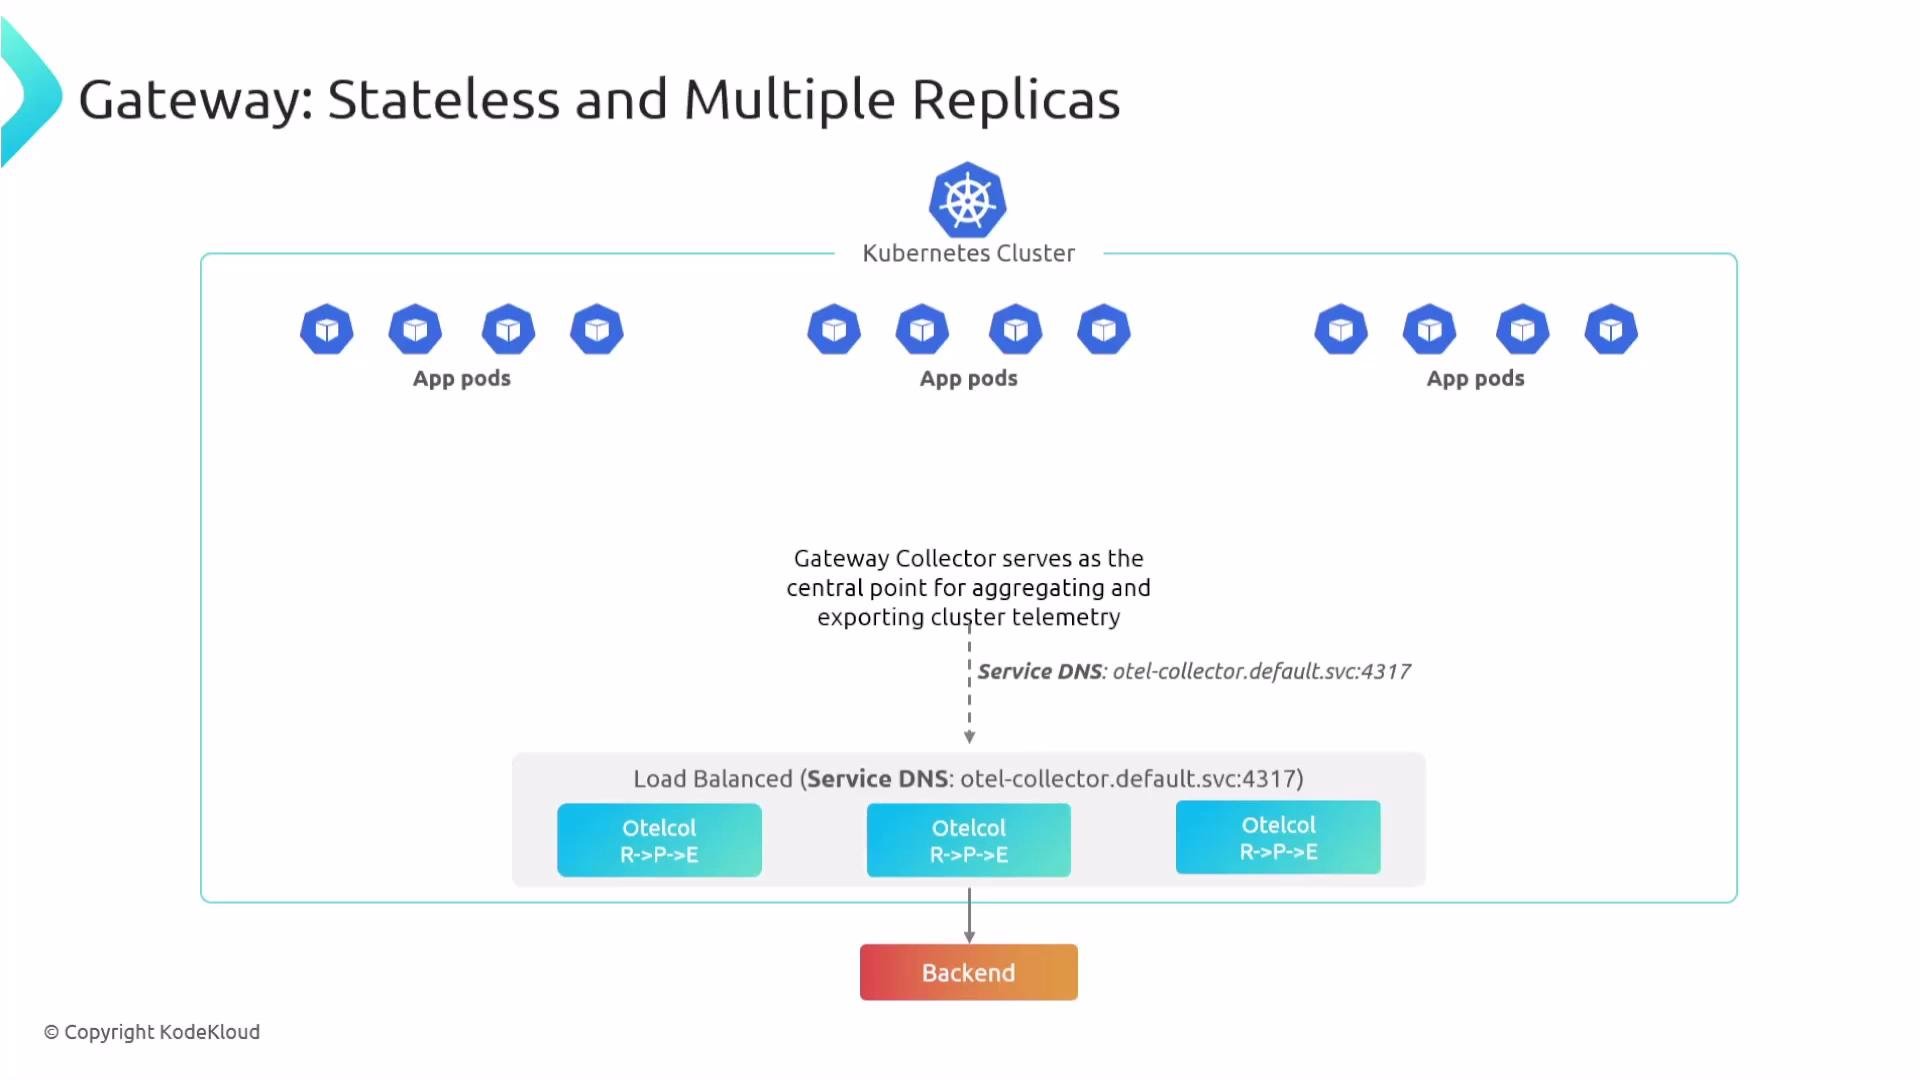
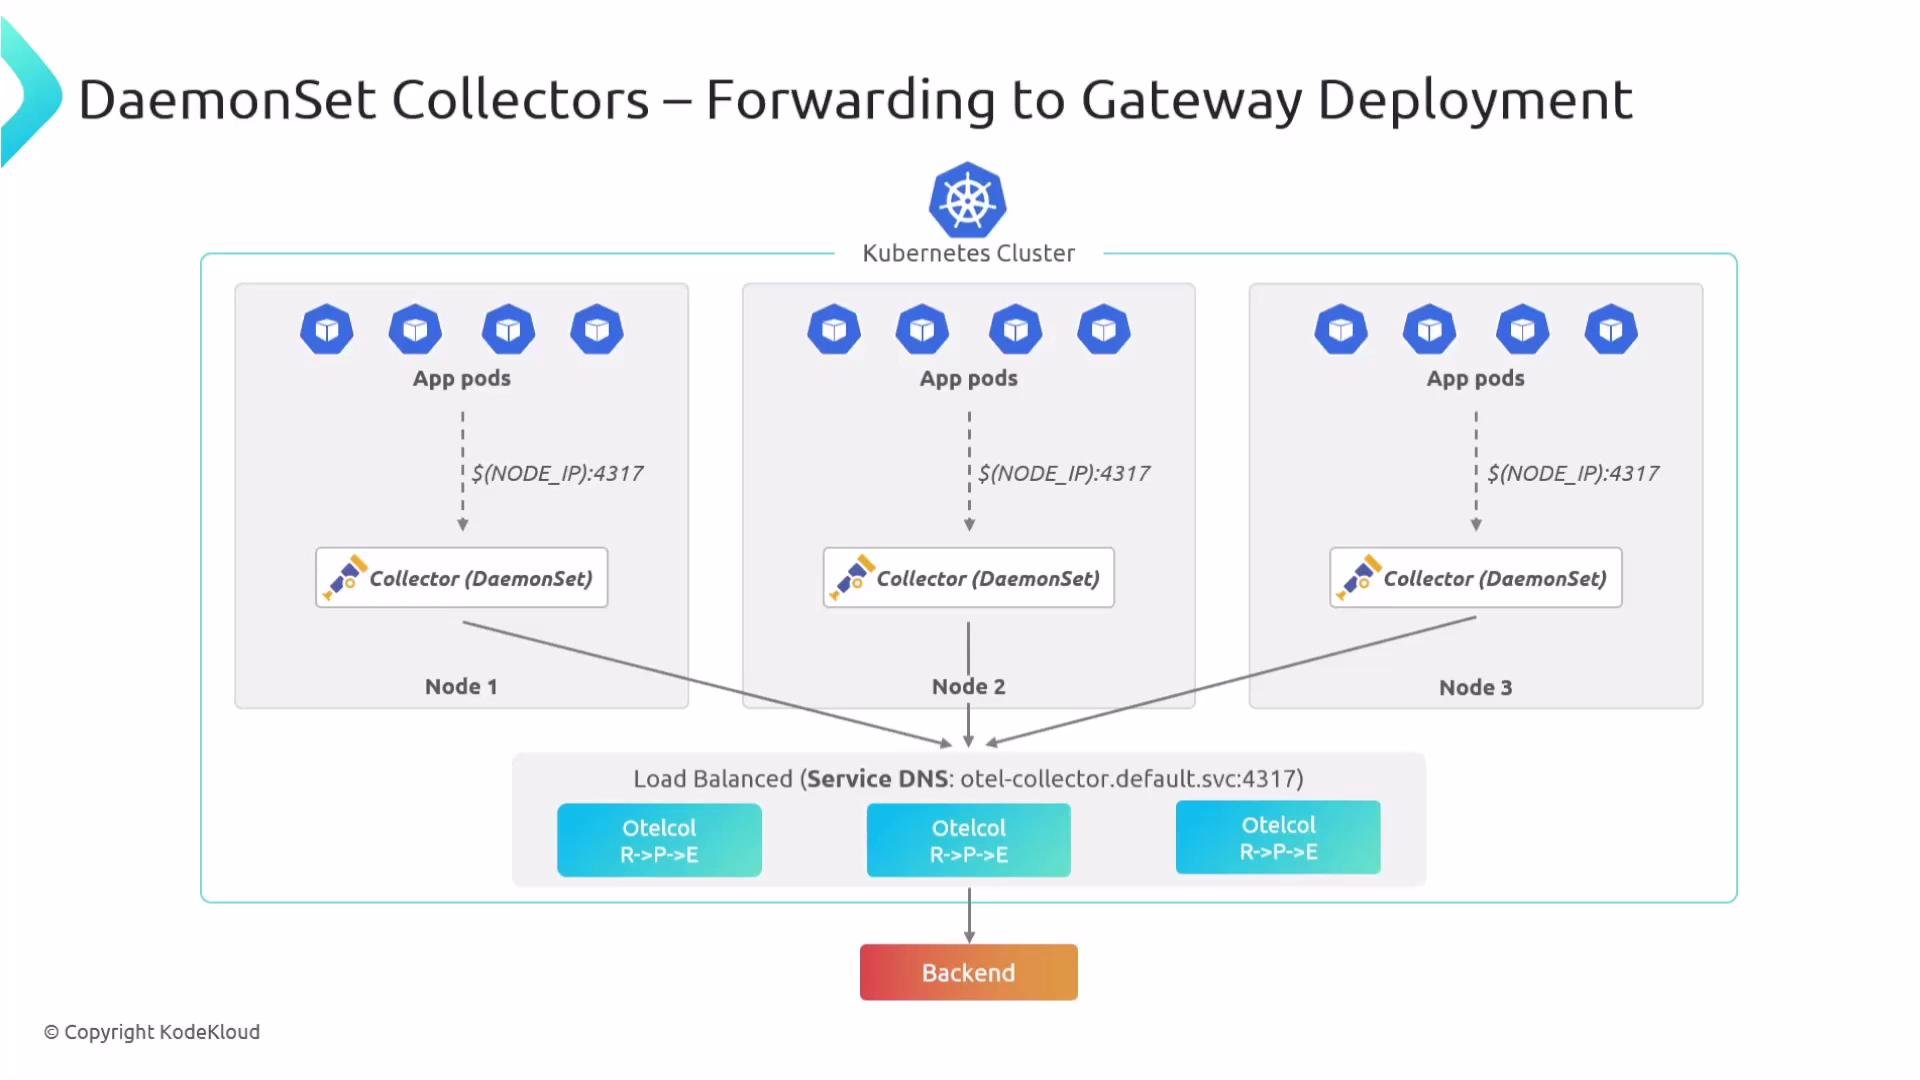
mode: deployment in the OpenTelemetryCollector resource. The configuration (receivers/processors/exporters) is shared across replicas and reachable through the Service DNS.
Sidecar
The sidecar pattern runs the collector in the same pod as the application container. This eliminates network hops between app and collector and isolates telemetry collection to the application instance level.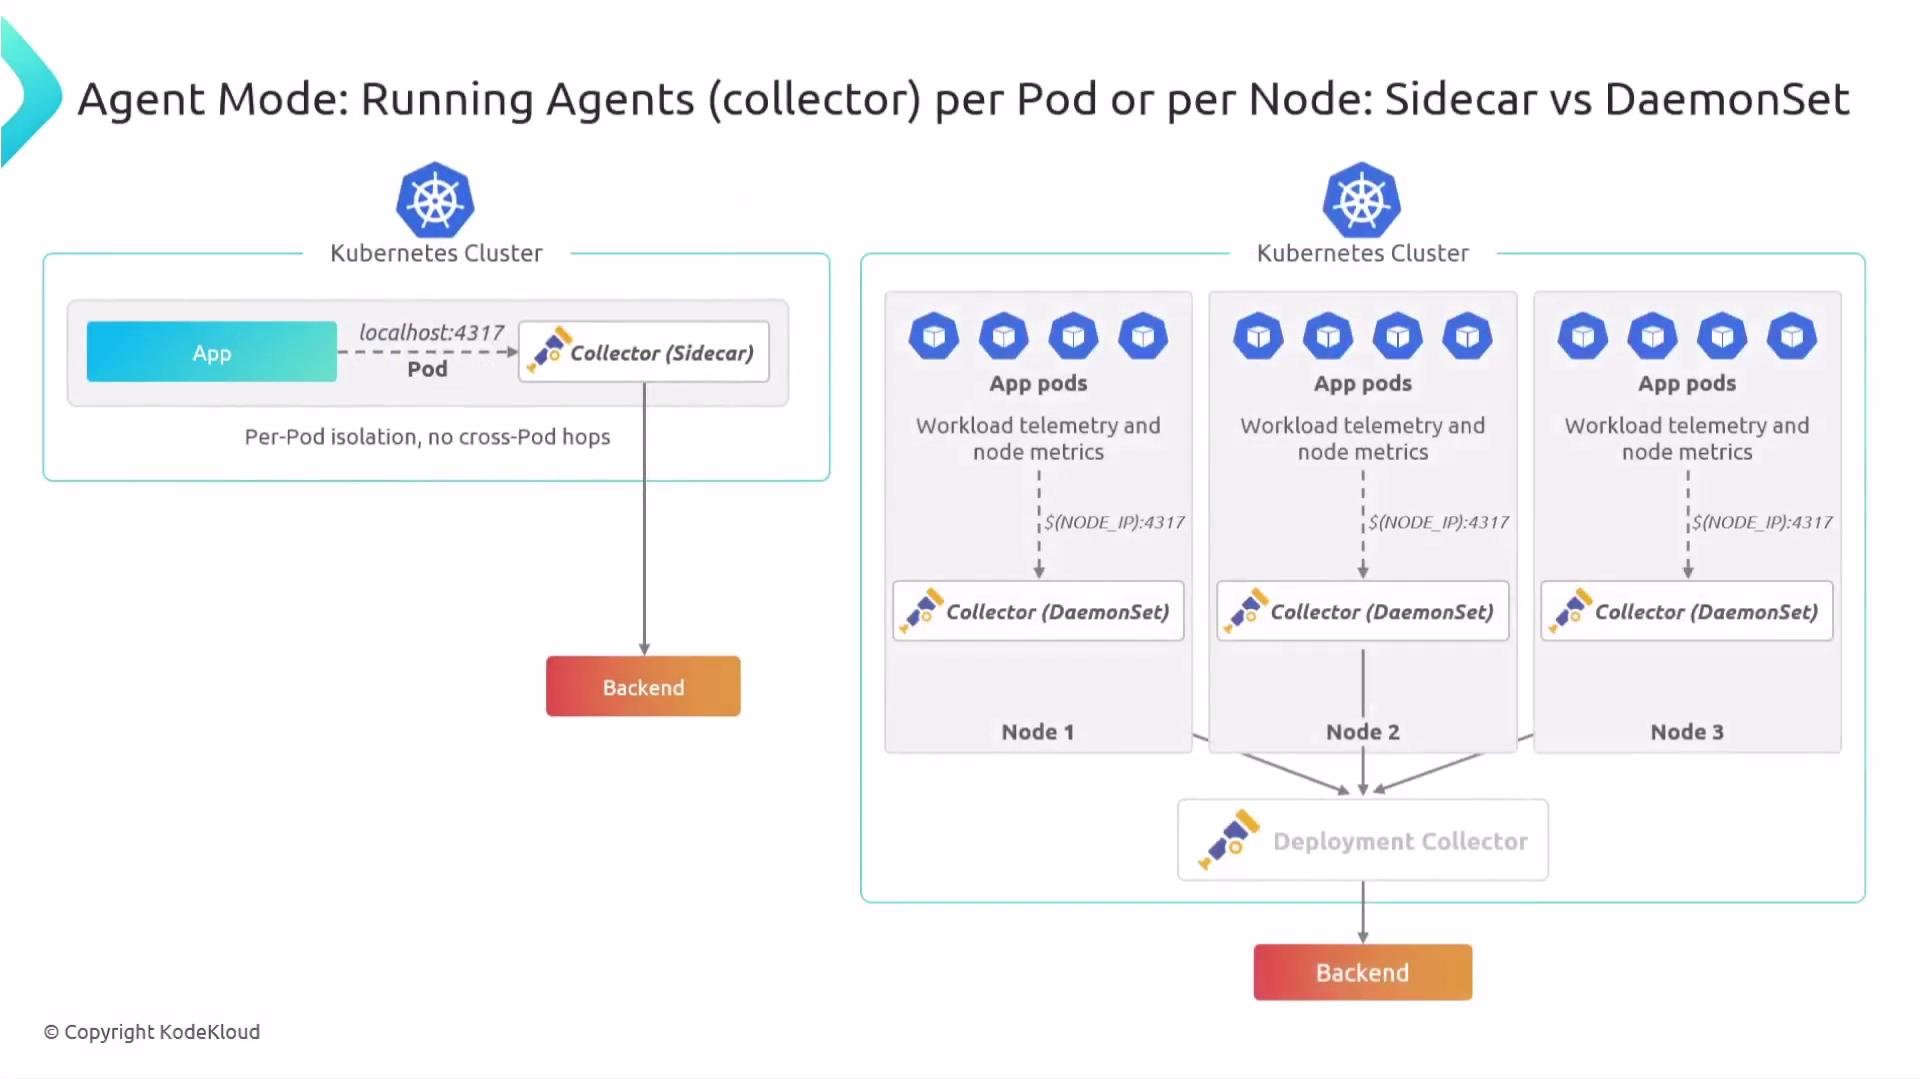
- You want per-application isolation and minimal hop telemetry collection.
- You need collector configuration tailored specifically for a single application.
- You may opt to export data directly from sidecars or forward to a central gateway.
StatefulSet
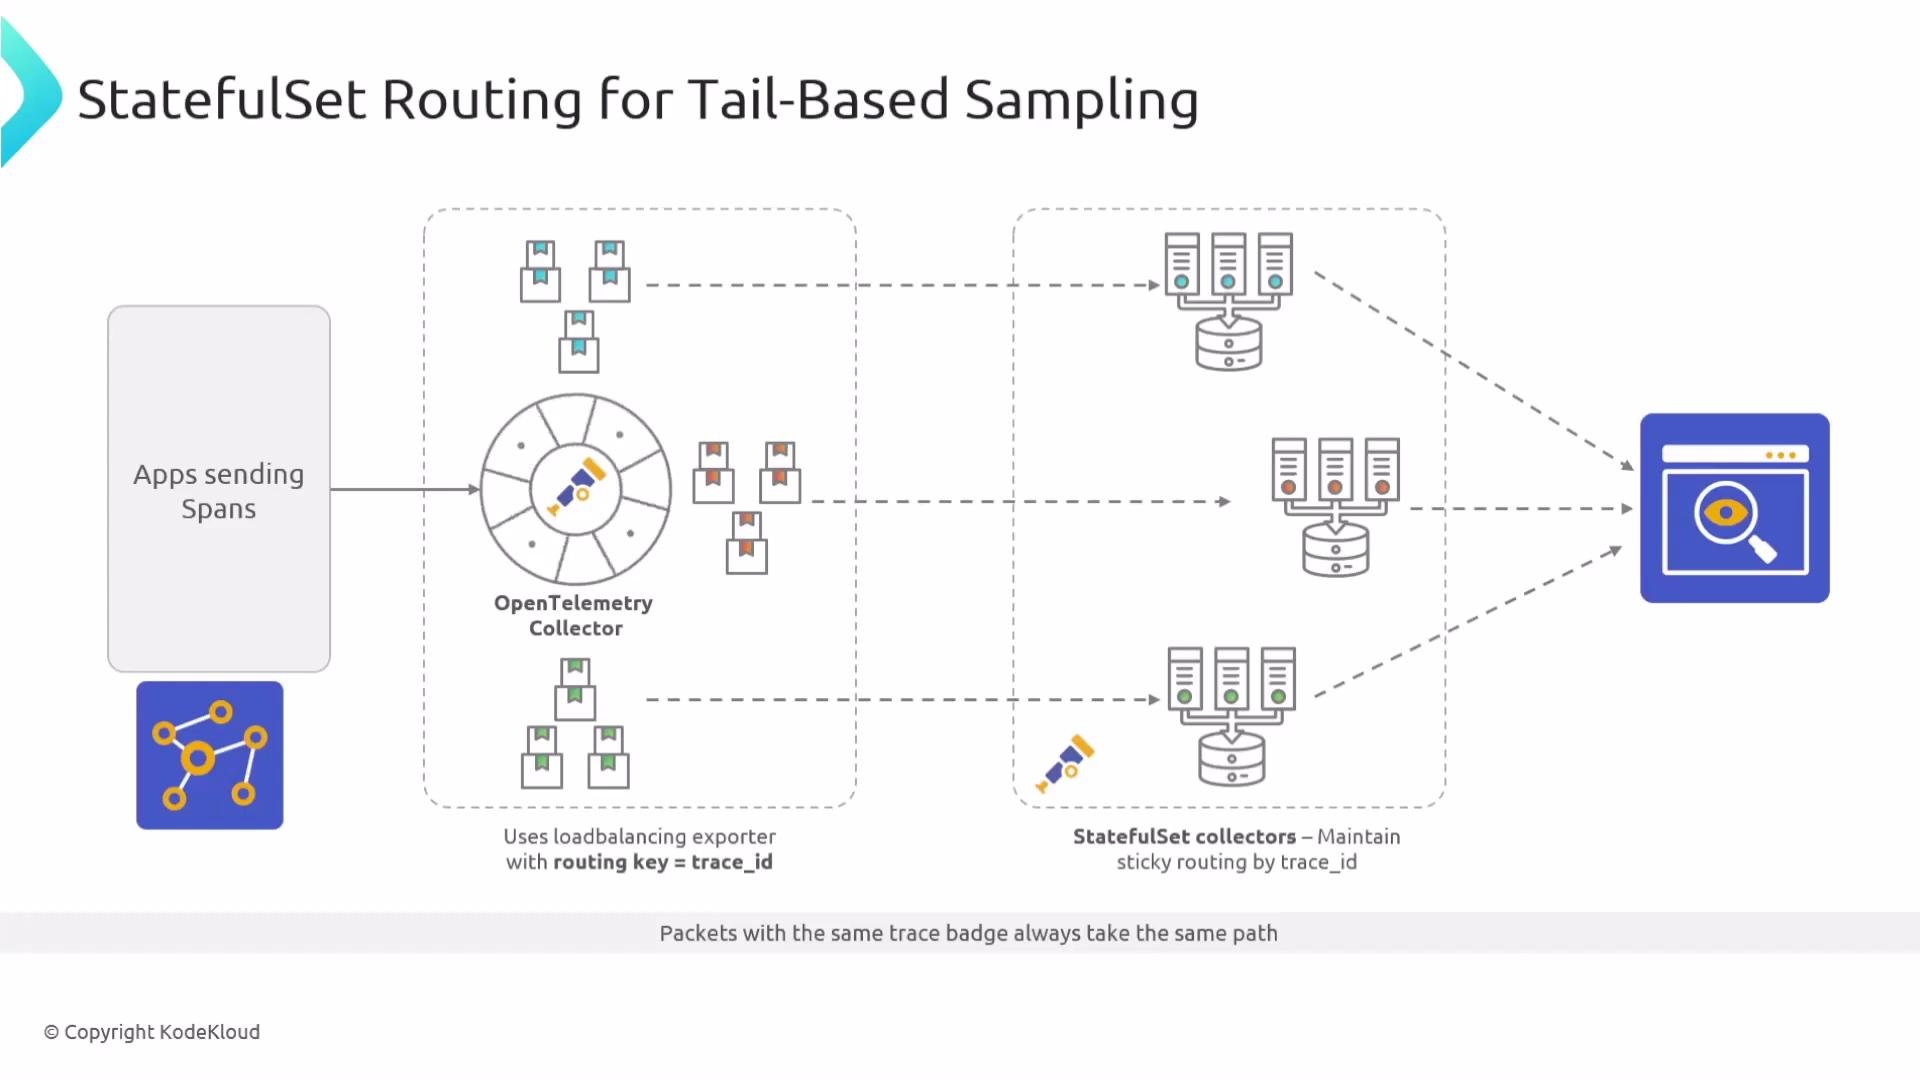
Use StatefulSets when collectors require stable network identity and persistent storage (PVC). This is useful for Prometheus-style scraping (to keep target assignment consistent) and for tail-based sampling where traces must consistently arrive at the same collector.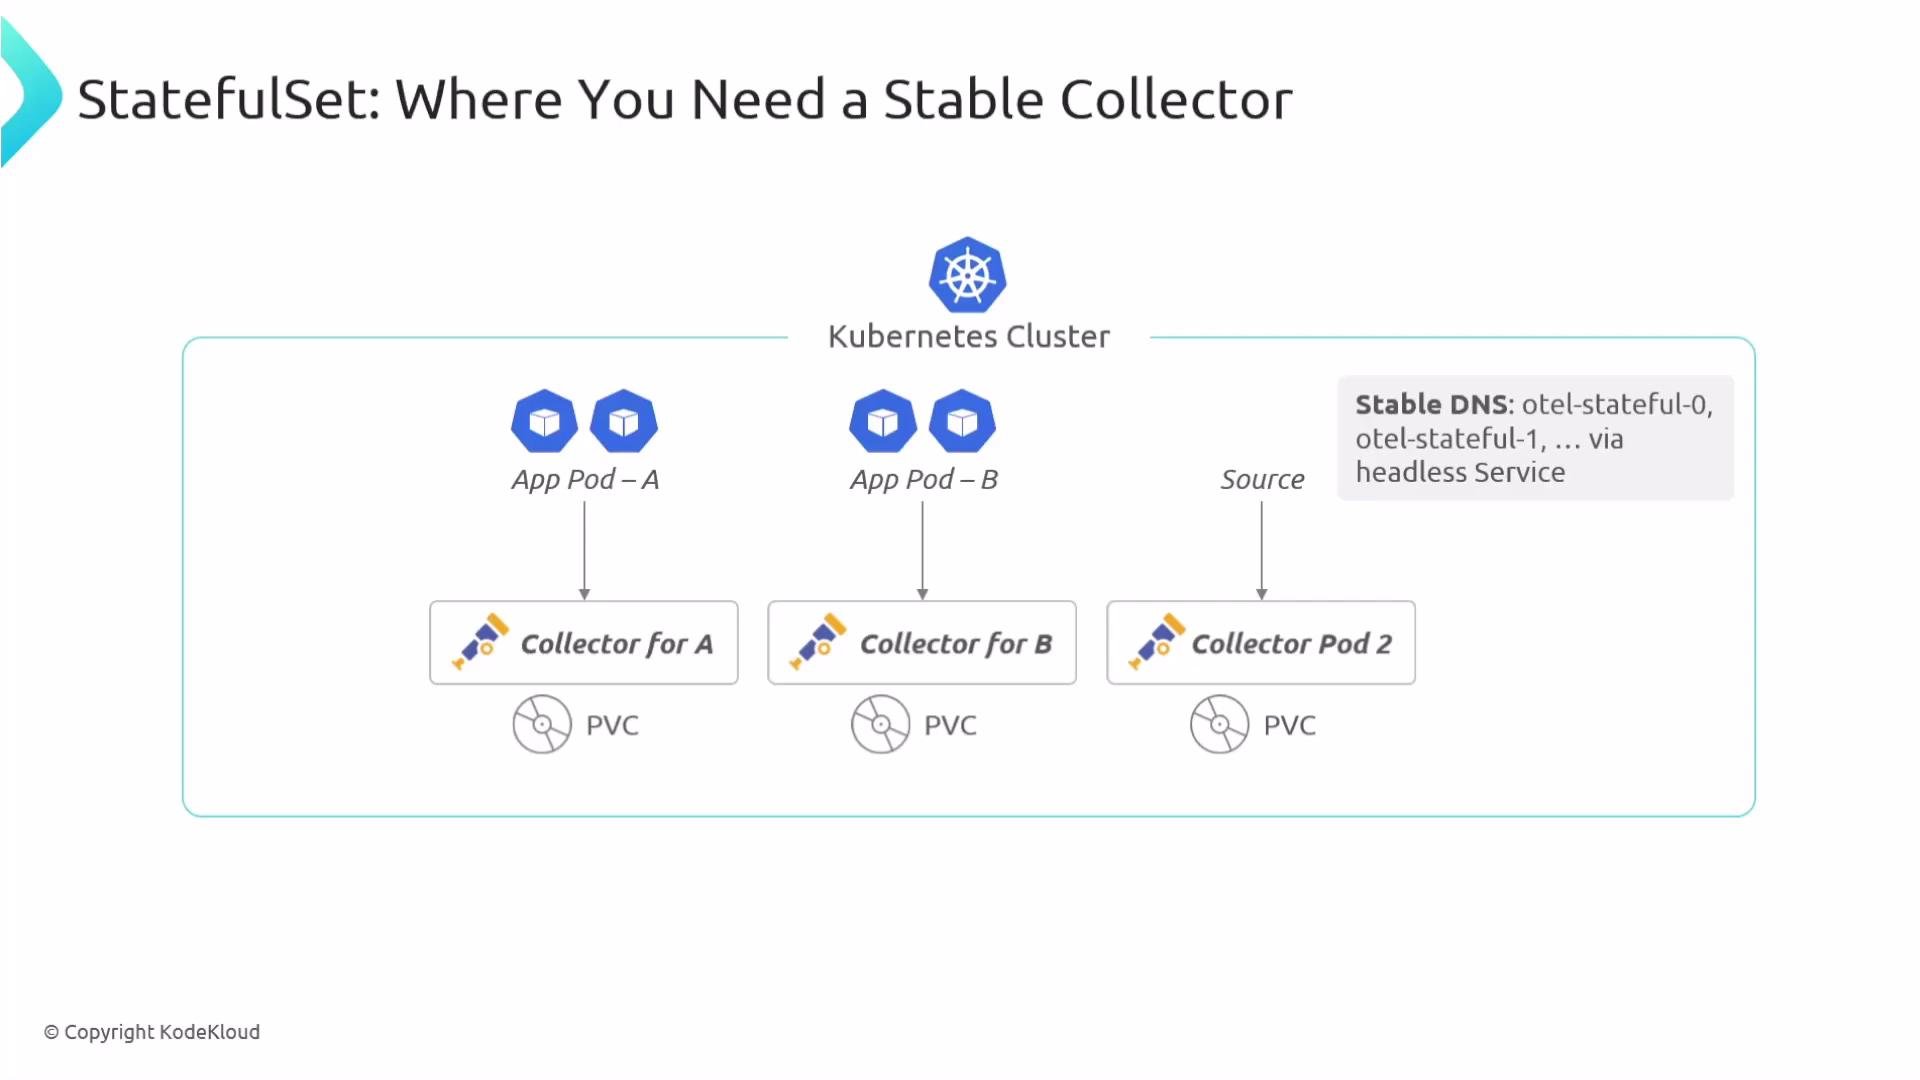
- Stable DNS and identity per pod.
- A dedicated PVC per pod for durable storage or queue persistence.
- Predictable mapping between collectors and targets for scraping and sticky routing.
TargetAllocator (operator feature)
The TargetAllocator decouples service discovery from scraping so both can scale independently. It generates Prometheus receiver configs and assigns scrape targets across collector pods. Combined with StatefulSets (stable identities), the TargetAllocator can assign a fixed subset of targets to each collector to prevent duplicate scraping and balance load.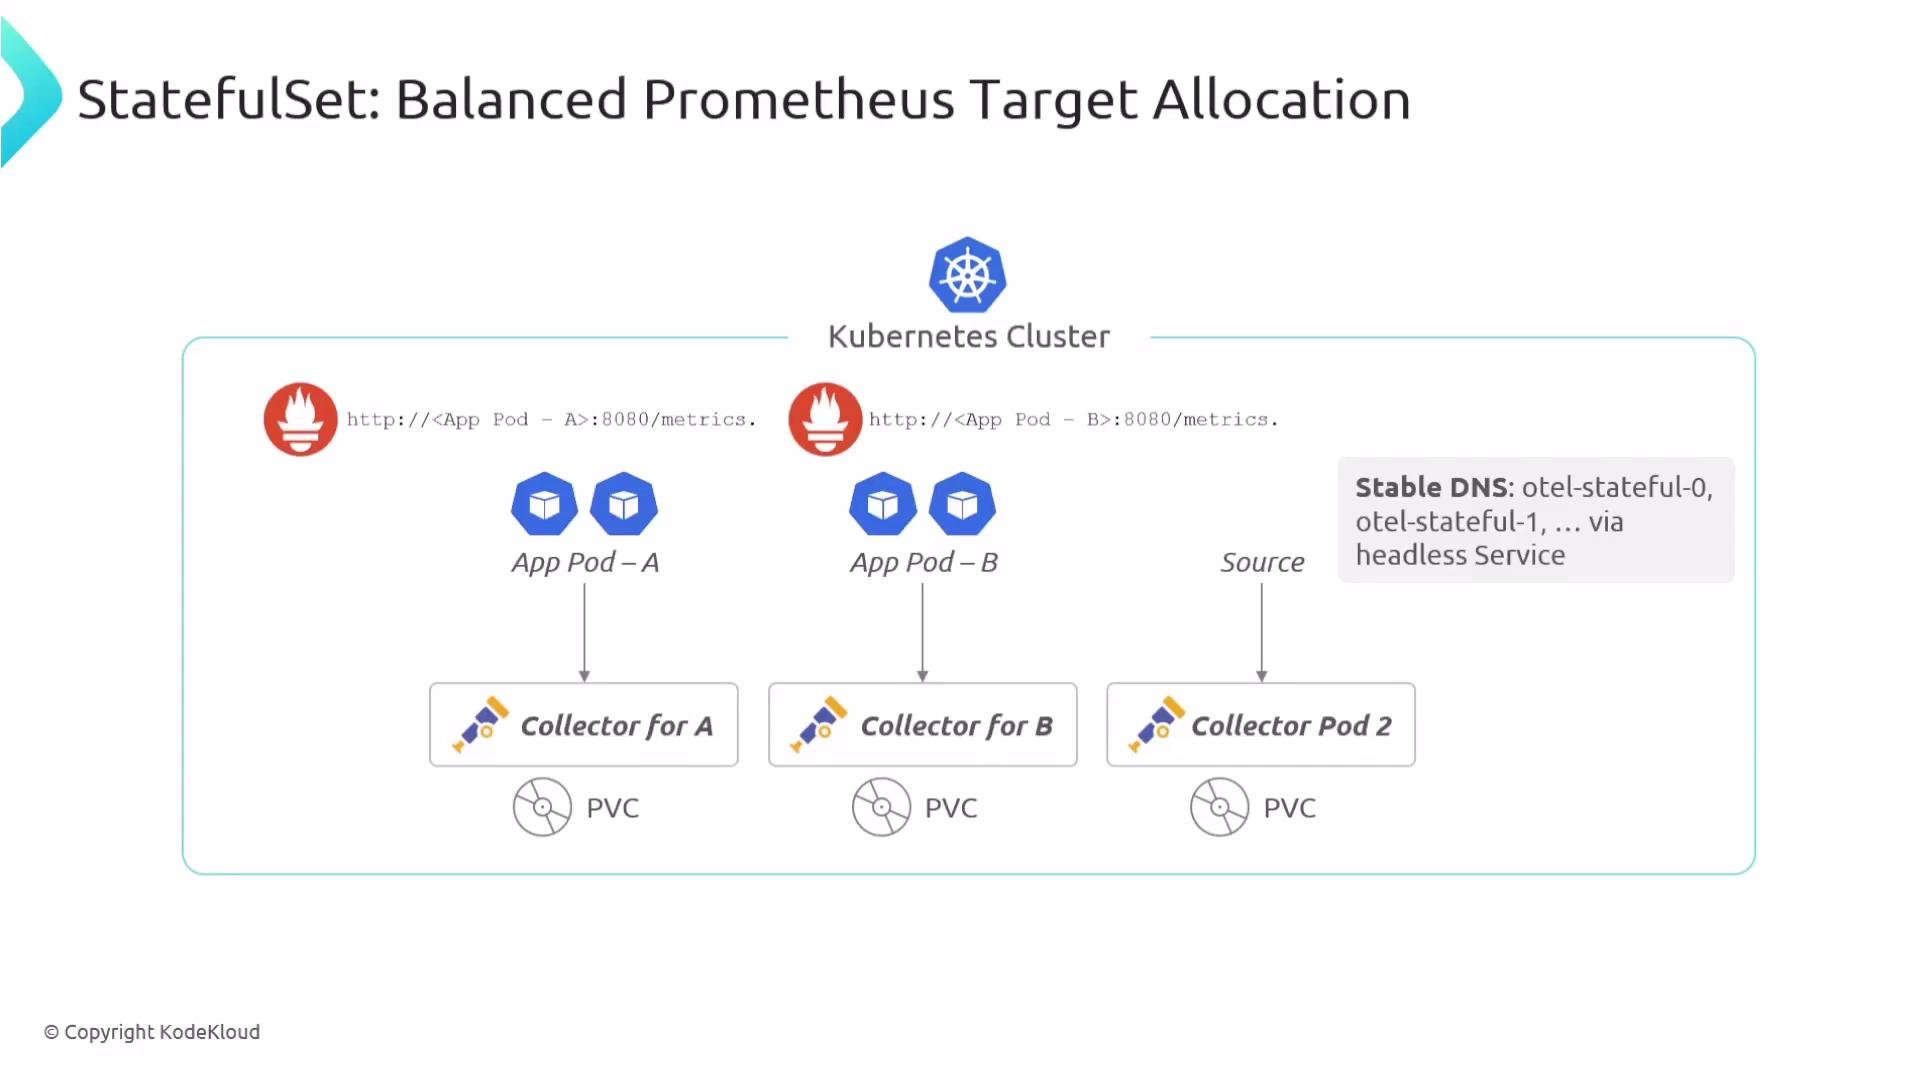
Comparison at-a-glance
Recap
- Deployment (gateway): central, stateless, load-balanced, cluster-wide aggregation and processing.
- DaemonSet: one collector per node—ideal for kubelet stats, host metrics, and node-local logs.
- Sidecar: collector in the same pod as the application—ideal for per-application isolation and minimal network hops.
- StatefulSet: collectors with stable identity and persistent storage—ideal for consistent scraping assignments and tail-based sampling.
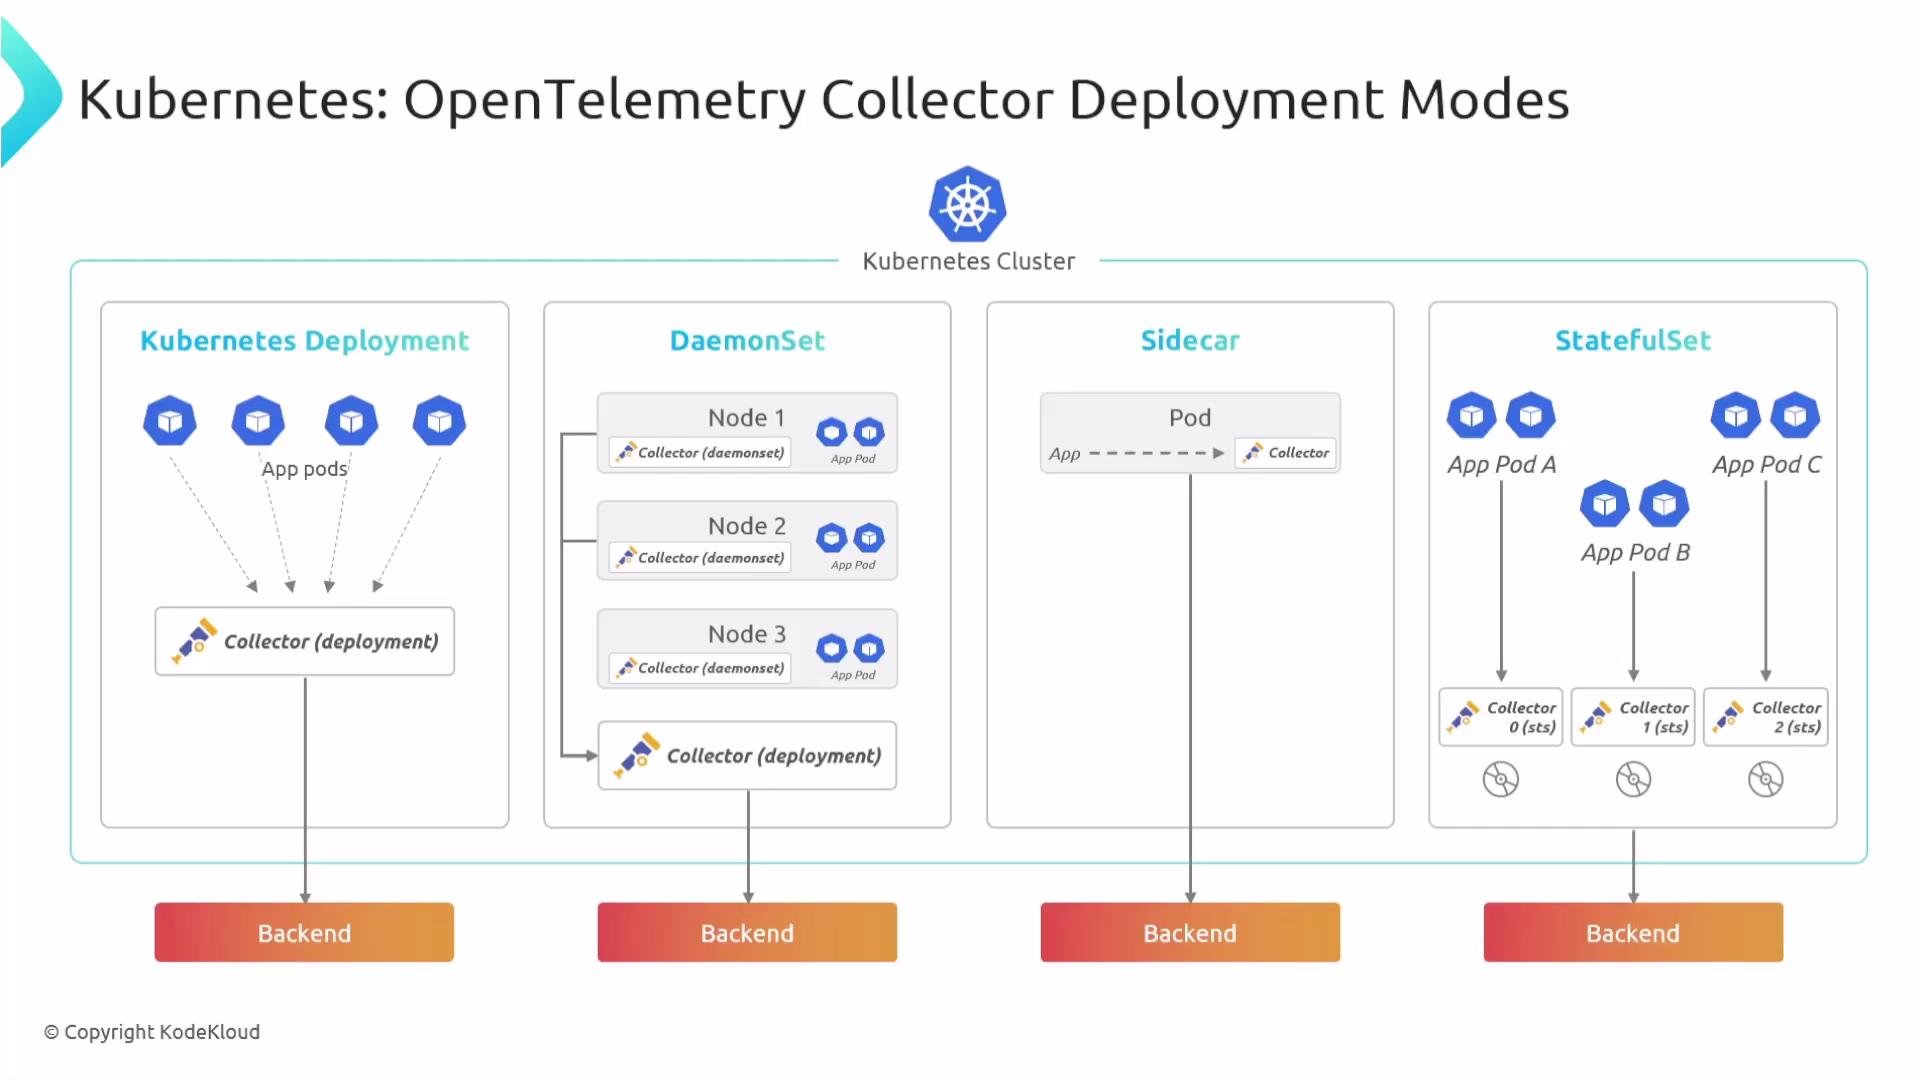
Choose the deployment mode based on the telemetry type (node vs pod vs cluster-wide), the need for persistent storage or sticky routing, and your scalability/availability goals. Hybrid architectures (e.g., DaemonSet + gateway Deployment or sidecars with a central gateway) are common and provide a good balance between locality and centralized processing.
- OpenTelemetry Collector (official)
- OpenTelemetry Operator
- Kubernetes DaemonSet Documentation
- Kubernetes StatefulSet Documentation
- Prometheus Target Allocation Patterns