

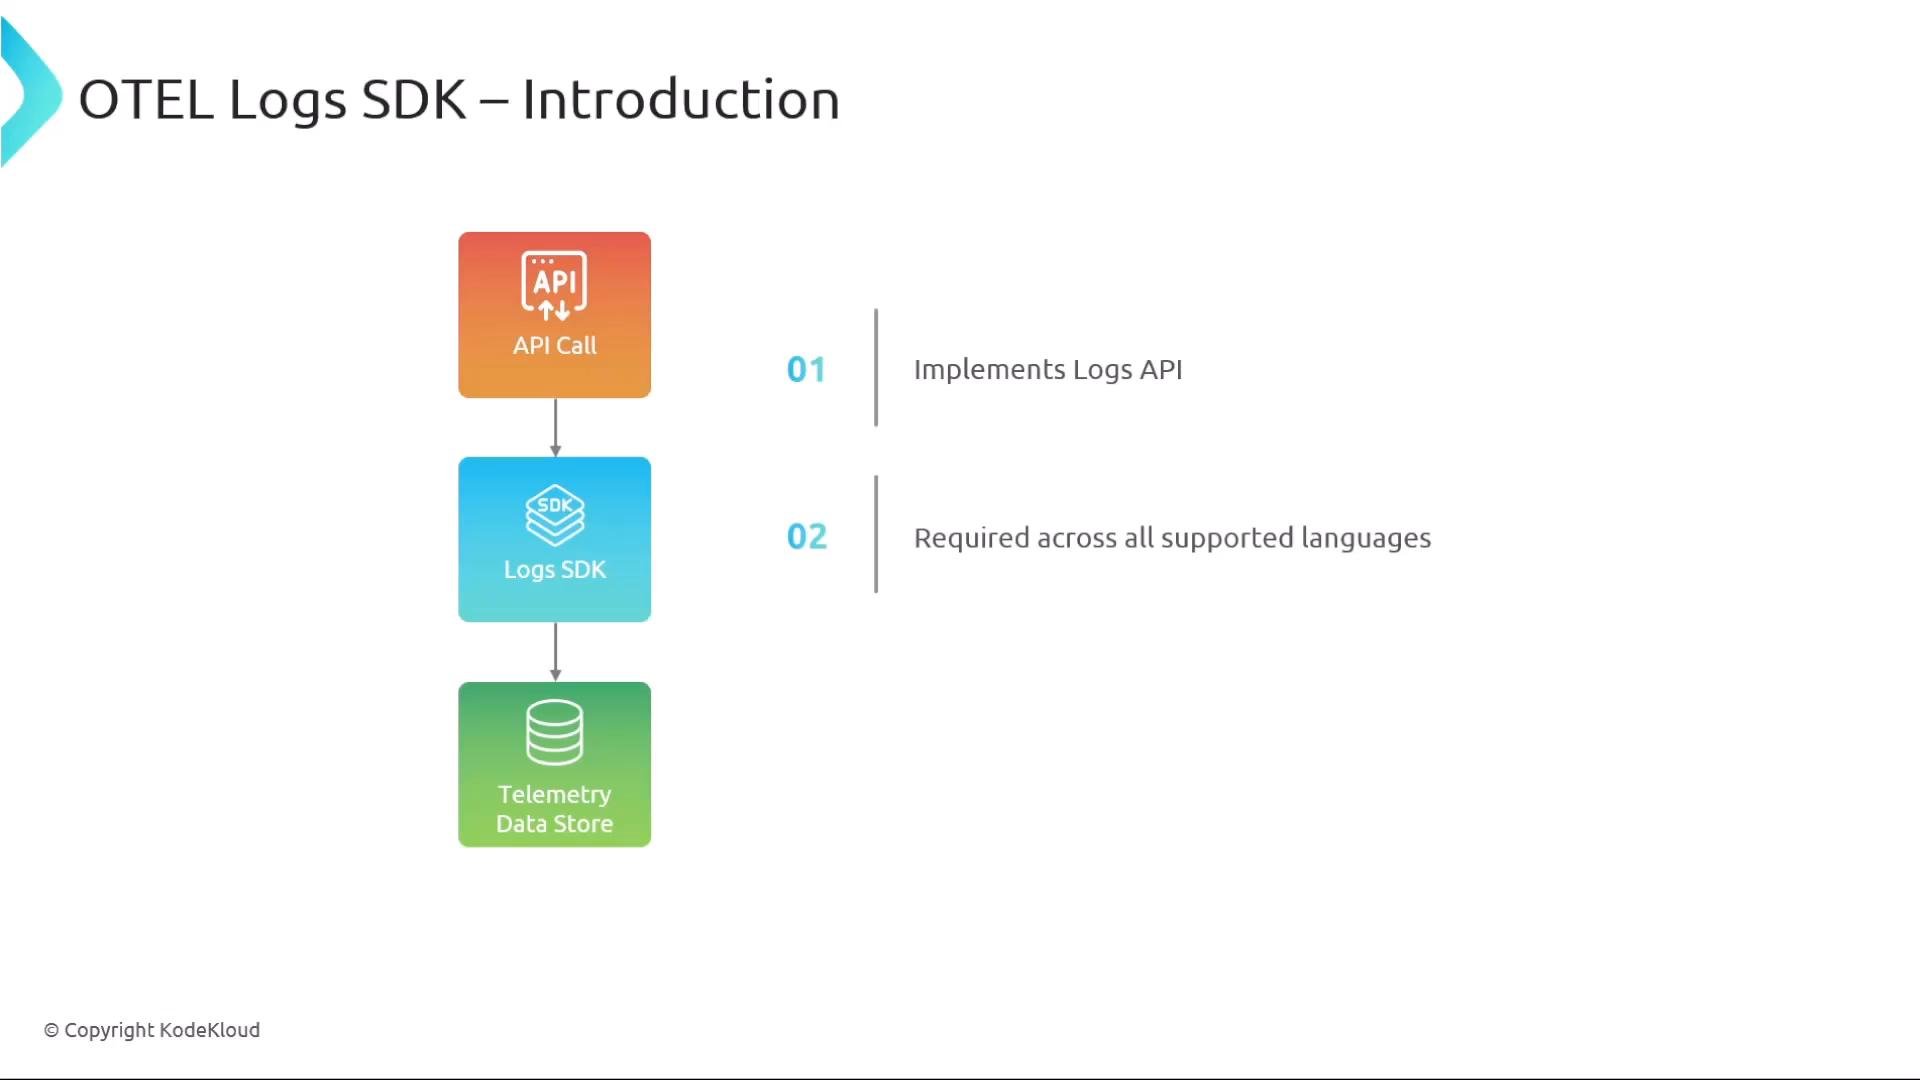
Key concepts overview
- Logs SDK: receives log calls from instrumentation and routes log records through processors to exporters.
- LoggerProvider: factory and shared configuration container for loggers.
- Logger / Instrumentation Scope: library/component-specific logger obtained from the provider.
- LogRecordProcessor: manages buffering, batching, filtering, or enrichment.
- LogRecordExporter: sends logs to final destinations (OTLP, cloud backends, files, etc.).
- Lifecycle APIs:
ForceFlushandShutdownto ensure reliable termination.
LoggerProvider (factory and configuration)
LoggerProvider is the factory that creates named loggers and stores shared configuration like Resource (service name, environment, host metadata). Multiple providers can be used to isolate configuration for different subsystems.
- Embed a
Resourceto annotate exported logs with service and environment metadata. - Use separate providers when you need isolated pipelines or export settings per subsystem.
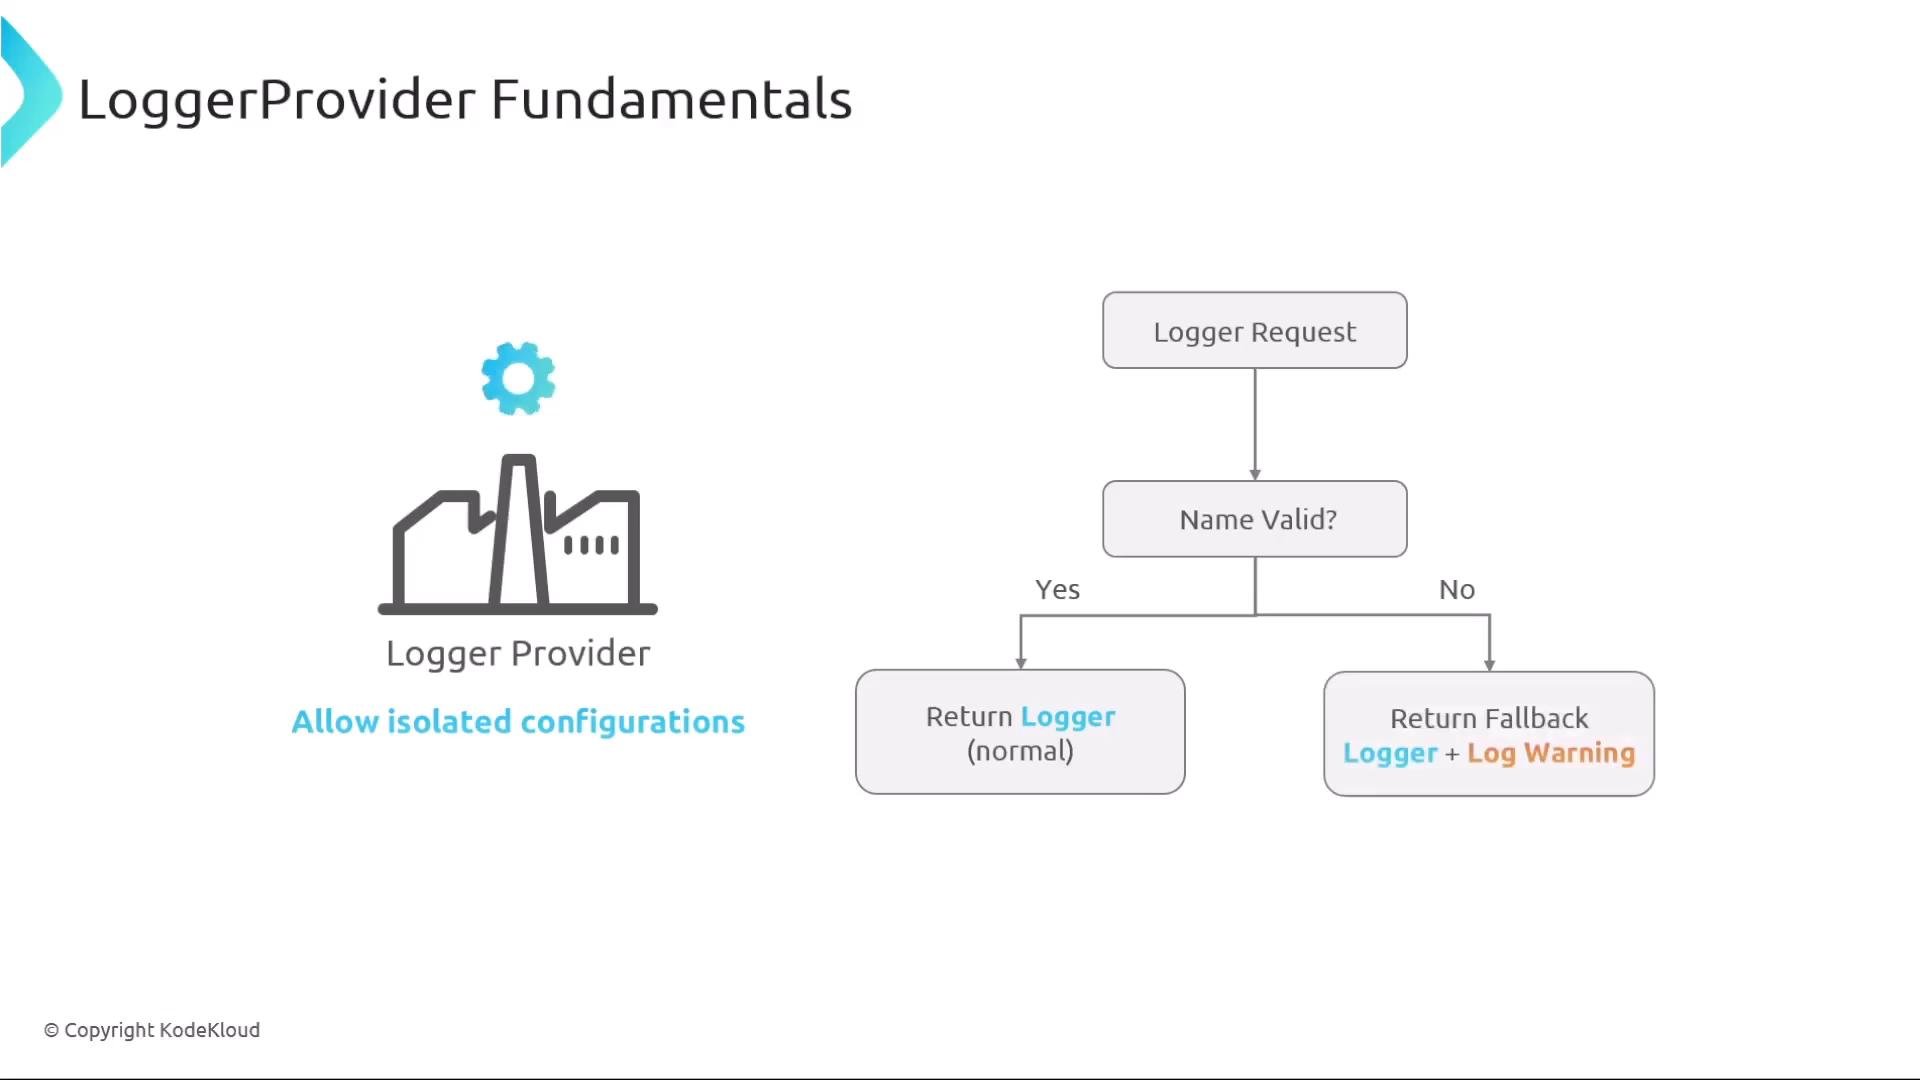
GetLogger / get_logger), the provider returns a logger tied to that instrumentation scope name. Some SDKs validate names; invalid names may produce a fallback/no-op logger and a warning — behavior varies by language.
Example: getting a logger and Provider behavior (pseudocode)
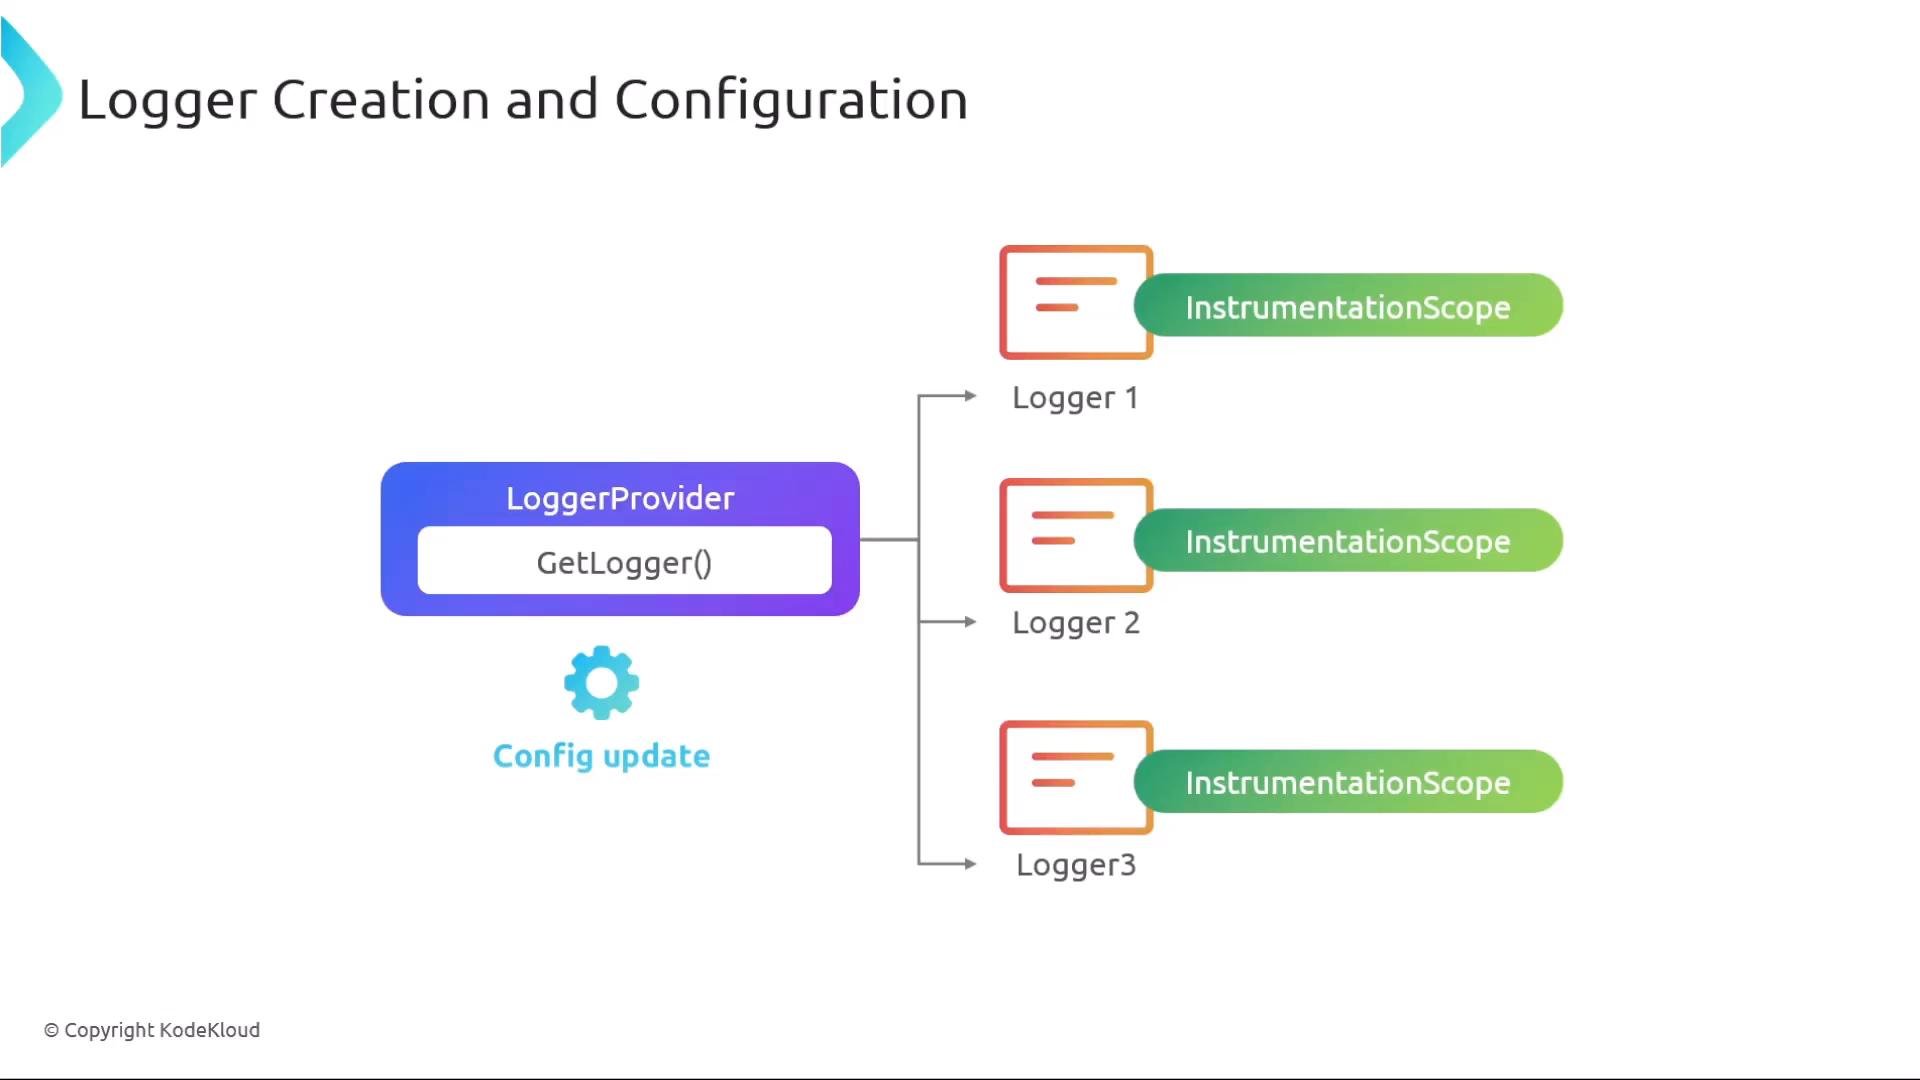
Logger lifetime and dynamic provider updates
Loggers are obtained from the provider rather than created directly. Because loggers reference provider configuration, runtime updates to theLoggerProvider — such as adding a new LogRecordProcessor or changing exporter settings — will typically apply to all loggers obtained from that provider (including existing loggers). This allows you to change export behavior centrally without recreating logger instances.
Example pattern:
- Add a
BatchingProcessoror switch exporters on the provider. - Existing loggers (Logger1, Logger2, Logger3) pick up the new pipeline immediately in most SDK implementations.
Lifecycle: ForceFlush and Shutdown
The SDK exposes lifecycle APIs to control export behavior at process termination:ForceFlush()— force any buffered log records to be exported immediately (helpful before exit).Shutdown()— stop accepting new log records and ensure processors/exporters finish and release resources.
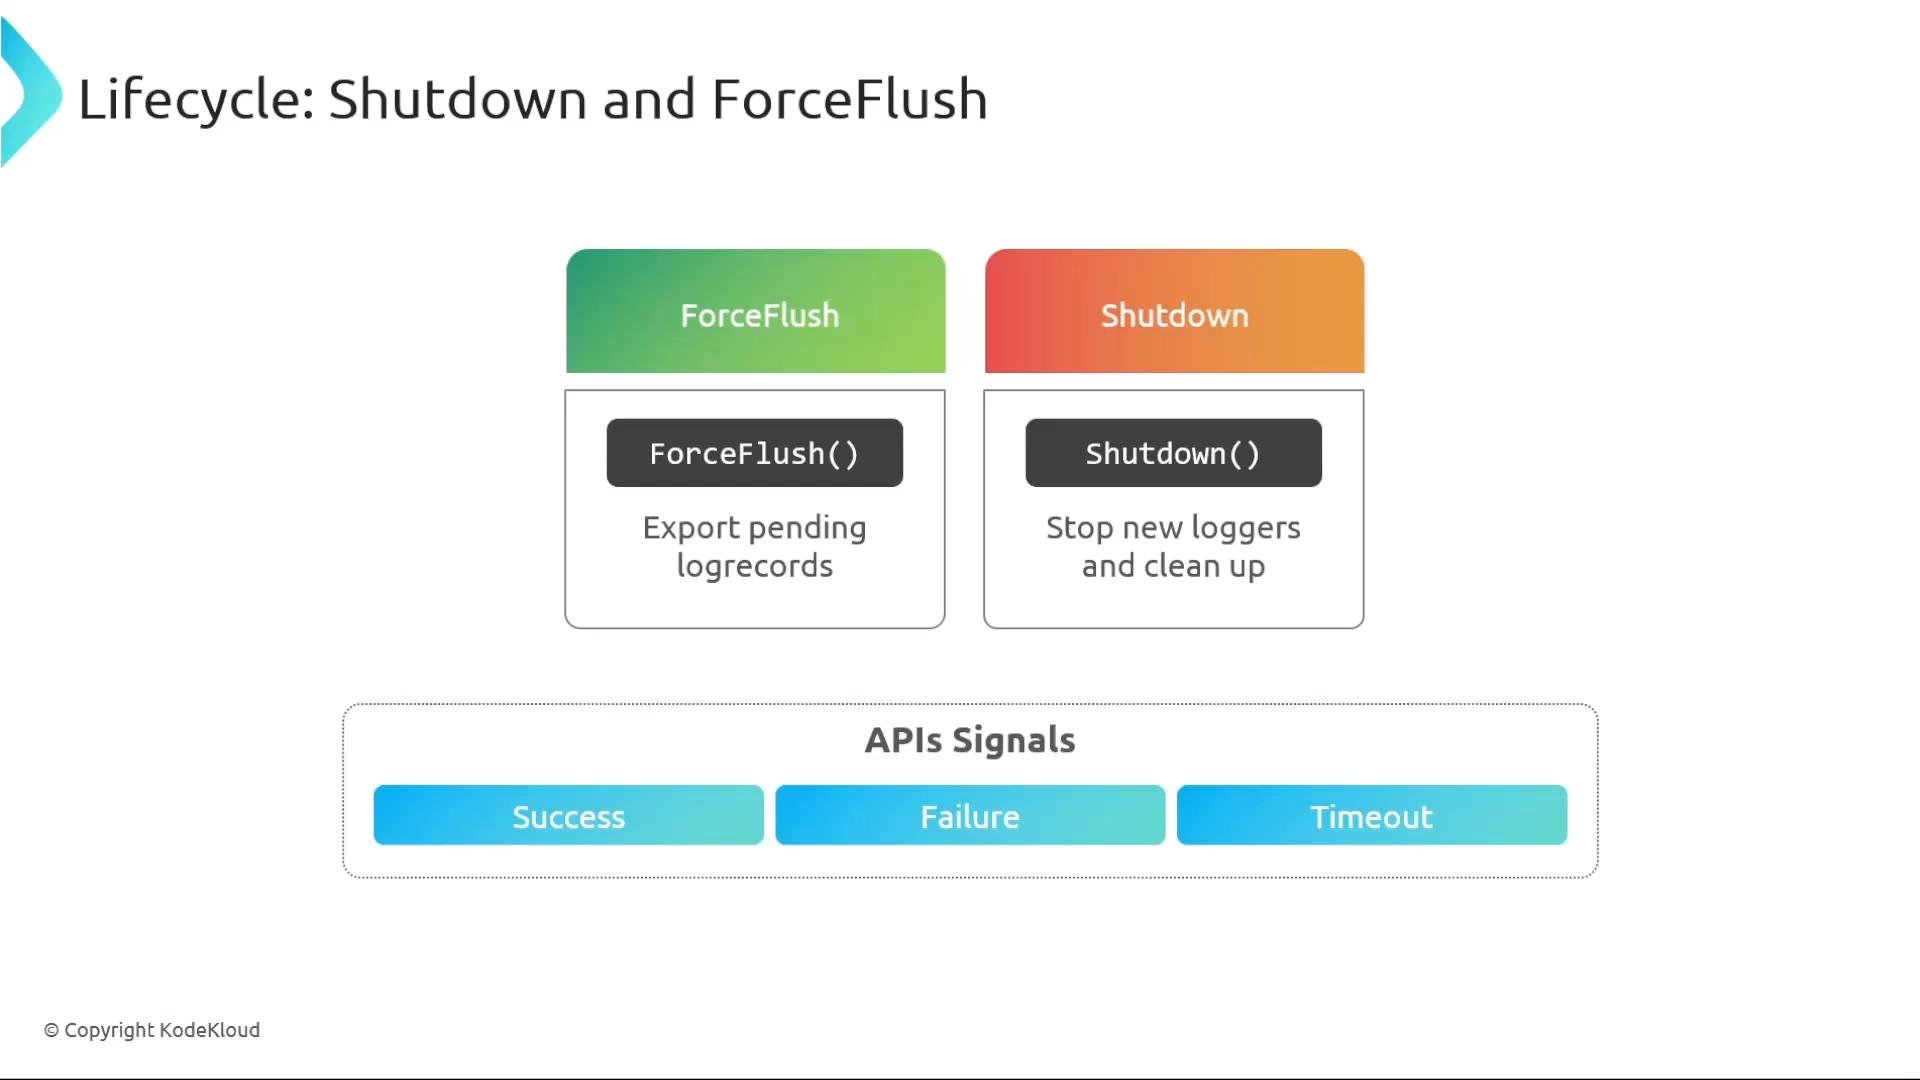
Recommended shutdown sequence (pseudocode)
LogRecordProcessor types and responsibilities
LogRecordProcessors determine when and how log records move from the SDK to exporters:- SimpleProcessor — exports each record synchronously (low-latency, high overhead; useful for debugging).
- BatchingProcessor — buffers records and exports in batches based on size/interval thresholds (production-friendly).
- CustomProcessor — implement enrichment, filtering, routing, or any specialized logic (analogous to custom span processors).
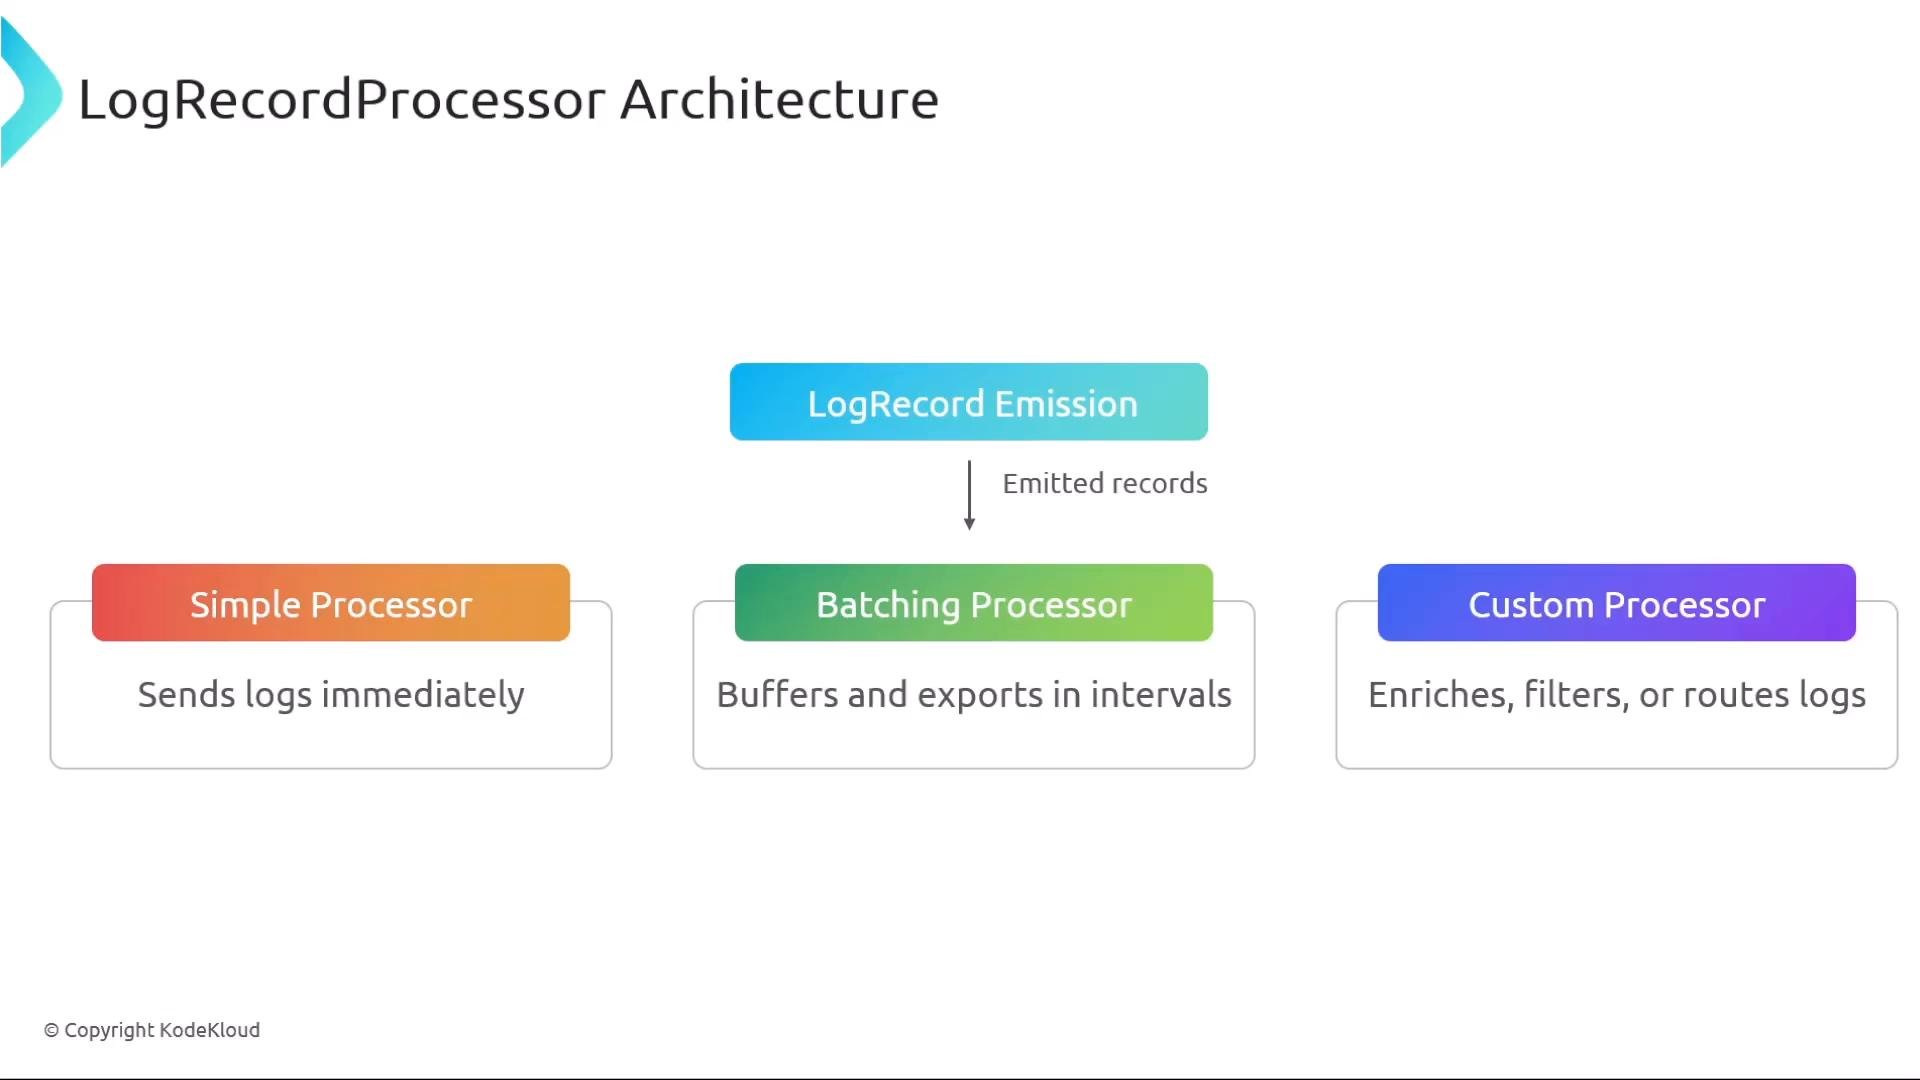
LogRecordProcessors are conceptually similar to span processors: they control retries, batching, and filtering, and determine when exporters are invoked.
LogRecordExporter responsibilities
TheLogRecordExporter sends log batches to the final destination (OTLP endpoints, cloud logging services, files, etc.). Exporters typically expose:
Export(batch)— export one batch of log records (must be thread-safe and respect timeouts).Shutdown()— release network/file resources on termination.- A clear export result/status so processors can decide to retry or drop records.
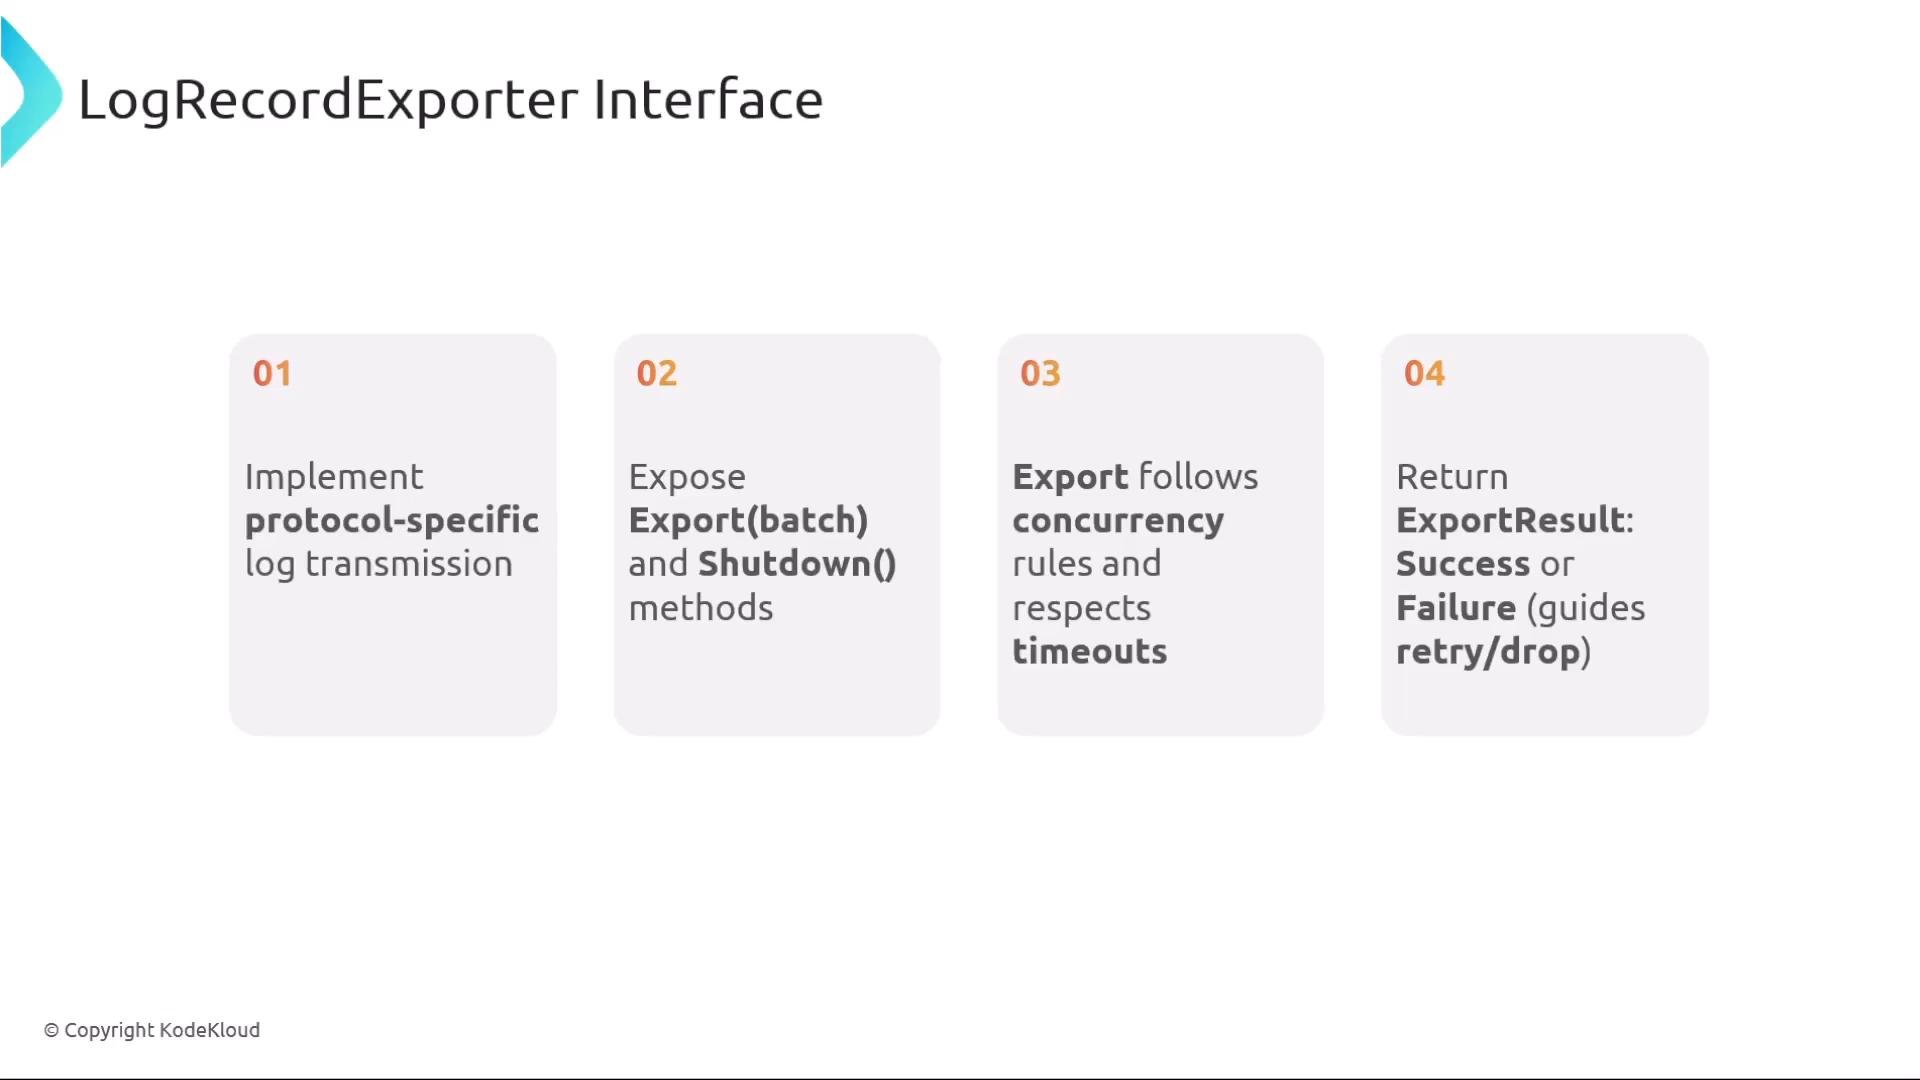
- Ensure
Exportis safe for concurrent calls from multiple processors or threads. - Respect configured timeouts and return clear success/failure statuses.
- Implement
Shutdown()to prevent resource leaks and to allow graceful process exit.
Core components at a glance
When integrating logging, ensure exporters and processors respect timeouts and are shut down cleanly during application termination. Call
ForceFlush before Shutdown to minimize data loss.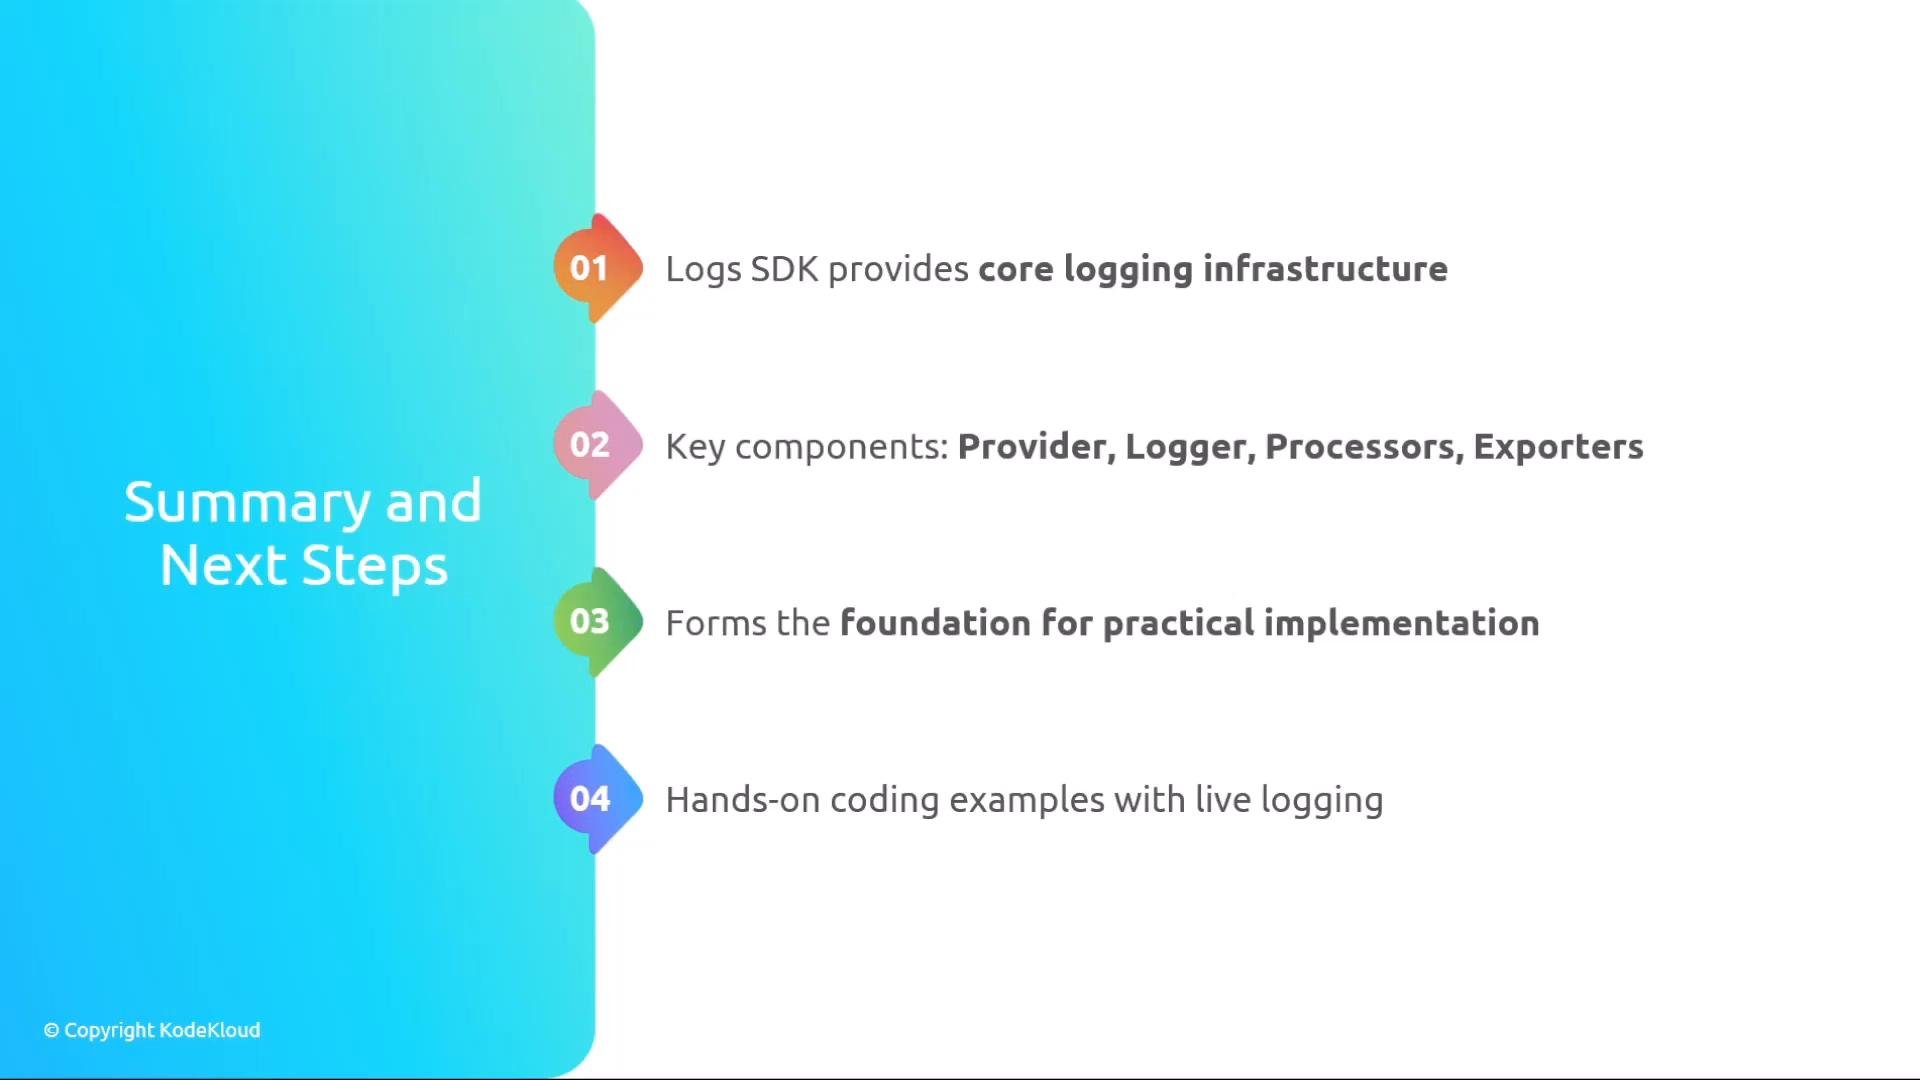
References and further reading
- OpenTelemetry Documentation
- OpenTelemetry Logs Specification
- SDK-specific docs (look up language-specific
LoggerProvider, processors, and exporter implementations for best practices and API details)
LoggerProvider with a batching processor and an OTLP exporter in your preferred language.