

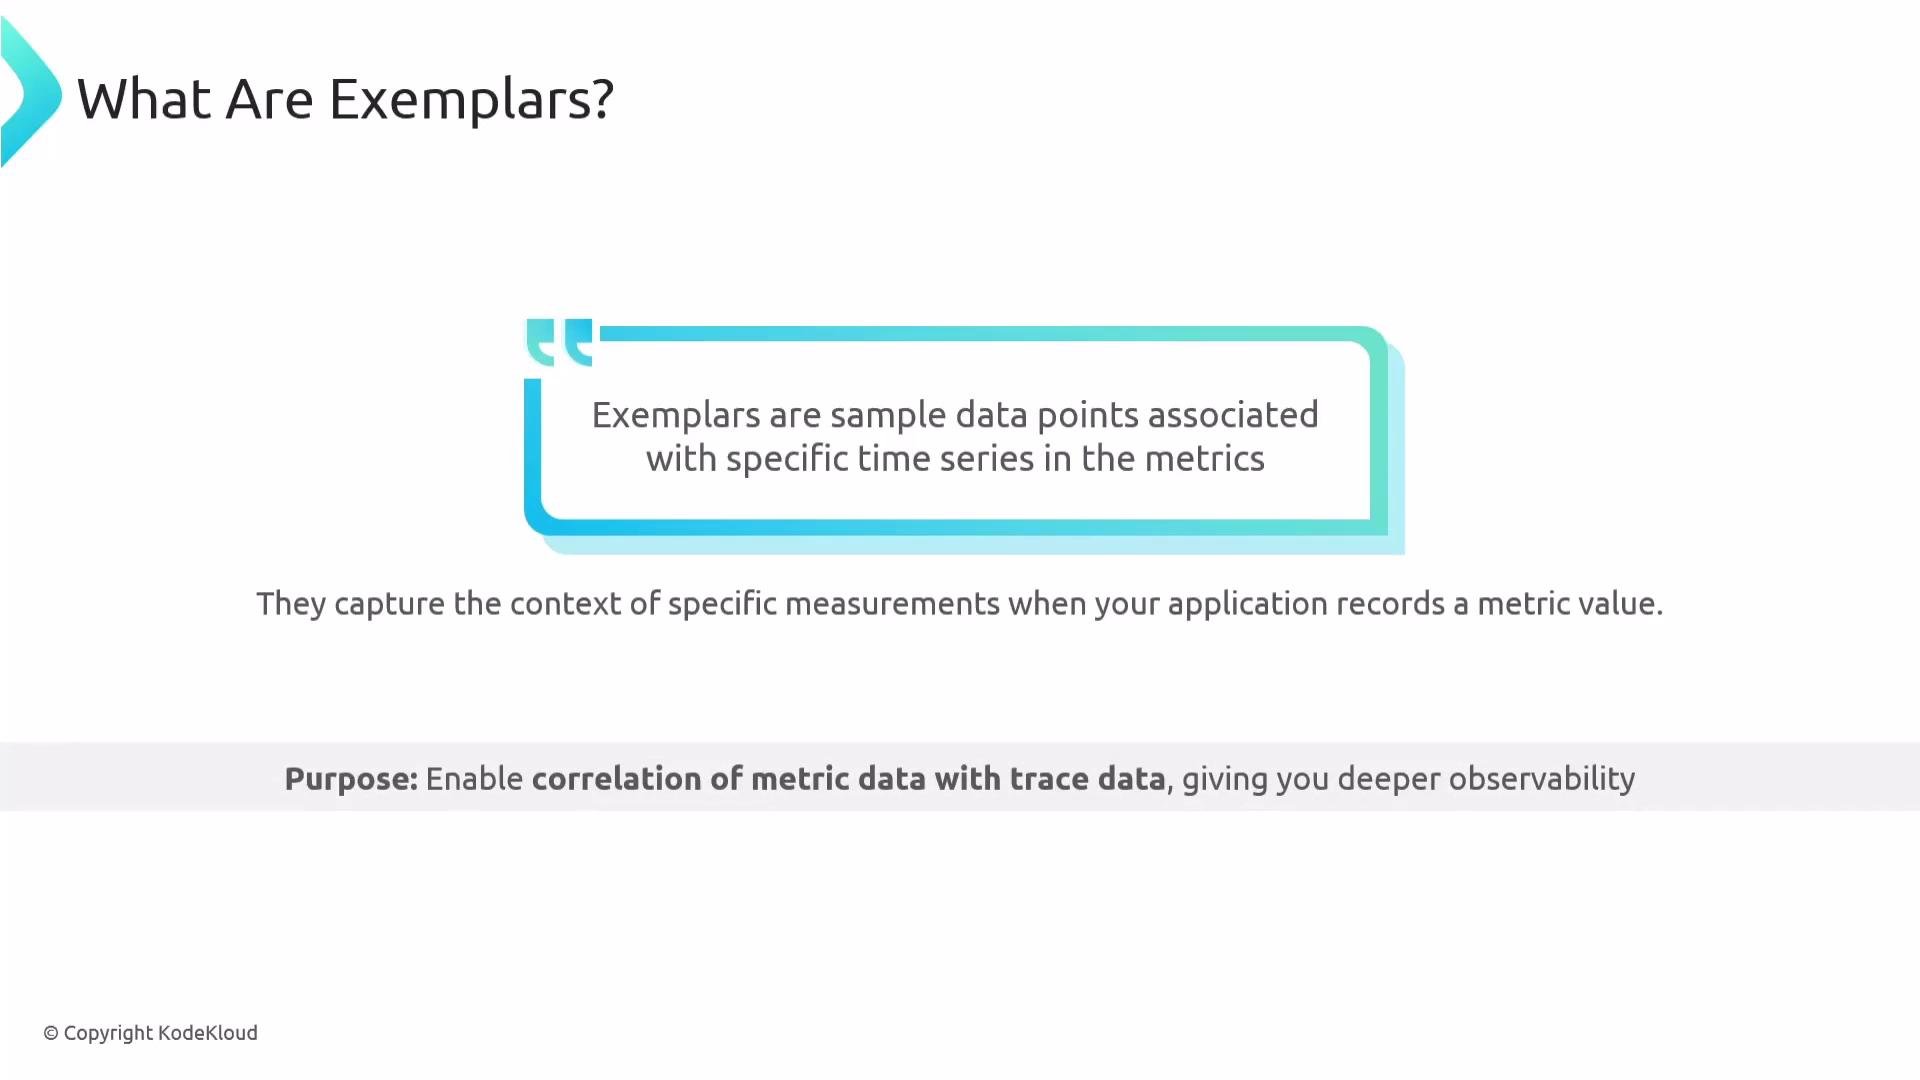
- They enrich metrics with non-metric context (trace IDs, span IDs, and filtered attributes), turning raw numbers into actionable signals.
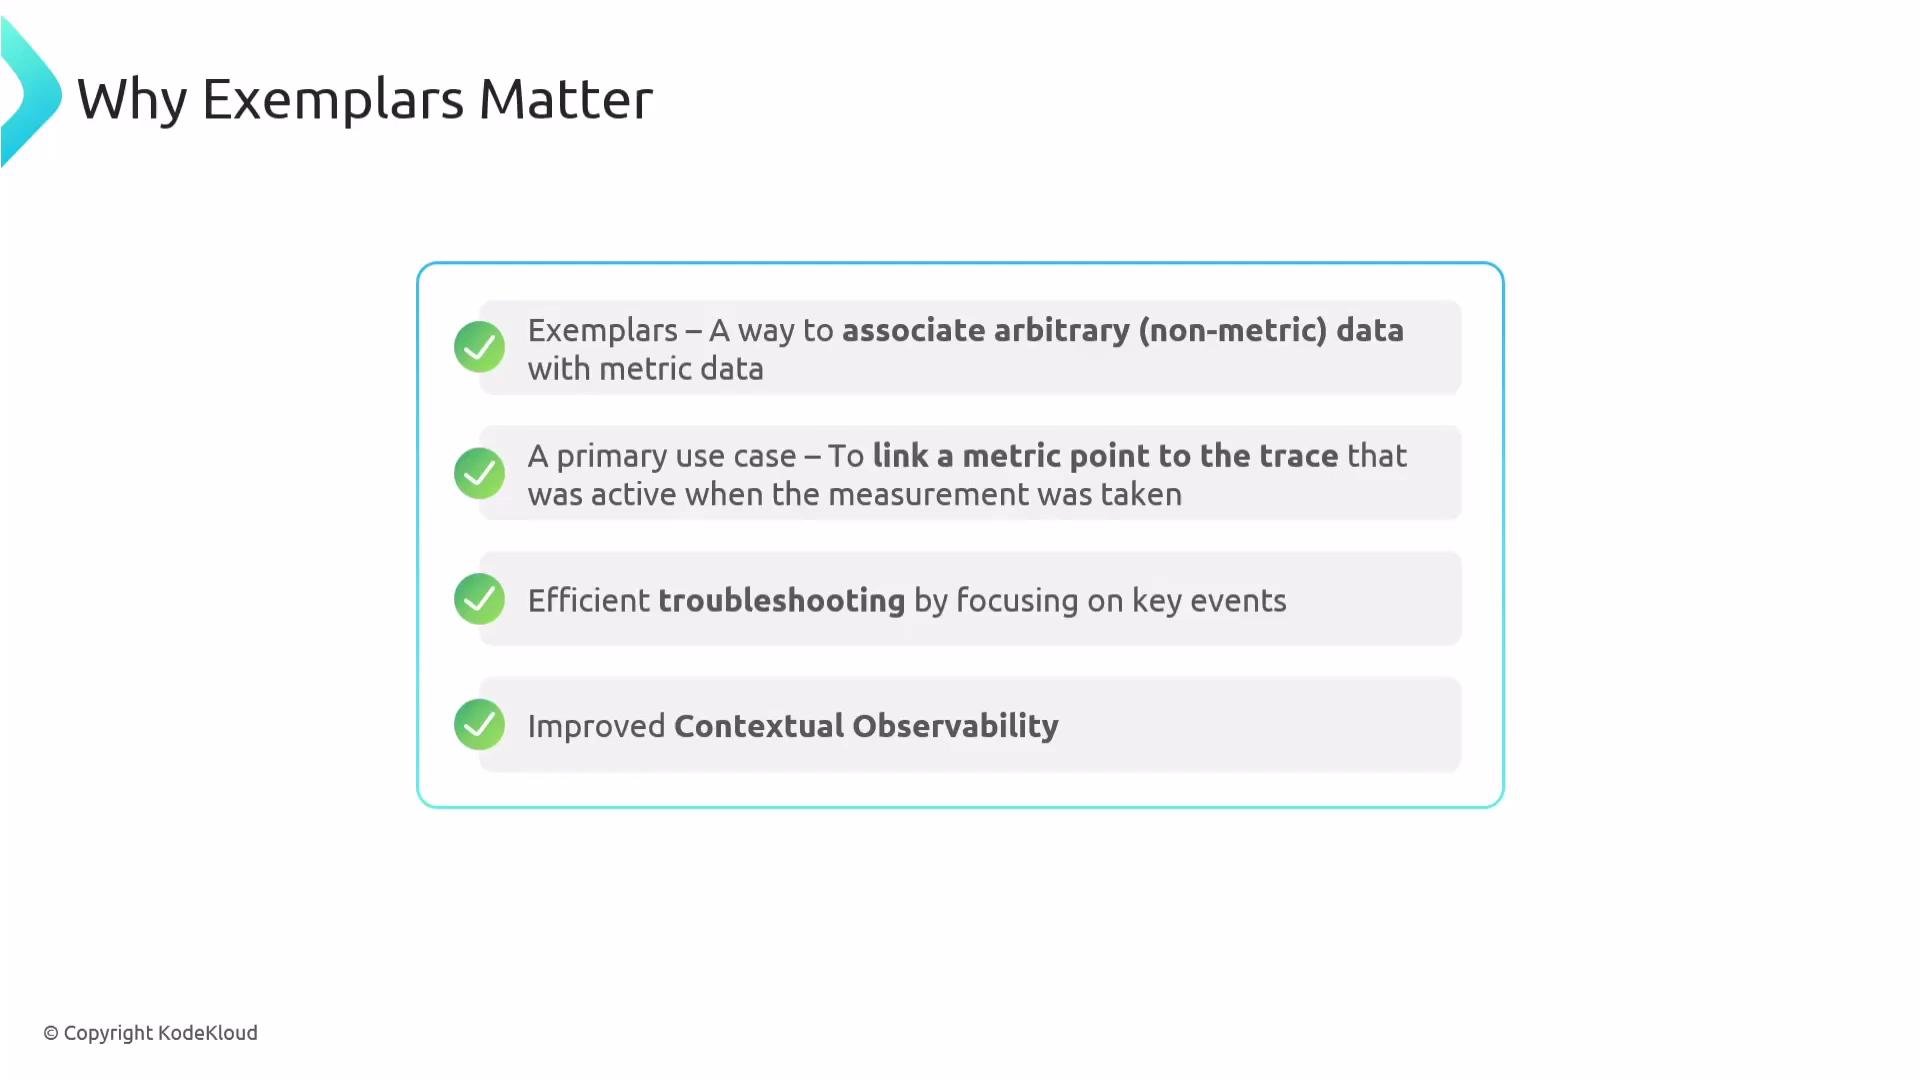
- The primary use case is linking a metric data point directly to the trace that was active when the measurement occurred, enabling rapid investigation.
- Exemplars speed up root-cause analysis by letting you navigate from an outlier metric point straight to the trace details.
- They improve observability by providing the “why” behind metric changes, not just the “what.”
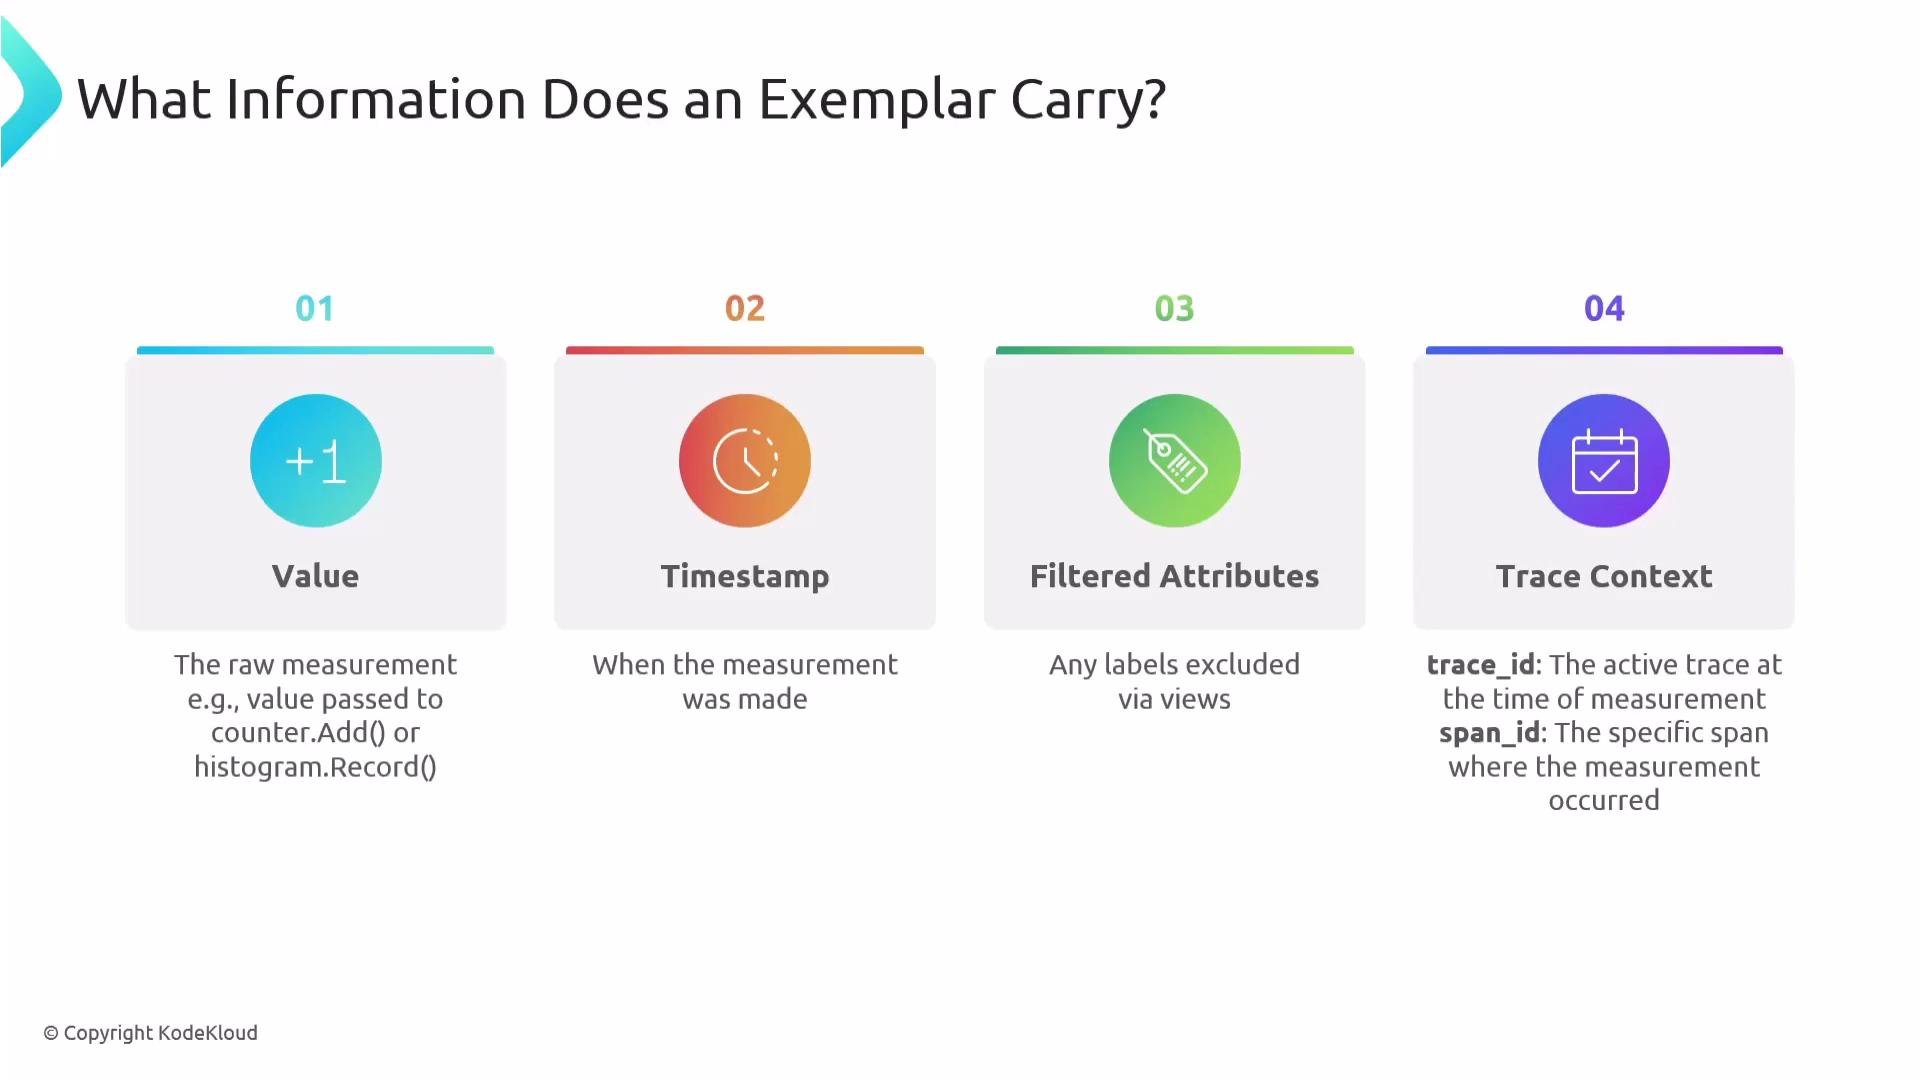
- Value: the measurement itself (e.g., the value passed to
counter.Add()orhistogram.Record()). - Timestamp: the exact time the measurement was recorded.
- Filtered attributes: labels that remain after any views/filters are applied to reduce noise while preserving useful context.
- Trace context: the trace ID and span ID linking the measurement to a distributed trace.
Enabling exemplars (C# / .NET)
Below is a typical .NET MeterProvider configuration that enables trace-based exemplars and exports metrics to both the console and an OTLP collector endpoint:
Setting
SetExemplarFilter(ExemplarFilterType.TraceBased) tells the OpenTelemetry SDK to attach trace and span IDs to metric measurements when a trace is active, creating exemplars automatically.- Capture: When a metric is recorded and there is an active trace, the metrics SDK captures the trace ID and span ID and attaches them to that measurement as an exemplar.
- Export: Exemplars are exported along with metric data to your observability backend (for example, an OTLP collector).
- Visualization: The observability backend (the visualization layer) links and stitches metrics, traces, and logs so that exemplars can be displayed as clickable markers on charts. Clicking an exemplar usually reveals the trace ID and a link to the full trace.
- Correlation: Associate trace and attribute context with metric samples to get immediate context for metric anomalies.
- Faster troubleshooting: Jump from an anomalous metric point to the exact trace that produced it.
- Contextual observability: Move beyond isolated metrics to an integrated view of metrics, traces, and logs.
- Efficiency: Reduce time-to-resolution and improve resource utilization through clearer root-cause insights.
- Configure the SDK to enable exemplar filtering (e.g., trace-based exemplars).
- Record metrics in your instrumentation while traces are active.
- The SDK captures trace context for those measurements and emits exemplars with the metric data.
- The observability backend receives metrics and traces, stitches them together, and renders exemplar markers in the UI.
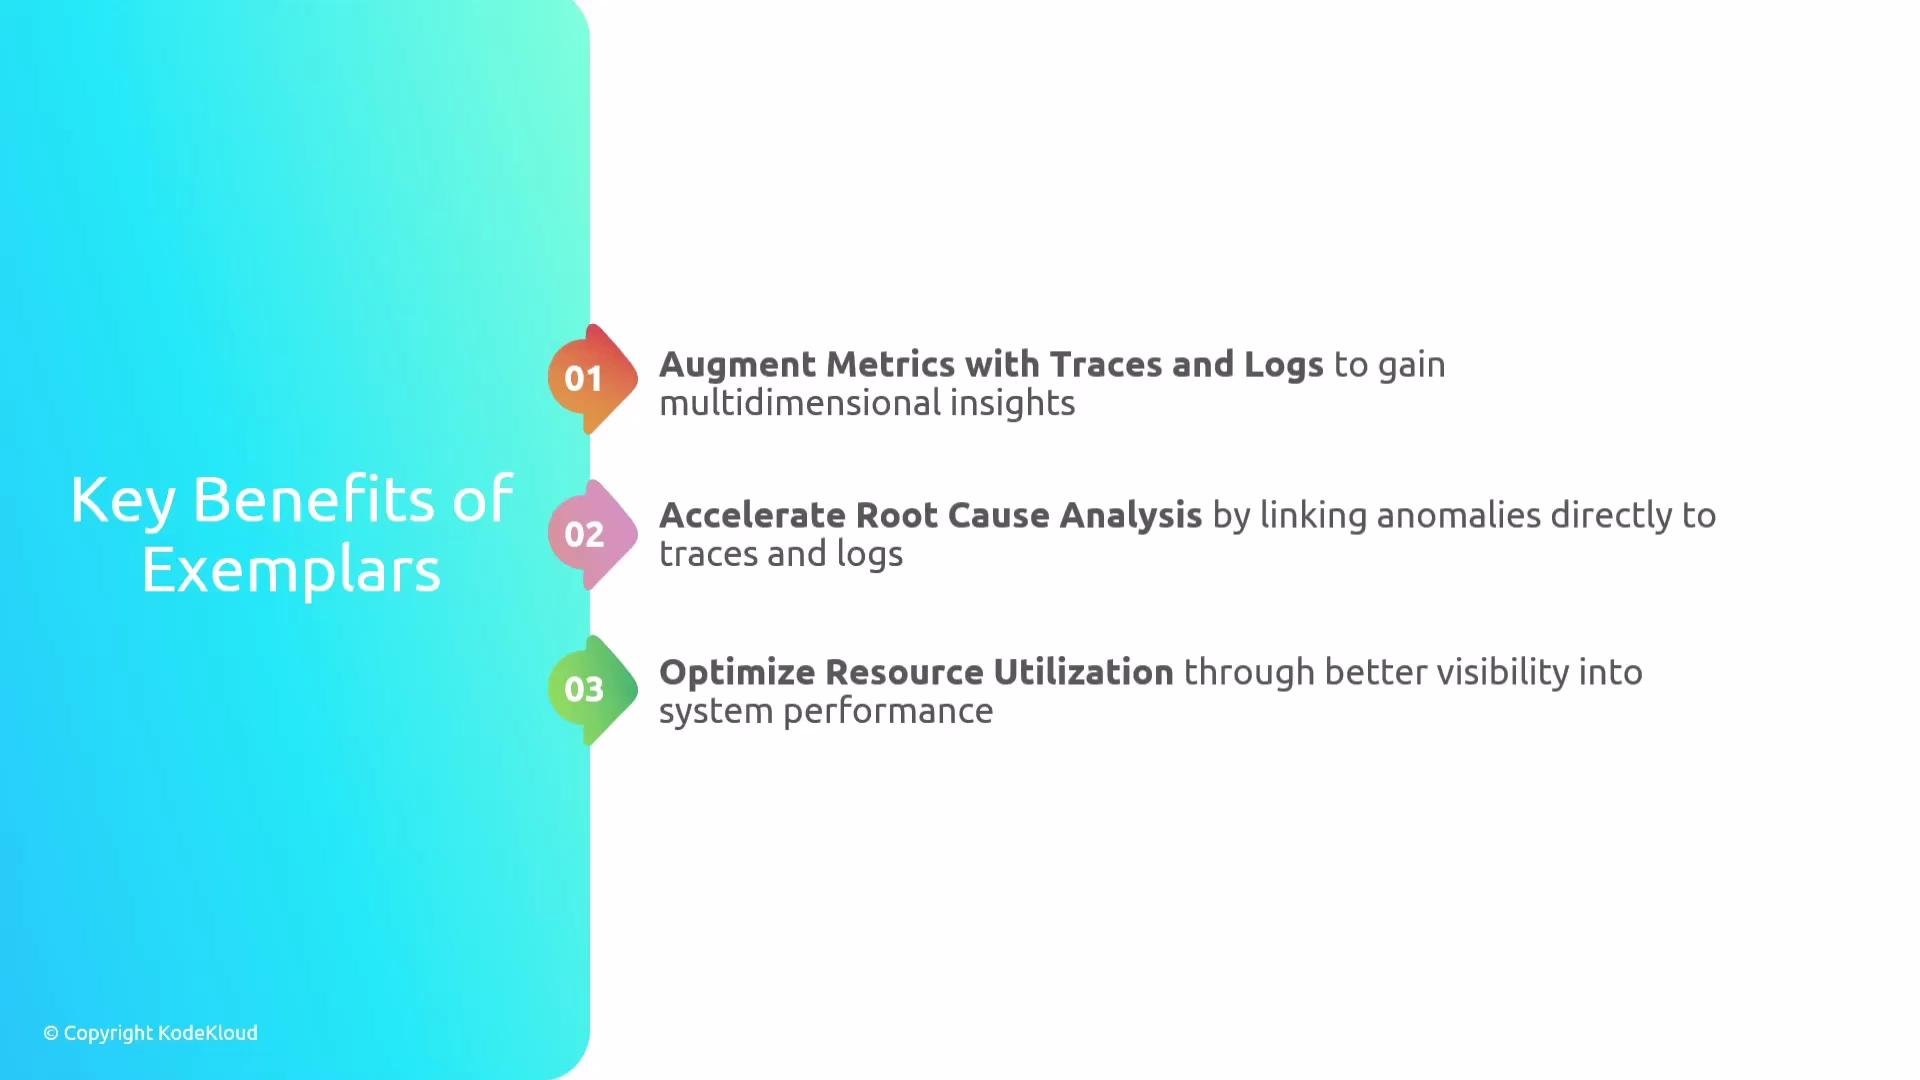
- Exemplars augment numeric metrics with trace and attribute context, providing a direct link between metrics and traces.
- They accelerate root-cause analysis by allowing you to jump from a metric anomaly to the exact trace that produced it.
- Exemplars enhance observability and reduce time-to-resolution by revealing why a metric value occurred, not just that it occurred.
- OpenTelemetry Metrics documentation: https://opentelemetry.io/docs/
- .NET instrumentation guide: https://learn.microsoft.com/dotnet/
- Prometheus querying basics: https://prometheus.io/docs/prometheus/latest/querying/basics/