

Kubernetes attributes processor
Thek8sattributes processor enriches incoming telemetry with Kubernetes metadata such as pod name, namespace, labels, annotations, and node information. This processor is commonly used when the Collector runs as a DaemonSet, sidecar, or centralized Collector with appropriate RBAC access so it can attach Kubernetes context to traces, metrics, and logs.
Example configuration:
Kubernetes metadata enrichment requires the Collector to have proper Kubernetes RBAC permissions (to read pods, nodes, and endpoints). Ensure your Collector’s ServiceAccount has the required Role/ClusterRole.
kubeletstats receiver
Thekubeletstats receiver scrapes the kubelet summary endpoint on each node to collect node-, pod-, and container-level resource metrics (CPU, memory, filesystem, network). Because it needs local kubelet access, it is typically deployed as a DaemonSet so each Collector pod can reach the local kubelet.
Example configuration:
- The kubelet summary endpoint may require authentication or TLS; configure the receiver to meet your kubelet security configuration.
- Use
kubeletstatsalongsidehostmetricsand Prometheus scrapes for a complete resource and workload view.
filelog receiver
Thefilelog receiver tails container log files (commonly /var/log/containers/*.log) and forwards container stdout/stderr logs to the Collector for processing and export.
Example configuration:
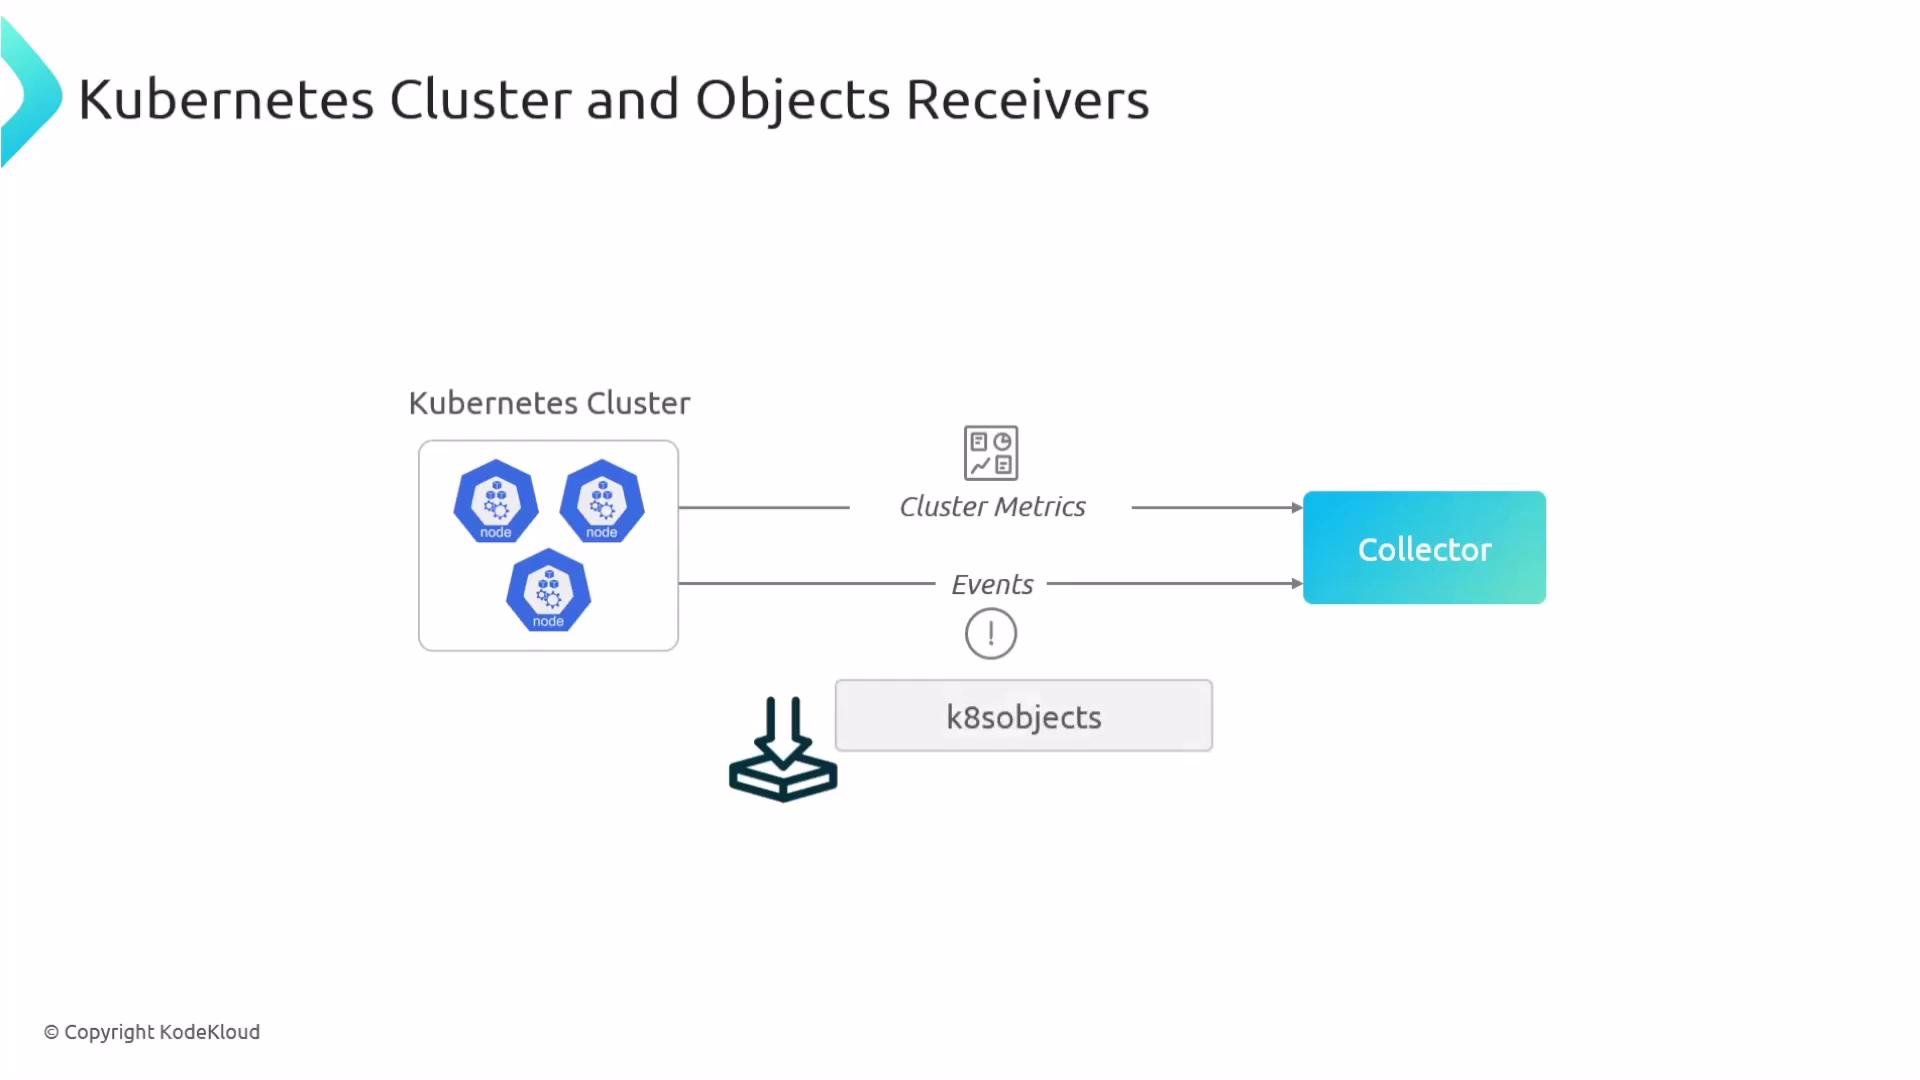
Kubernetes cluster and objects receivers
kubernetescluster(cluster receiver) gathers cluster-level metrics and high-level entity events (e.g., cluster resource usage, aggregated signals).k8sobjects(objects receiver) retrieves Kubernetes object state and events such as Pod, Deployment, and StatefulSet statuses.
Prometheus receiver
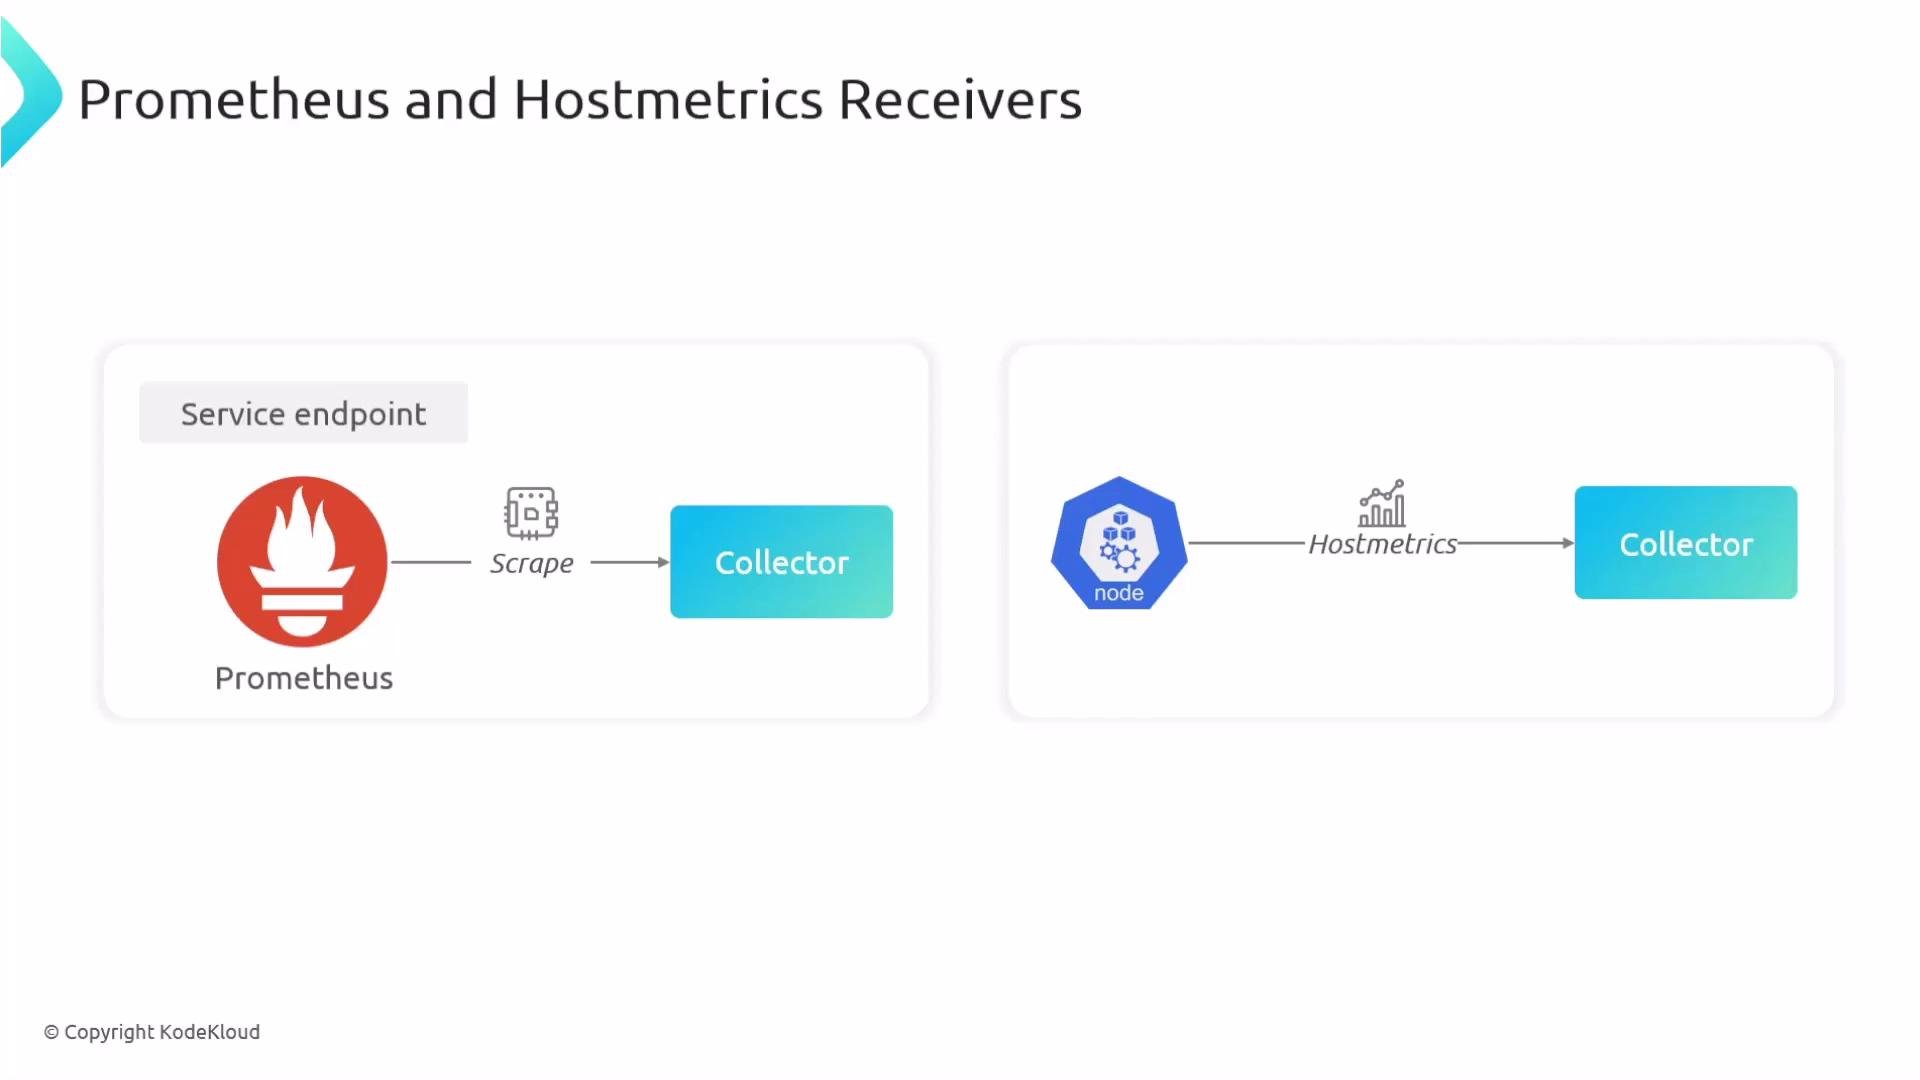
The Prometheus receiver scrapes metrics exposed in the Prometheus exposition format. Use it to scrape instrumented applications and exporters that expose/metrics.
Example minimal snippet:
The Prometheus receiver requires a full
config.scrape_configs section (service discovery or explicit scrape_configs). The example above is minimal—define jobs, targets, and relabeling to avoid misconfigured scrapes.If multiple Collectors can scrape the same Prometheus targets you will receive duplicate metrics. Coordinate scrapes (for example, partition targets or use a target allocator) to avoid duplication and metric inflation.
hostmetrics receiver
Thehostmetrics receiver collects OS-level metrics from nodes, such as CPU, memory, disk, and network usage. When used together with kubeletstats and Prometheus scrapes, it helps provide a full observability picture for both nodes and workloads.
OTLP receiver (application telemetry)
The OTLP receiver accepts traces, metrics, and logs from instrumented applications over gRPC/HTTP in the OTLP format. Use this when your workloads export telemetry directly to the Collector. Example configuration:Quick reference table
Summary and deployment choices
- Use the
k8sattributesprocessor to attach Kubernetes context to telemetry; ensure RBAC is configured. - Deploy
kubeletstatsandhostmetricsas node-local (DaemonSet) collectors when you need local resource visibility and access to the kubelet. - Use
filelogto collect container logs from node file paths or run sidecars that forward logs into the Collector. - Enable
kubernetesclusterandk8sobjectswhen you need cluster-level visibility and Kubernetes object events; verify exact receiver names for your Collector distribution. - Use the
prometheusreceiver to scrape Prometheus-format endpoints—always define properscrape_configsand coordinate scrapes to avoid duplicates. - Use
otlpto accept telemetry from instrumented workloads directly.
Links and references
- OpenTelemetry Collector documentation
- Kubernetes RBAC
- Kubernetes ServiceAccount
- Kubelet resource usage monitoring
- Prometheus exposition formats