

extensions section and activate them by listing them in service.extensions. Below we cover the minimal configuration, a more complete example with TLS/debug settings, example responses, and how to access each extension.
Minimal configuration example
A compact configuration that enables three extensions together with log and metrics pipelines:Full example showing TLS/debug and extension endpoints
This more complete configuration demonstrates TLS/debug settings, explicit extension endpoints, and enabling the extensions in theservice block:
tls.insecure: true is useful for local testing. Do NOT use it in production—configure TLS properly for production deployments.Extensions must be both declared under
extensions and enabled by listing them in service.extensions. Declaring them alone does not activate them.Common extensions and their default endpoints
Health check output example
Whenhealth_check is active, requesting the endpoint returns a short JSON payload showing availability, start time, and uptime:
zPages: runtime debug pages
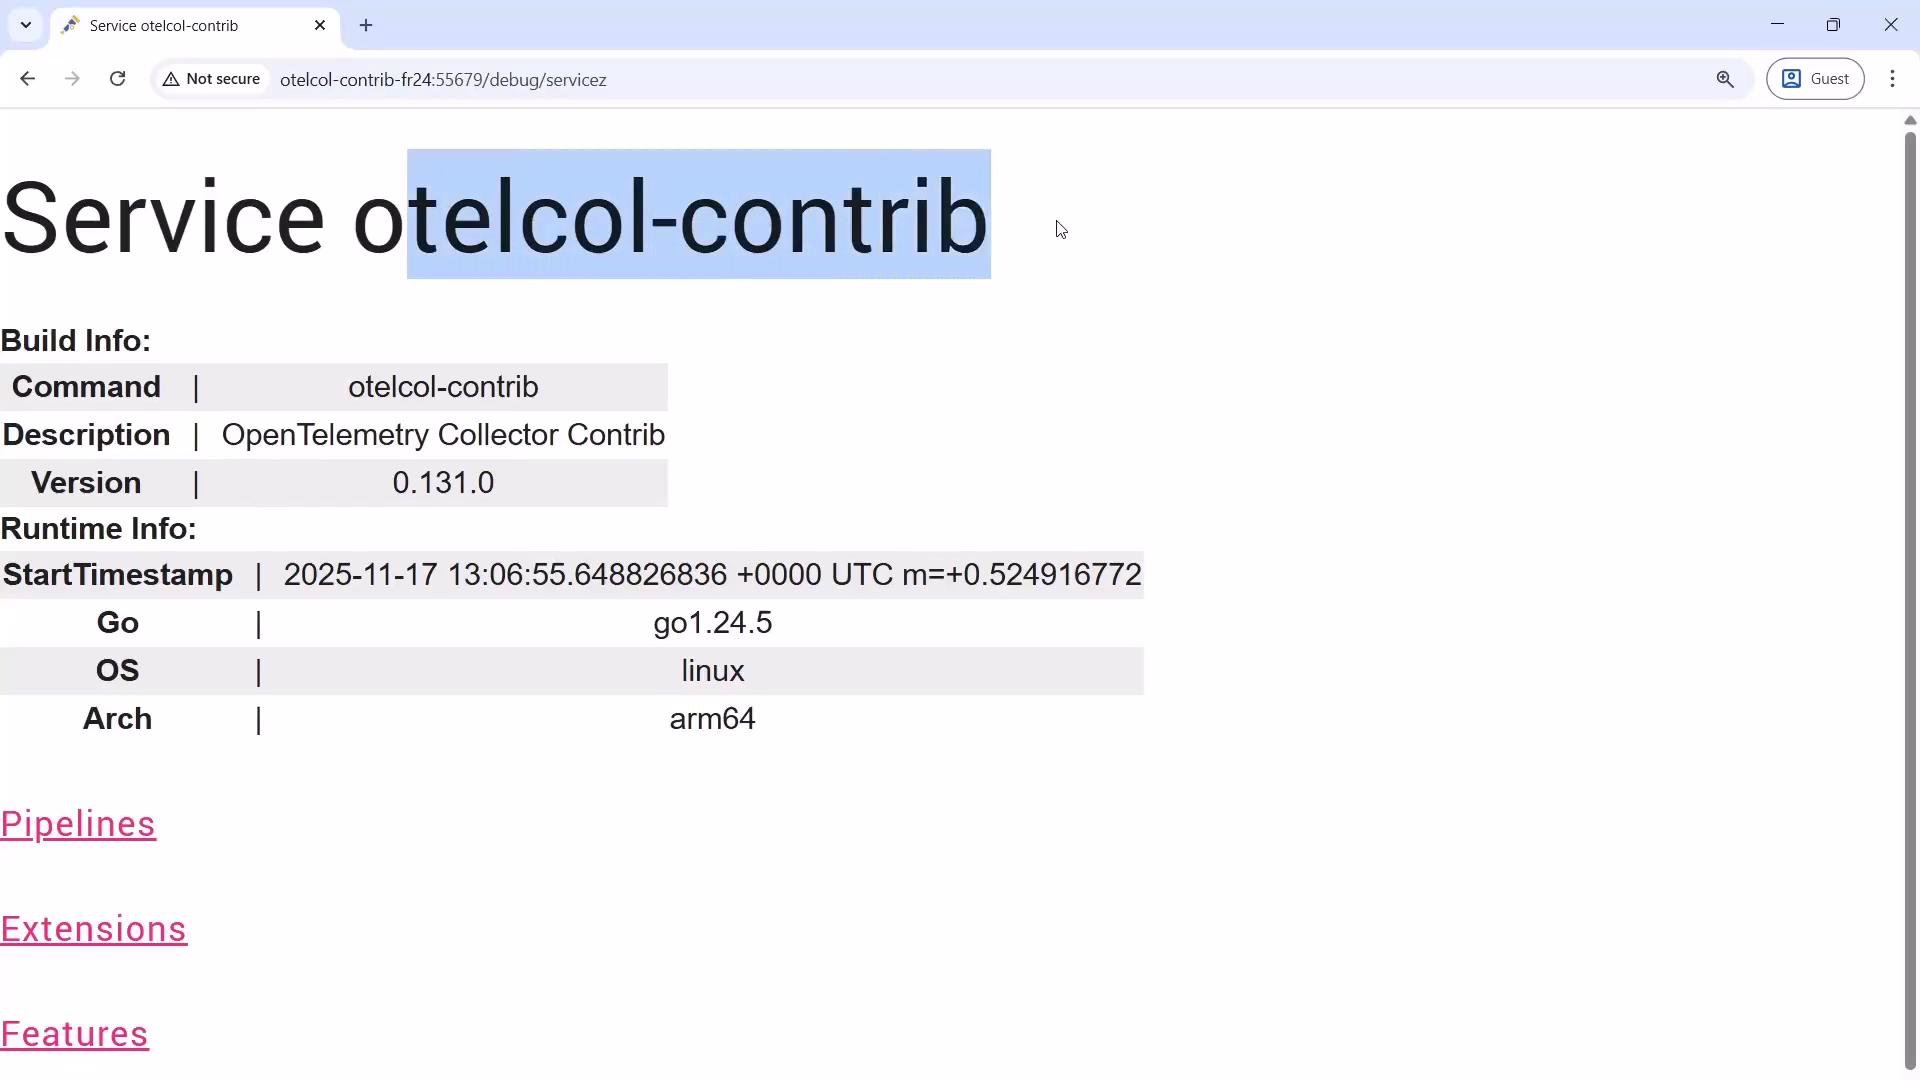
The zPages extension exposes several debug pages. Use the Collector host/IP and the configured zPages port, then append the debug path. Examples:- Service info:
http://collector-host:55679/debug/servicez - Traces:
http://collector-host:55679/debug/tracez
servicez page includes build/runtime information (start time, Go version, OS/arch, command used to run the Collector) and visualizes the configured/built pipelines.
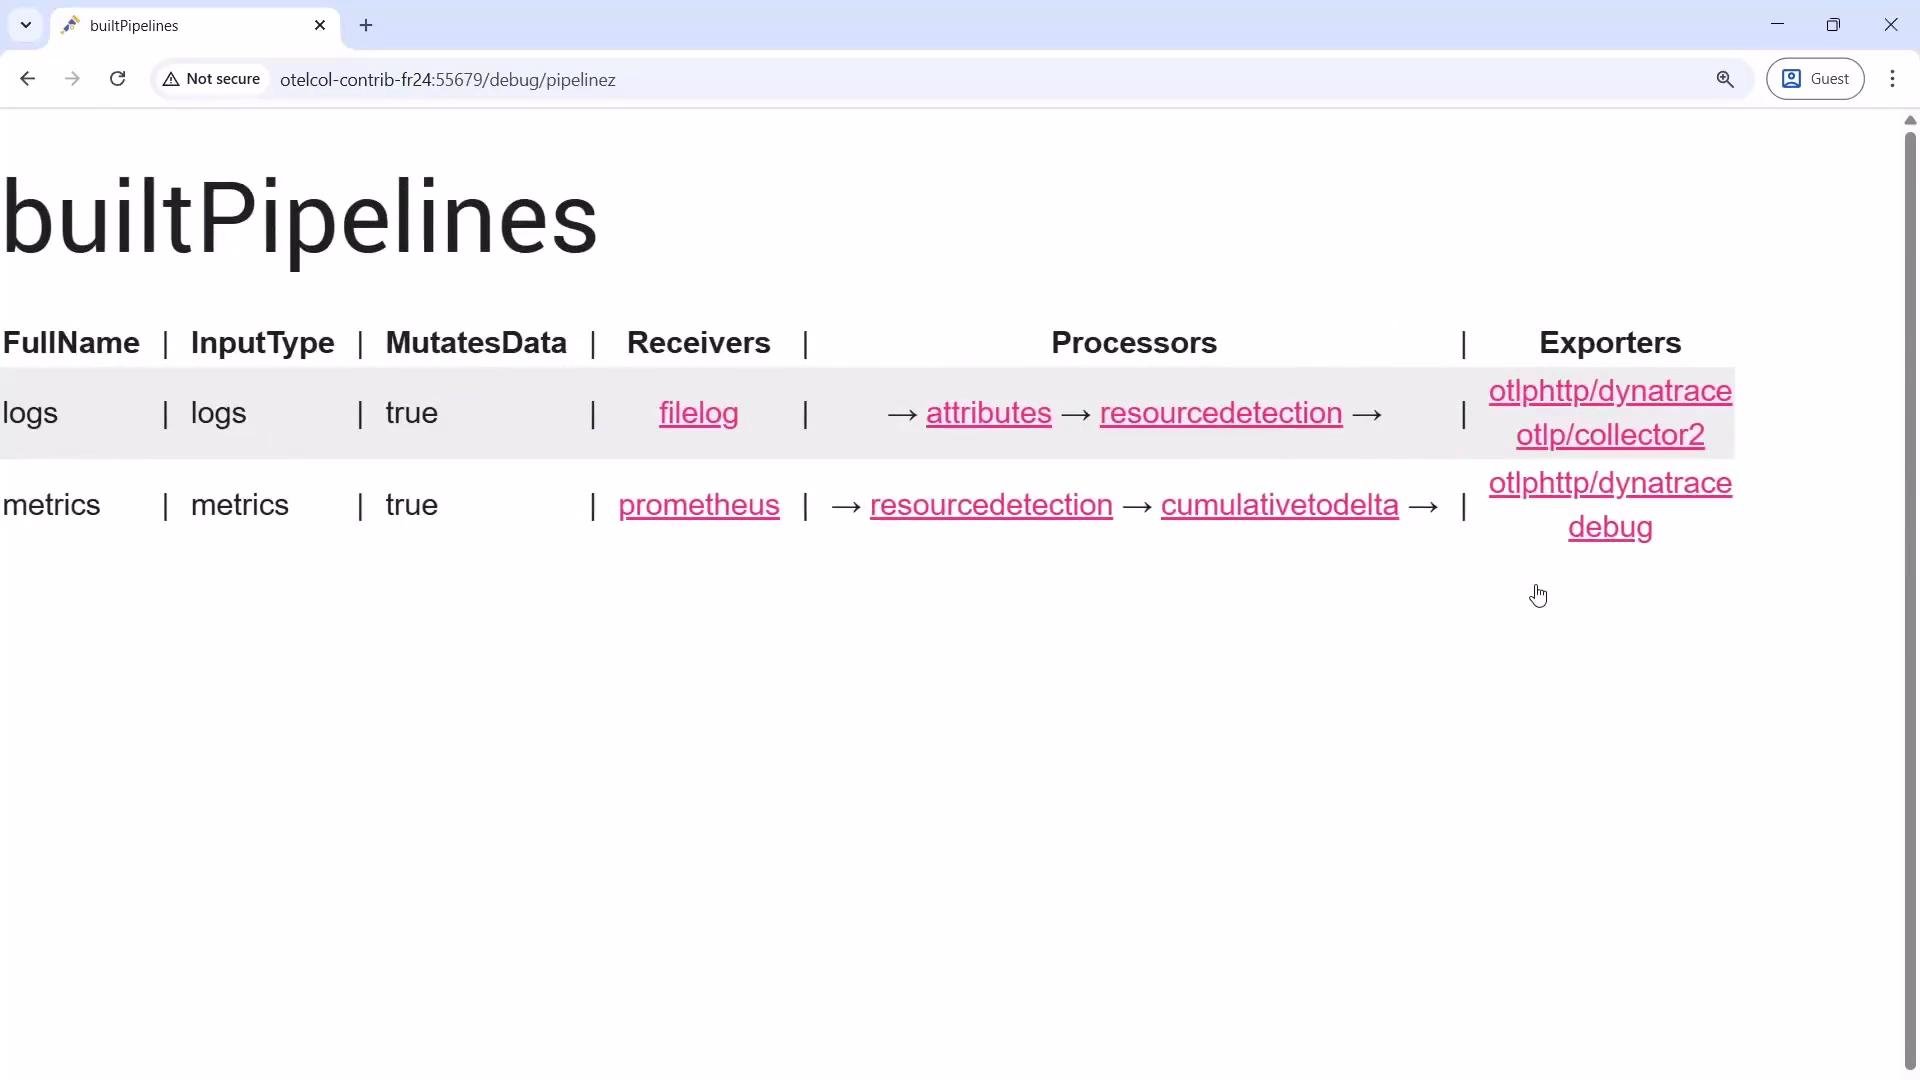
servicez view also shows built pipelines with details such as full name, input type, whether the pipeline mutates data, receivers, ordered processors, and exporters.
featurez section that lists feature gates and their current state. Example entries you might see:
tracez: inspect traces and spans
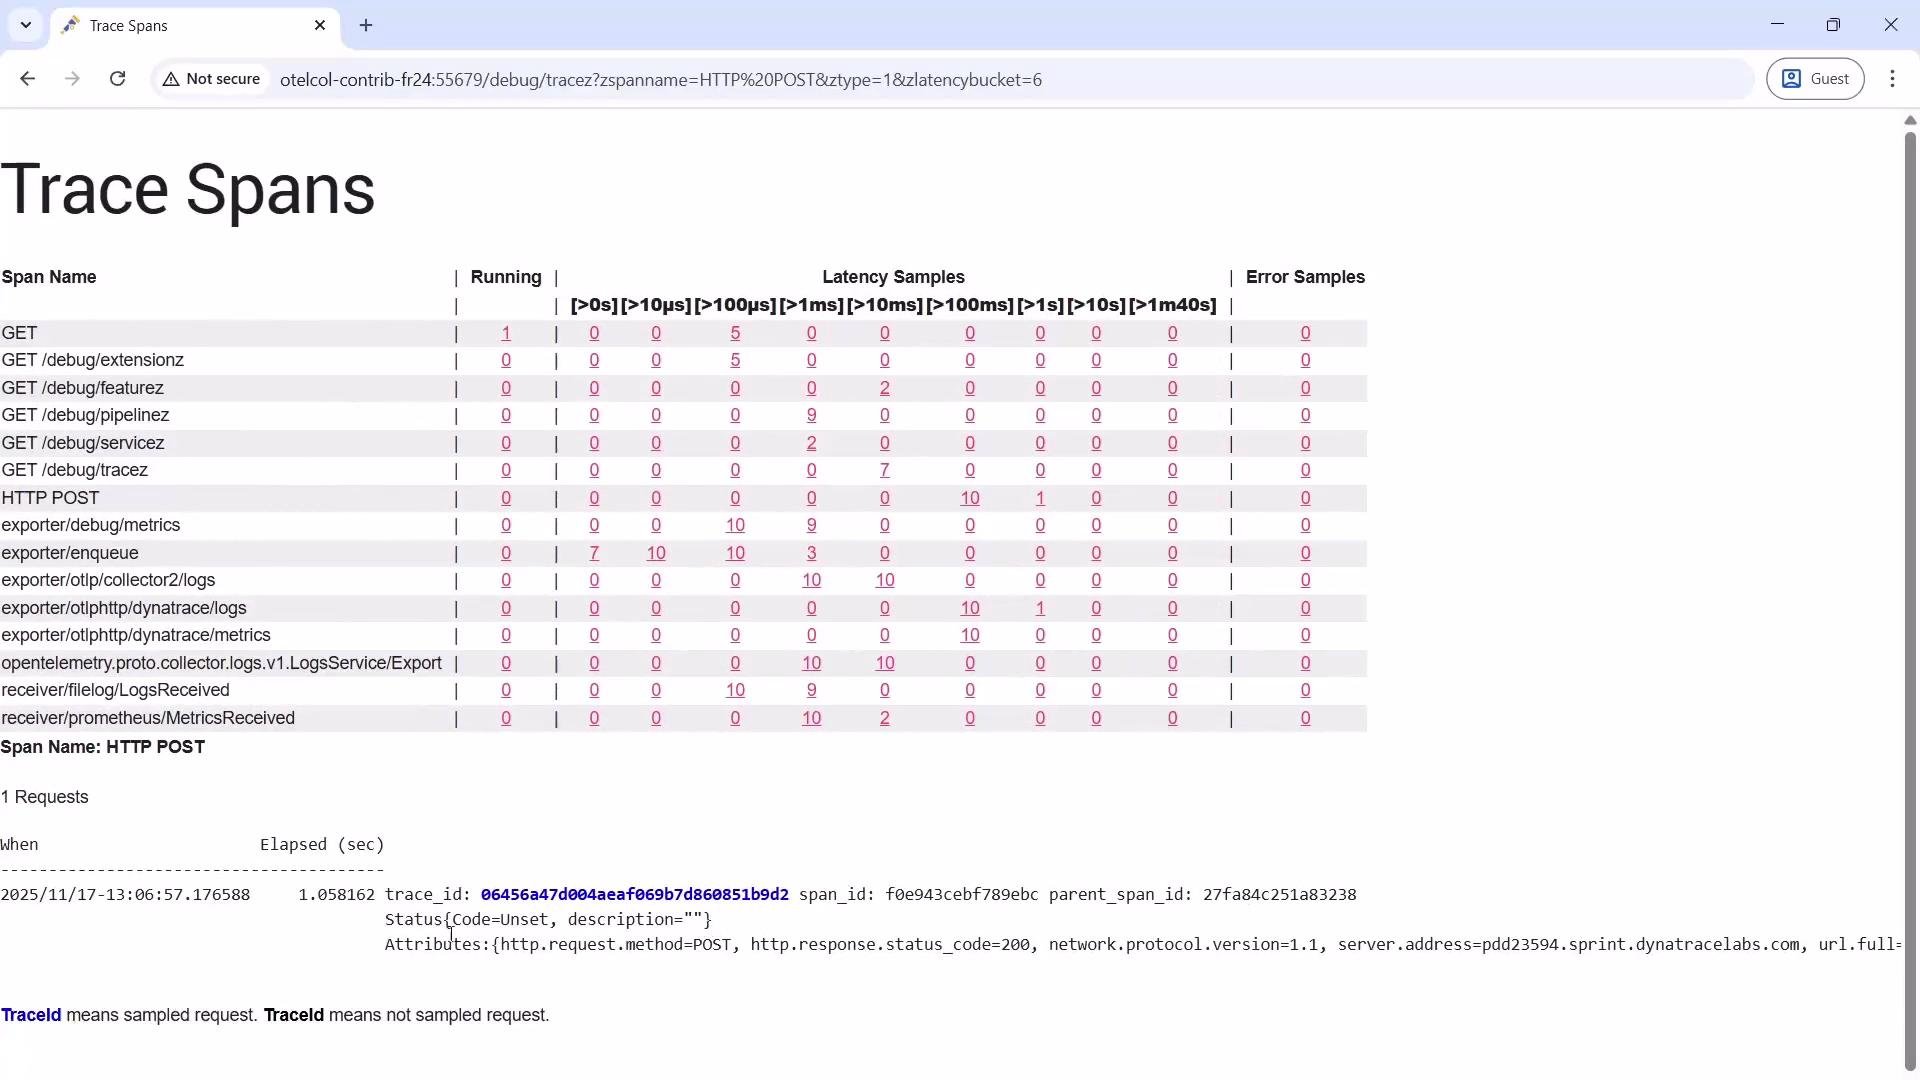
To view a live trace/span overview, open:http://collector-host:55679/debug/tracez
tracez shows incoming and sampled spans grouped by span name and request path. You can inspect span counts, latency buckets, error samples, and drill into sampled trace IDs and span IDs. Sampled traces are commonly highlighted (for example, in blue).
pprof: Go runtime profiling
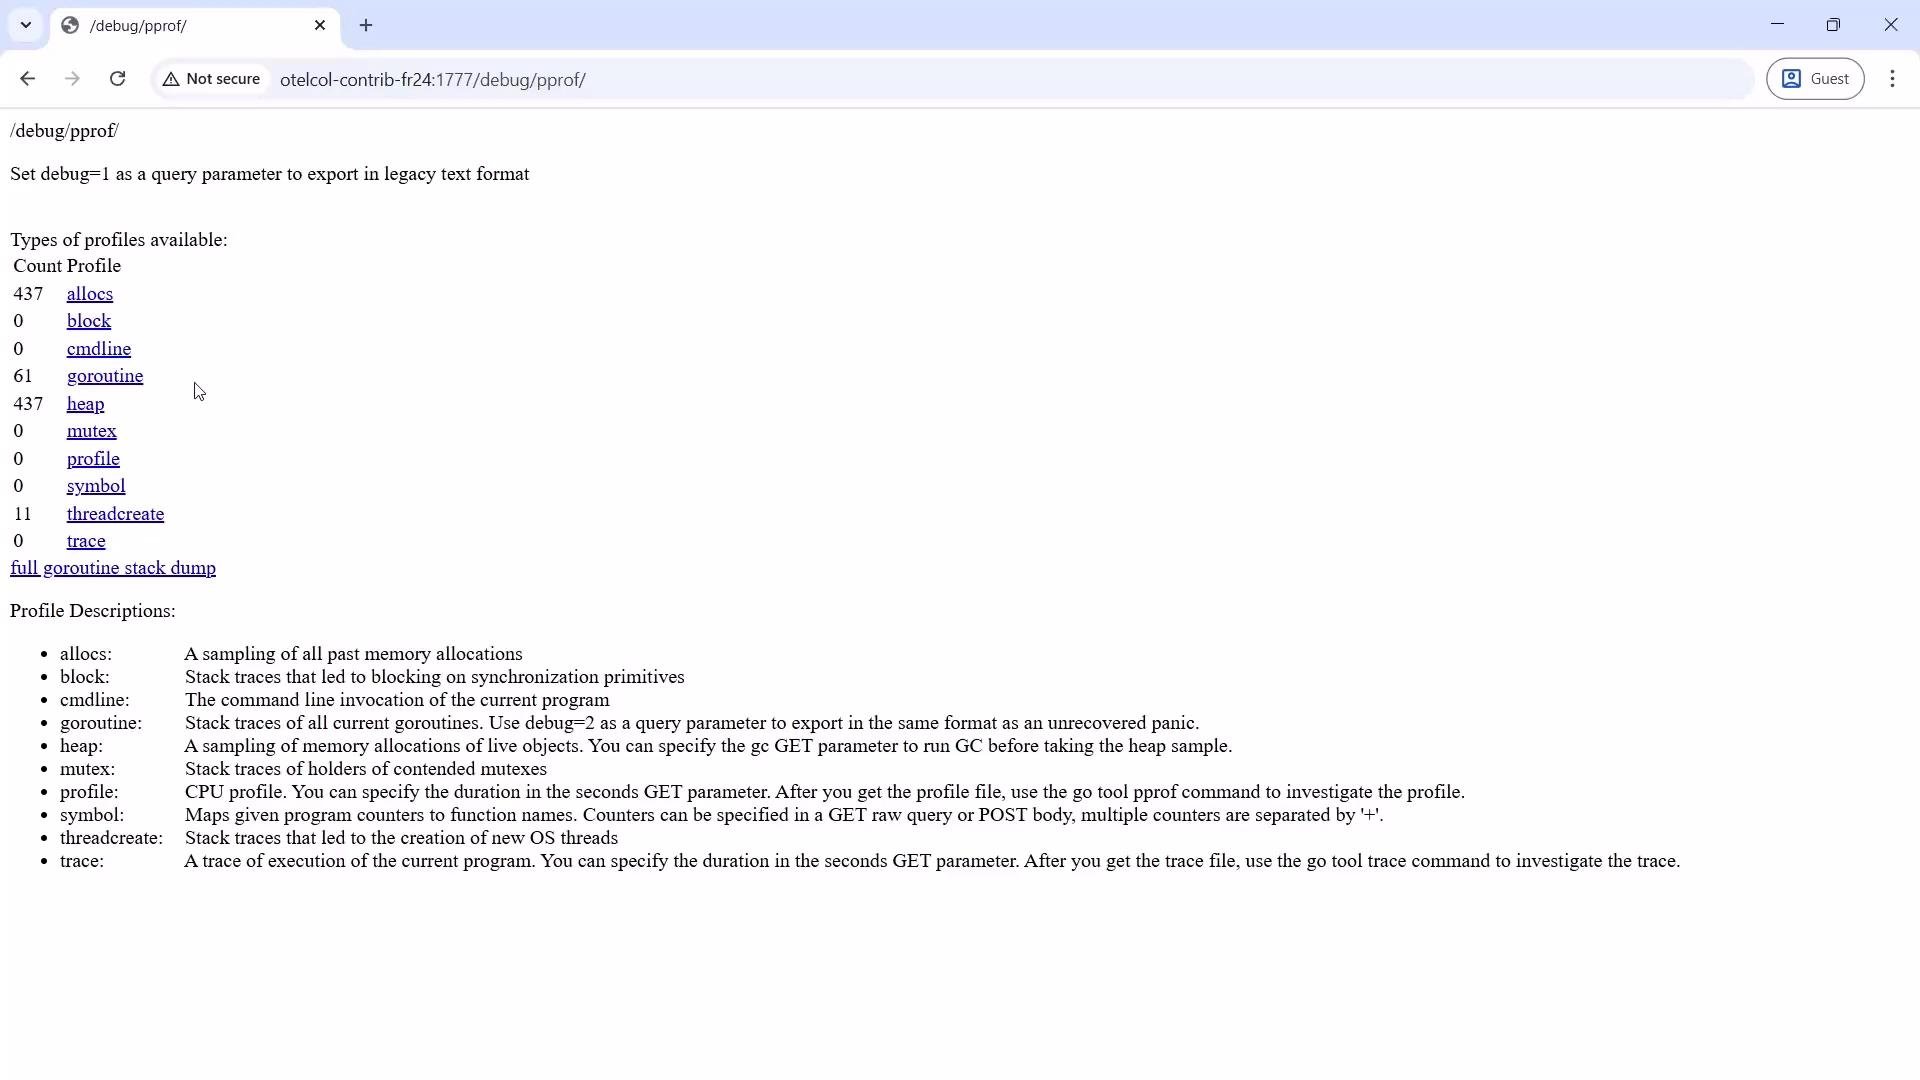
If you enablepprof (for example on port 1777), the pprof index is available at:
http://collector-host:1777/debug/pprof/
The index lists profiles such as allocs, heap, block, mutex, cpu (profiling for a duration), and goroutine (stack traces). Clicking a profile endpoint (for example a 30-second CPU profile) downloads a pprof file that you can analyze locally with the pprof tool or upload to web viewers like Speedscope.
- Graph view: call graph showing relationships between functions during the profiling window.
- Flame graph: highlights hot paths; width corresponds to CPU time consumed by the call stack.
Useful links and references
- zPages extension: https://github.com/open-telemetry/opentelemetry-collector-contrib/tree/main/extension/zpages
- pprof tool: https://github.com/google/pprof
- Speedscope (online profile viewer): https://speedscope.app
- OpenTelemetry Collector docs: https://opentelemetry.io/docs/collector/