

- Start with a minimal Flask app that has no OpenTelemetry packages.
- Install the OpenTelemetry distro and OTLP exporter.
- Use the auto-instrumentation tooling to capture traces and metrics without modifying application code.
- Show a slightly more complex example that exercises HTTP and database instrumentation.
- OpenTelemetry: https://opentelemetry.io/
- Flask: https://palletsprojects.com/p/flask/
- OTLP spec: https://opentelemetry.io/docs/reference/specification/protocol/otlp/
1. Minimal Flask app (products.py)
This tiny Flask application is the whole codebase used for the initial demo.pip freeze output (showing common packages but no OpenTelemetry):
products.py and no OpenTelemetry imports, it’s a perfect candidate to demonstrate zero-code (auto) instrumentation: we will add observability without changing application source.
2. Install OpenTelemetry distro and bootstrap instrumentation
Install the OpenTelemetry distro and the OTLP exporter, then let the bootstrapper add matching instrumentation libraries for installed packages:- Scans installed packages in the environment (e.g., Flask, requests, psycopg).
- Installs
opentelemetry-instrumentation-*packages that correspond to detected libraries (for exampleopentelemetry-instrumentation-flask,opentelemetry-instrumentation-requests,opentelemetry-instrumentation-psycopg2).
3. Run the app with the OpenTelemetry auto-instrumentation tool
There are two equivalent ways to configure auto-instrumentation:- Pass configuration as CLI flags to
opentelemetry-instrument. - Set
OTEL_environment variables and runopentelemetry-instrumentwithout flags.
When configuring OTLP over HTTP via environment variables, include the full path
.../v1/traces (for traces). The CLI flag --exporter_otlp_endpoint may accept a host-only value and append the proper path automatically, but the environment variable OTEL_EXPORTER_OTLP_TRACES_ENDPOINT typically must include the full http://<host>:<port>/v1/traces URL.Example: instrumenting and generating a trace (products)
Start the instrumented app using CLI flags (console exporter prints spans to stdout and OTLP forwards to the configured endpoint):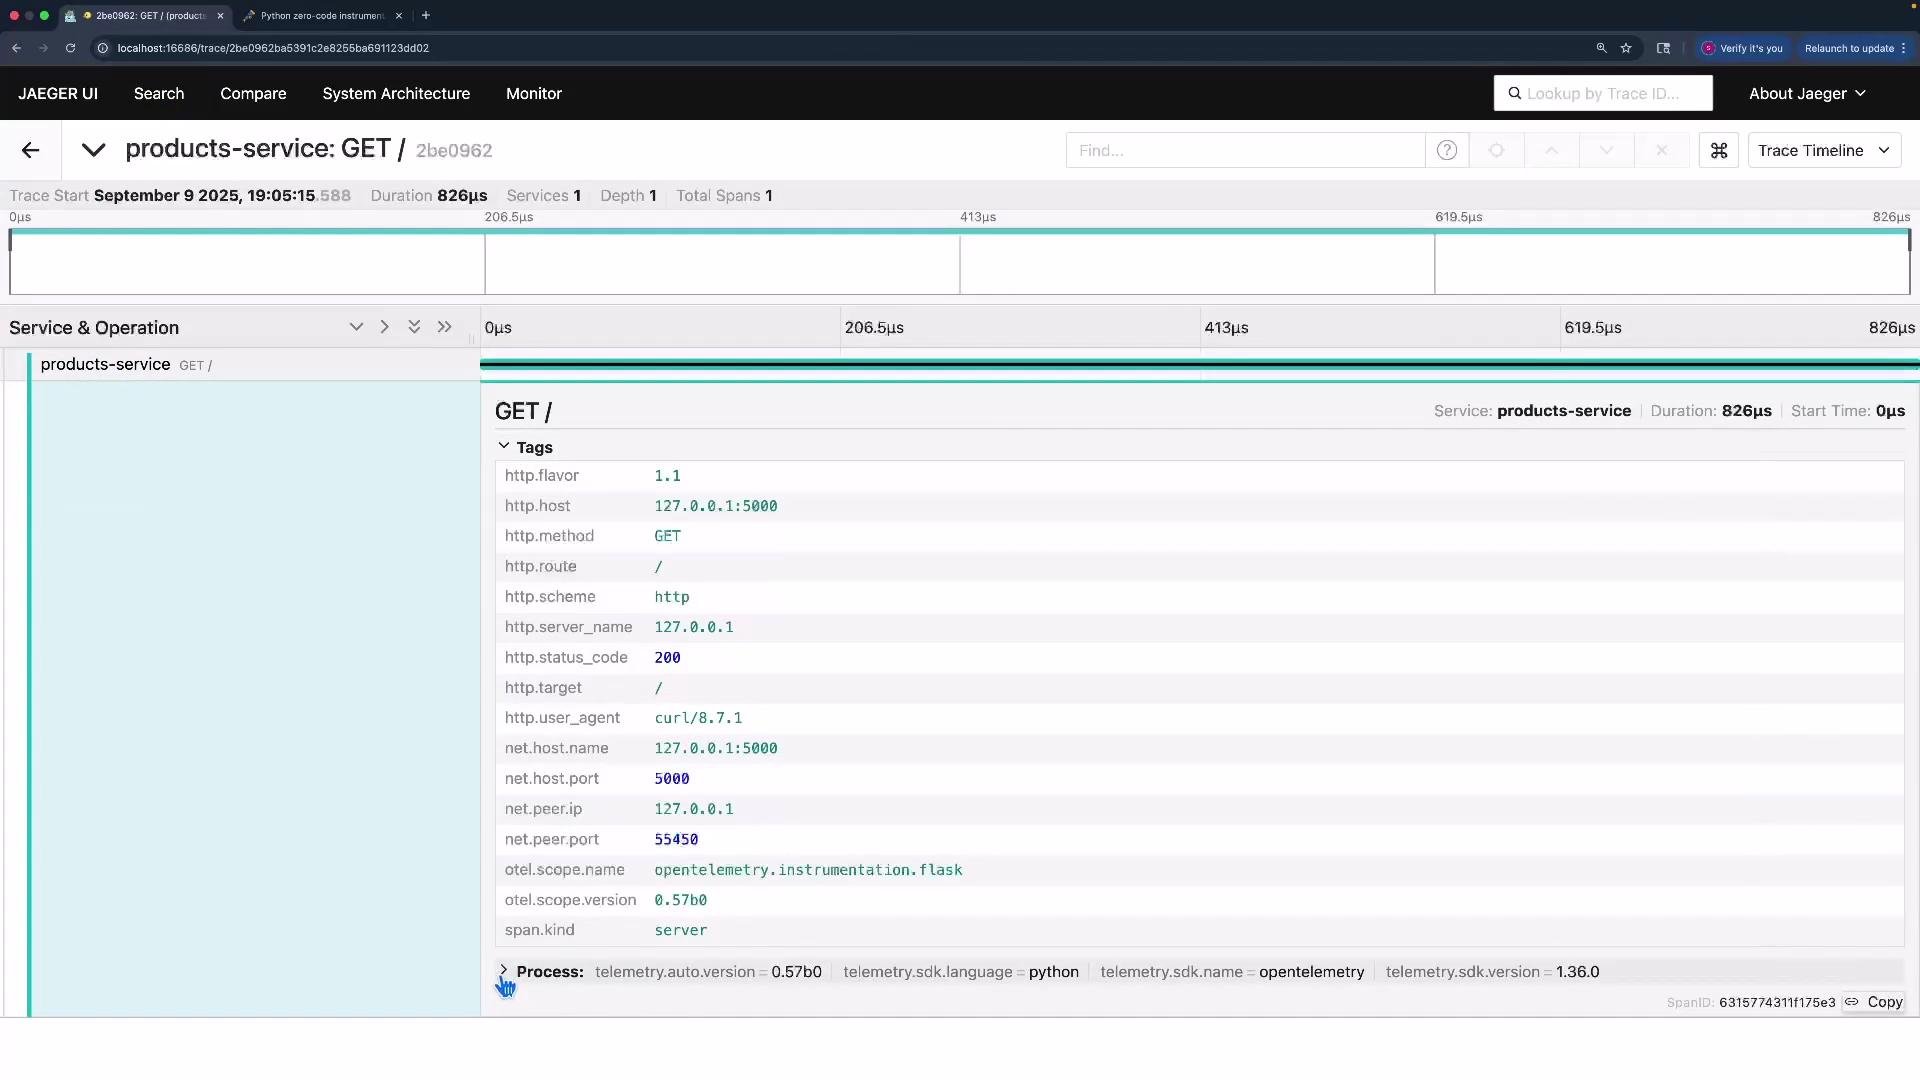
opentelemetry-bootstrap -a install added—no changes to products.py were required.
4. Configure with environment variables (example)
A concise env-var example:OTEL_EXPORTER_OTLP_TRACES_ENDPOINT omits /v1/traces, you may observe export failures such as “failed to export span batch” or HTTP 404/400 responses from the OTLP HTTP receiver. Including /v1/traces typically resolves that issue.
5. Demonstration: a slightly more complex app (crypto.py)
Next, we instrument a slightly richer example that uses Flask, requests, and psycopg2. Because instrumentation packages for these libraries are available and were installed by the bootstrap step, the application is auto-instrumented without source changes. Representative excerpts fromcrypto.py:
opentelemetry-instrument captures multiple spans in a single trace:
- Incoming Flask server span (HTTP server).
- Outgoing HTTP client span (requests → CoinMarketCap).
- Database spans for SQL statements (psycopg2) with
db.*semantic attributes.
pro-api.coinmarketcap.com, and DB spans showing executed SQL statements.
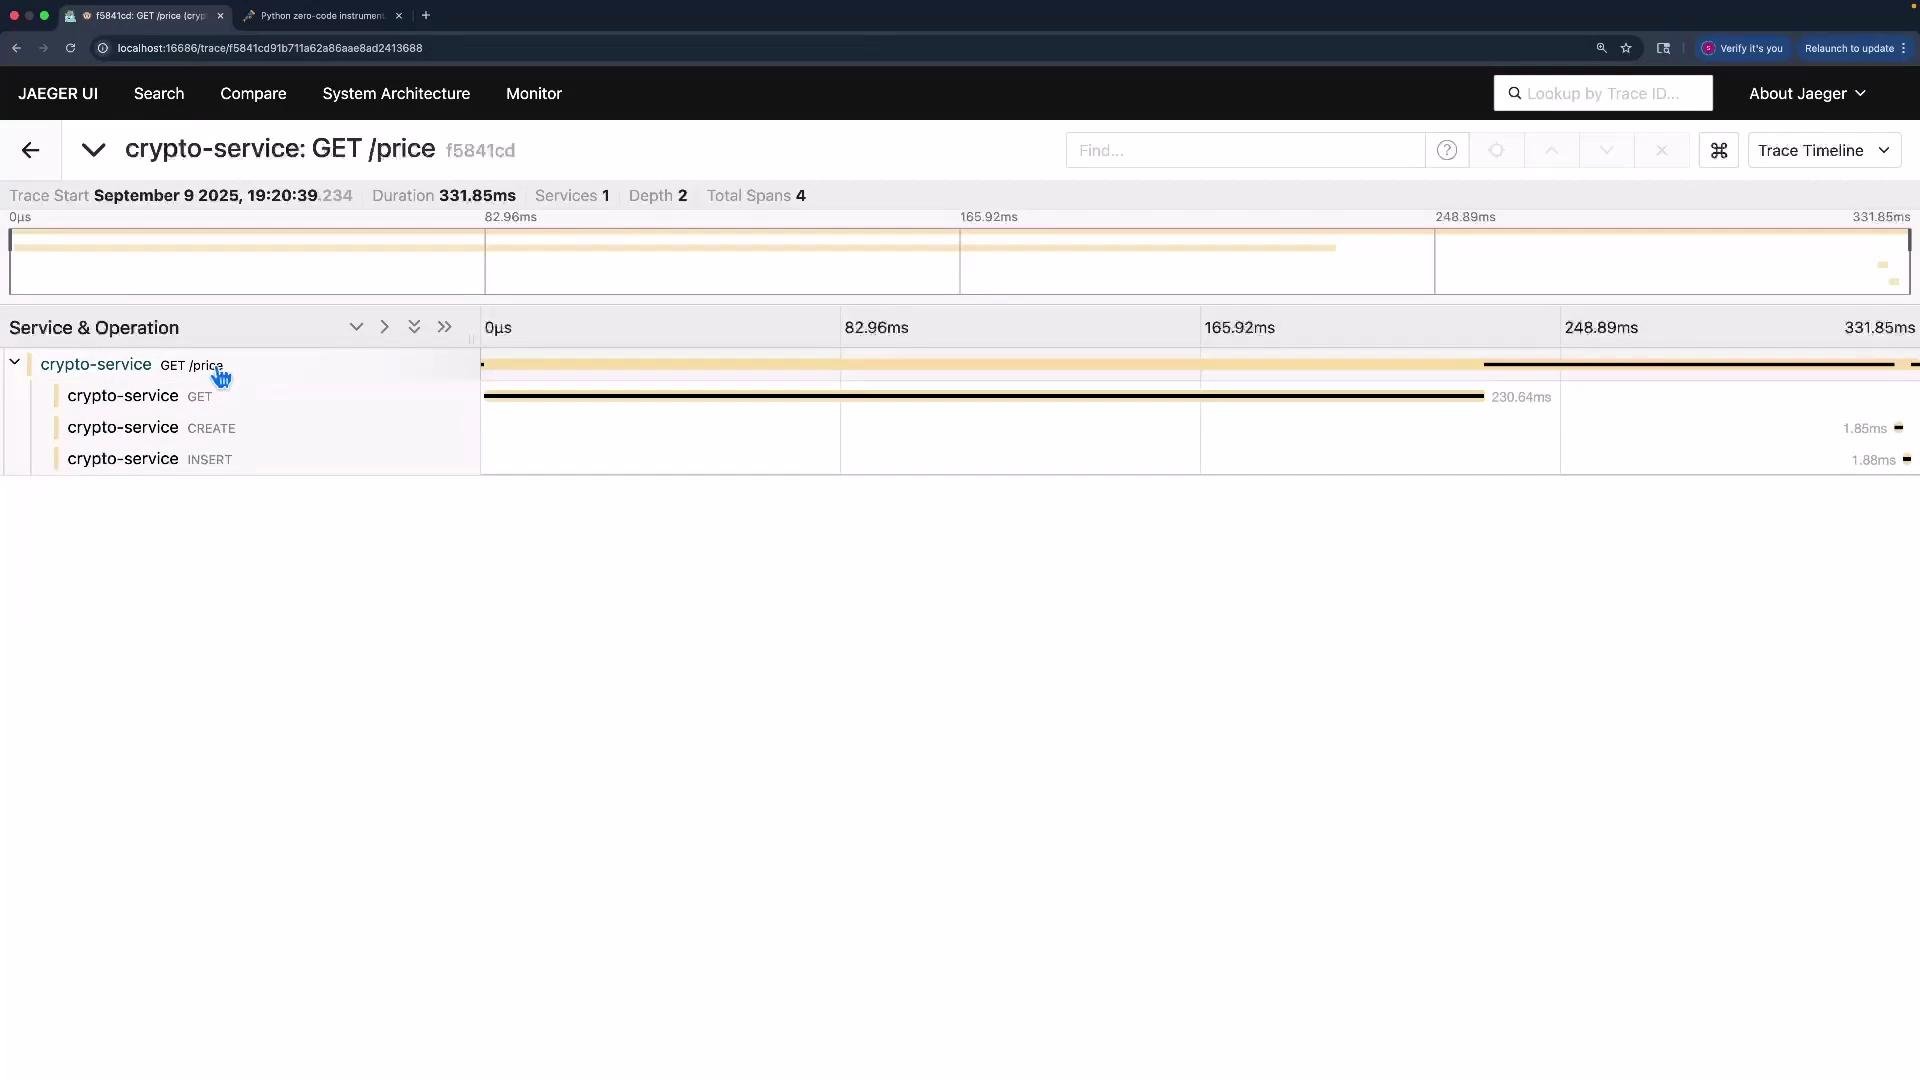
opentelemetry-bootstrap -a install—no code changes to crypto.py were required.
Summary & best practices
- Auto-instrumentation enables zero-code observability for supported libraries (Flask, requests, psycopg2, etc.).
- Install
opentelemetry-distroandopentelemetry-exporter-otlp, then run:opentelemetry-bootstrap -a installto add matchingopentelemetry-instrumentation-*packages.
- Run your application with
opentelemetry-instrumentusing CLI flags orOTEL_environment variables. - When using environment variables for OTLP HTTP traces endpoint, include
/v1/tracesinOTEL_EXPORTER_OTLP_TRACES_ENDPOINT. - Exported telemetry can be sent to console for debugging or to OTLP-compatible backends (via OpenTelemetry Collector) such as Jaeger.
Links and references
- OpenTelemetry: https://opentelemetry.io/
- OpenTelemetry Python distro (PyPI): https://pypi.org/project/opentelemetry-distro/
- OpenTelemetry OTLP exporter (PyPI): https://pypi.org/project/opentelemetry-exporter-otlp/
- OpenTelemetry Collector: https://opentelemetry.io/docs/collector/
- Jaeger: https://www.jaegertracing.io/
- Flask: https://palletsprojects.com/p/flask/
- requests: https://docs.python-requests.org/
- psycopg2: https://www.psycopg.org/