

The debug exporter is intended for debugging and testing only — it is not recommended for production use.
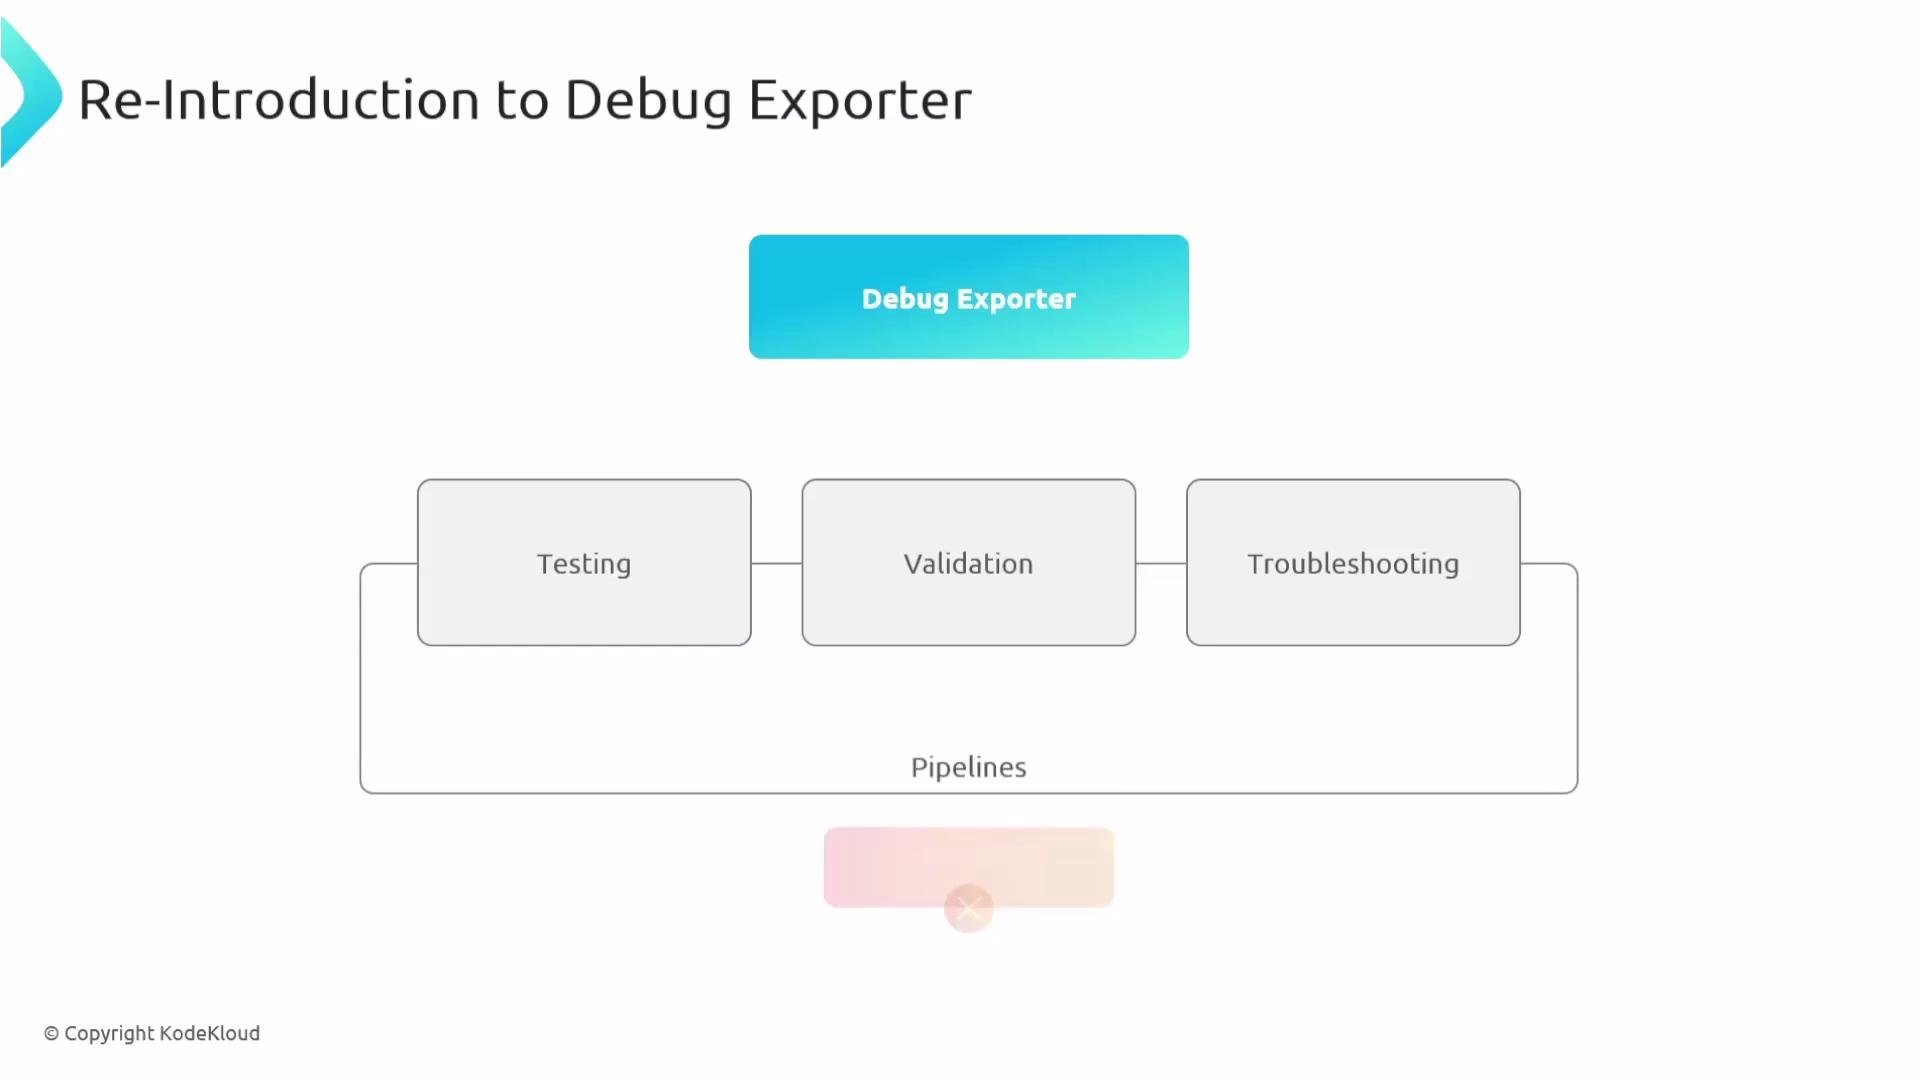
What the debug exporter does
- Emits telemetry payloads to the collector log stream so you can inspect them in real time.
- Supports verbosity levels to control how much information is printed.
- Offers sampling controls to limit output volume in high-throughput environments.
sampling_initial and sampling_thereafter reduces how many items are printed (for example, the first N items are printed, then 1 in M thereafter).
To actually see output for a given signal (traces, metrics, logs), include the debug exporter in that signal’s pipeline. If not referenced in a pipeline, the collector will not print that signal’s data.
Example minimal configuration that enables the debug exporter for all three signals:
Verbosity levels
Verbosity controls how much the debug exporter prints. The three supported levels arebasic, normal, and detailed. Use the appropriate level depending on how much inspection you need.
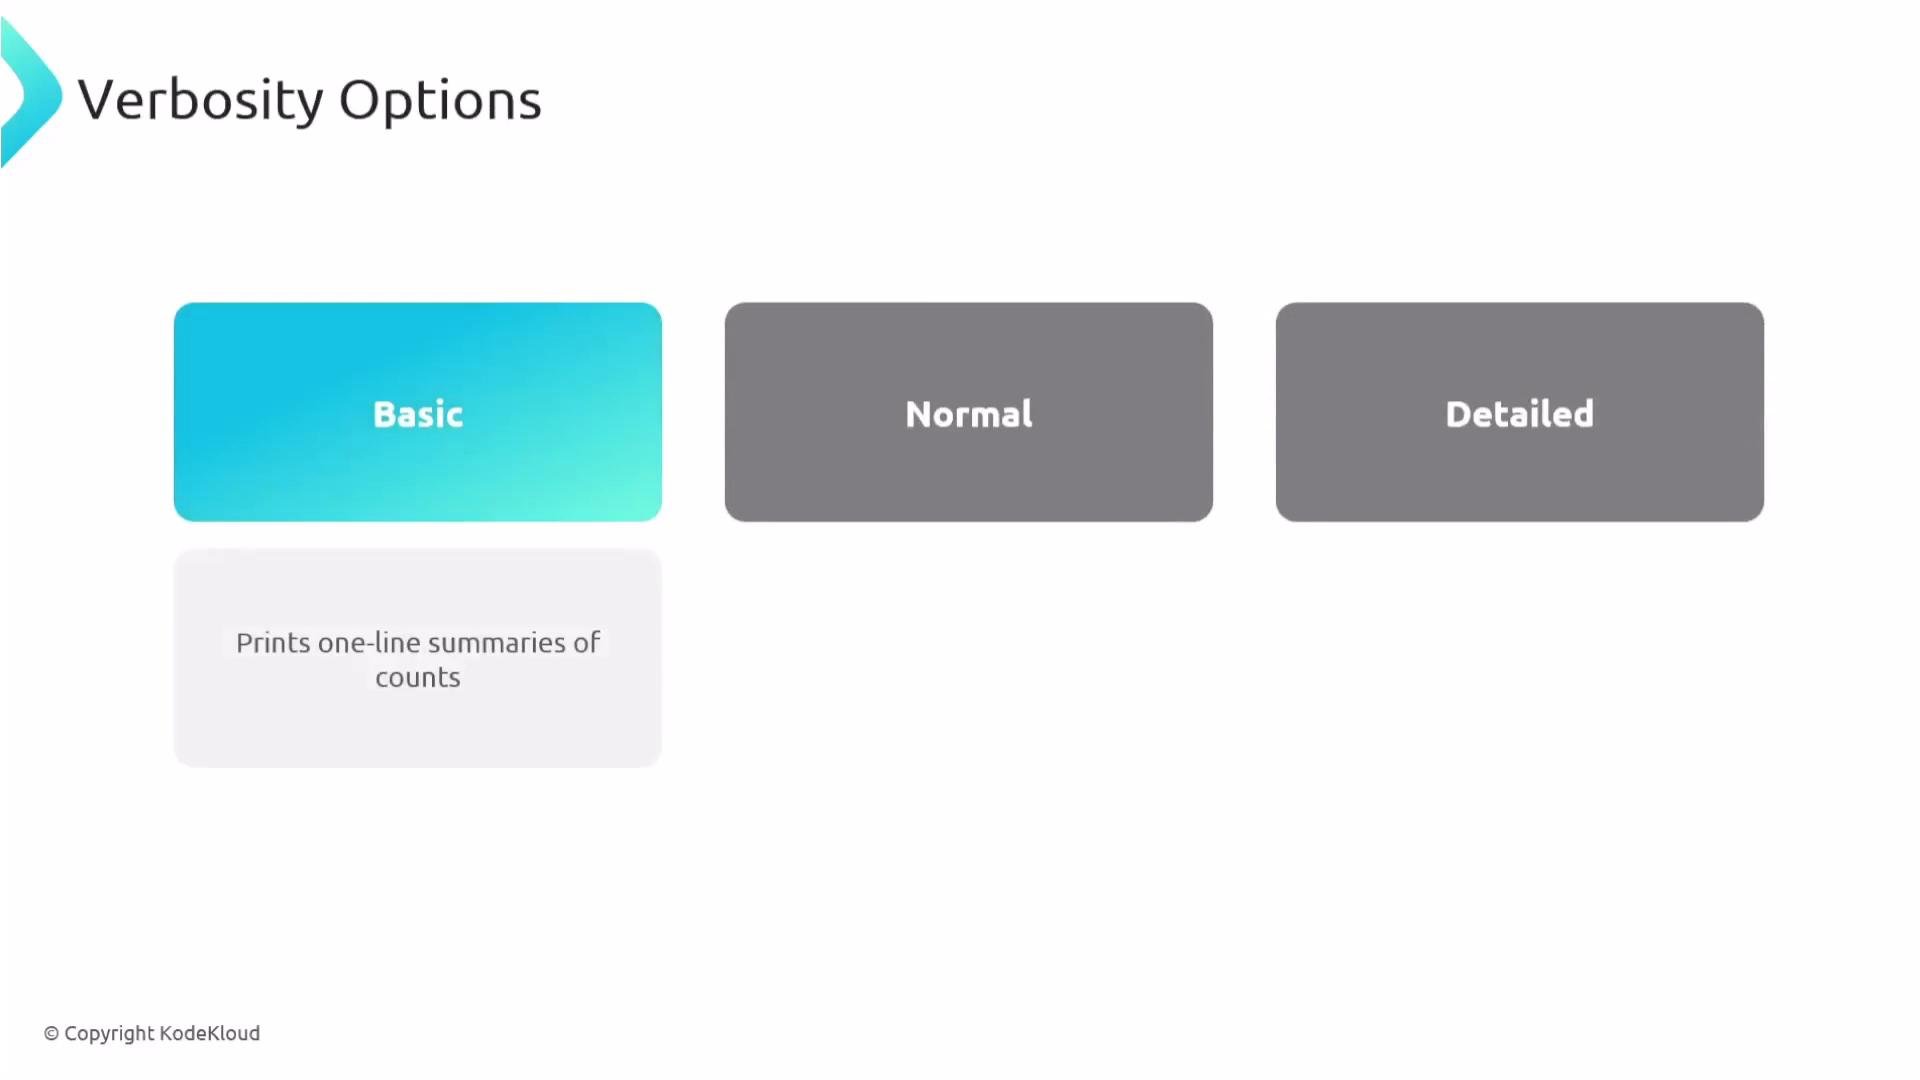
basic verbosity:
normal level augments the above with resource and scope metadata. The detailed level prints full payloads including attributes and events.
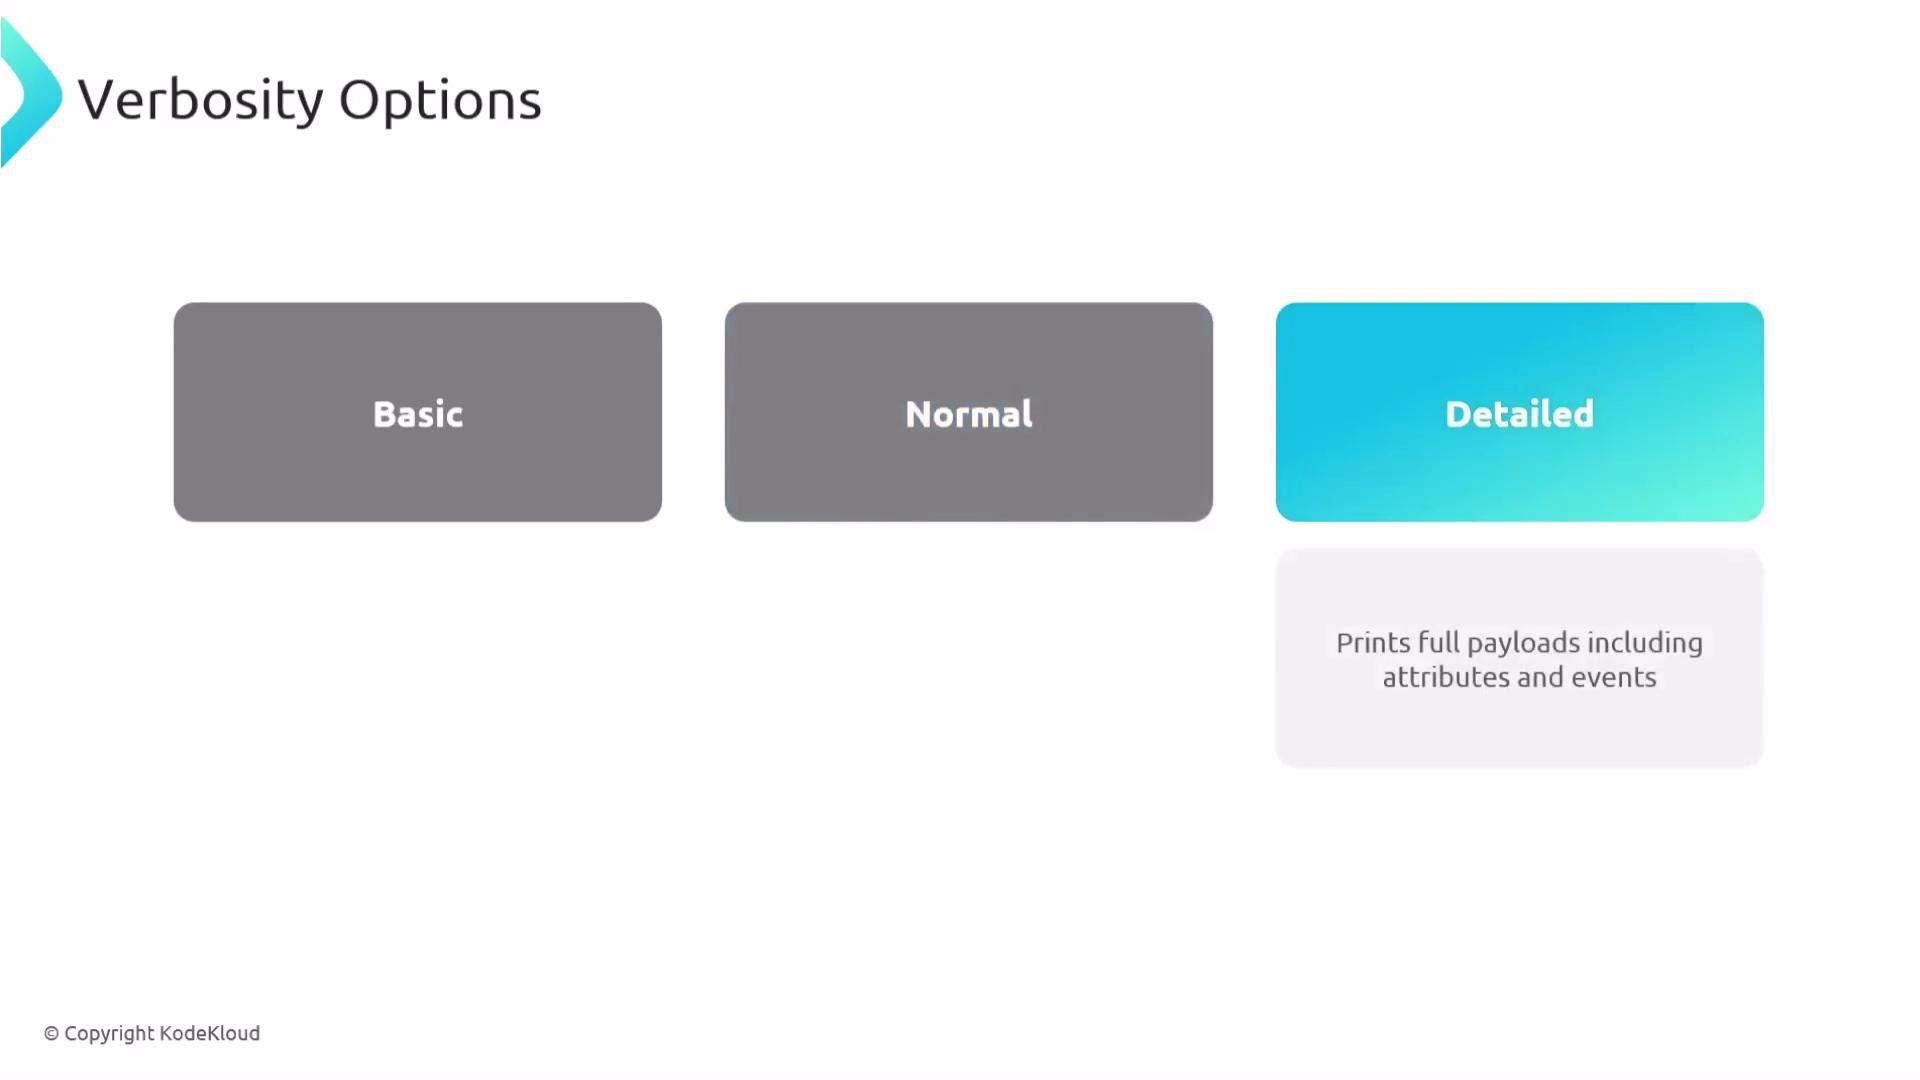
detailed span record:
- validate payload structure,
- confirm context propagation (e.g., consistent trace IDs across spans),
- inspect attribute and field transformations applied by processors, and
- diagnose pipeline routing or dropping issues.
Be cautious: detailed debug output can include sensitive information and generate very large log volumes. Do not enable
detailed verbosity in production. If needed, redirect collector stdout/stderr to a controlled file and restrict access.Additional notes and best practices
- The collector’s global logging level (e.g.,
DEBUG,INFO,WARN,ERROR) controls the collector’s own logs and is separate from the debug exporterverbosity. - Debug exporter verbosity options:
basic | normal | detailed. - Persisting debug output: redirect stdout/stderr when launching the collector (for example, shell redirection or container log drivers).
- Use sampling parameters (
sampling_initial,sampling_thereafter) to reduce noise when testing high-throughput pipelines.
Links and references
- OpenTelemetry Collector — official docs: https://opentelemetry.io/docs/collector/
- OpenTelemetry configuration examples: https://github.com/open-telemetry/opentelemetry-collector-contrib/tree/main/examples