- Client (payment service): inject the current OpenTelemetry context into outgoing HTTP headers.
- Server (charge service): extract the context from incoming headers, attach it for the request lifecycle, and detach it in teardown.
We inject the context into an HTTP carrier (headers) with
inject(...) and retrieve it on the server with extract(...). Both utilities are available from opentelemetry.propagate.Payment service (client) — inject context into request headers
Goals- Configure the tracer provider and exporter for the payment service.
- Create a client span for the outgoing HTTP request.
- Call
inject(headers)before sending the request so propagation fields are added to the HTTP headers. - Pass
headerstorequests.get(..., headers=headers).
inject(headers)mutates your headers dictionary to include propagation fields (traceparent, tracestate, etc.).- Use
headers=headerswhen callingrequests.get()so the downstream service receives the context.
Charge service (server) — extract and attach context from incoming headers
Goals- Configure tracer provider and exporter for the charge service.
- Extract the incoming context from request headers and attach it so the propagated trace becomes active for the request handler.
- Save the returned token to
request.environand detach it inteardown_requestto restore the previous context.
opentelemetry.propagate.extract, opentelemetry.context.attach, and opentelemetry.context.detach.
Example charge service:
Flask passes an exception argument to
teardown_request. The teardown function must accept that parameter (for example def teardown_request_func(exc):) even if you don’t use it, otherwise Flask will raise an error.Run and verify
- Start the charge service (server):
python charge.py - Start the payment service (client) and trigger the request:
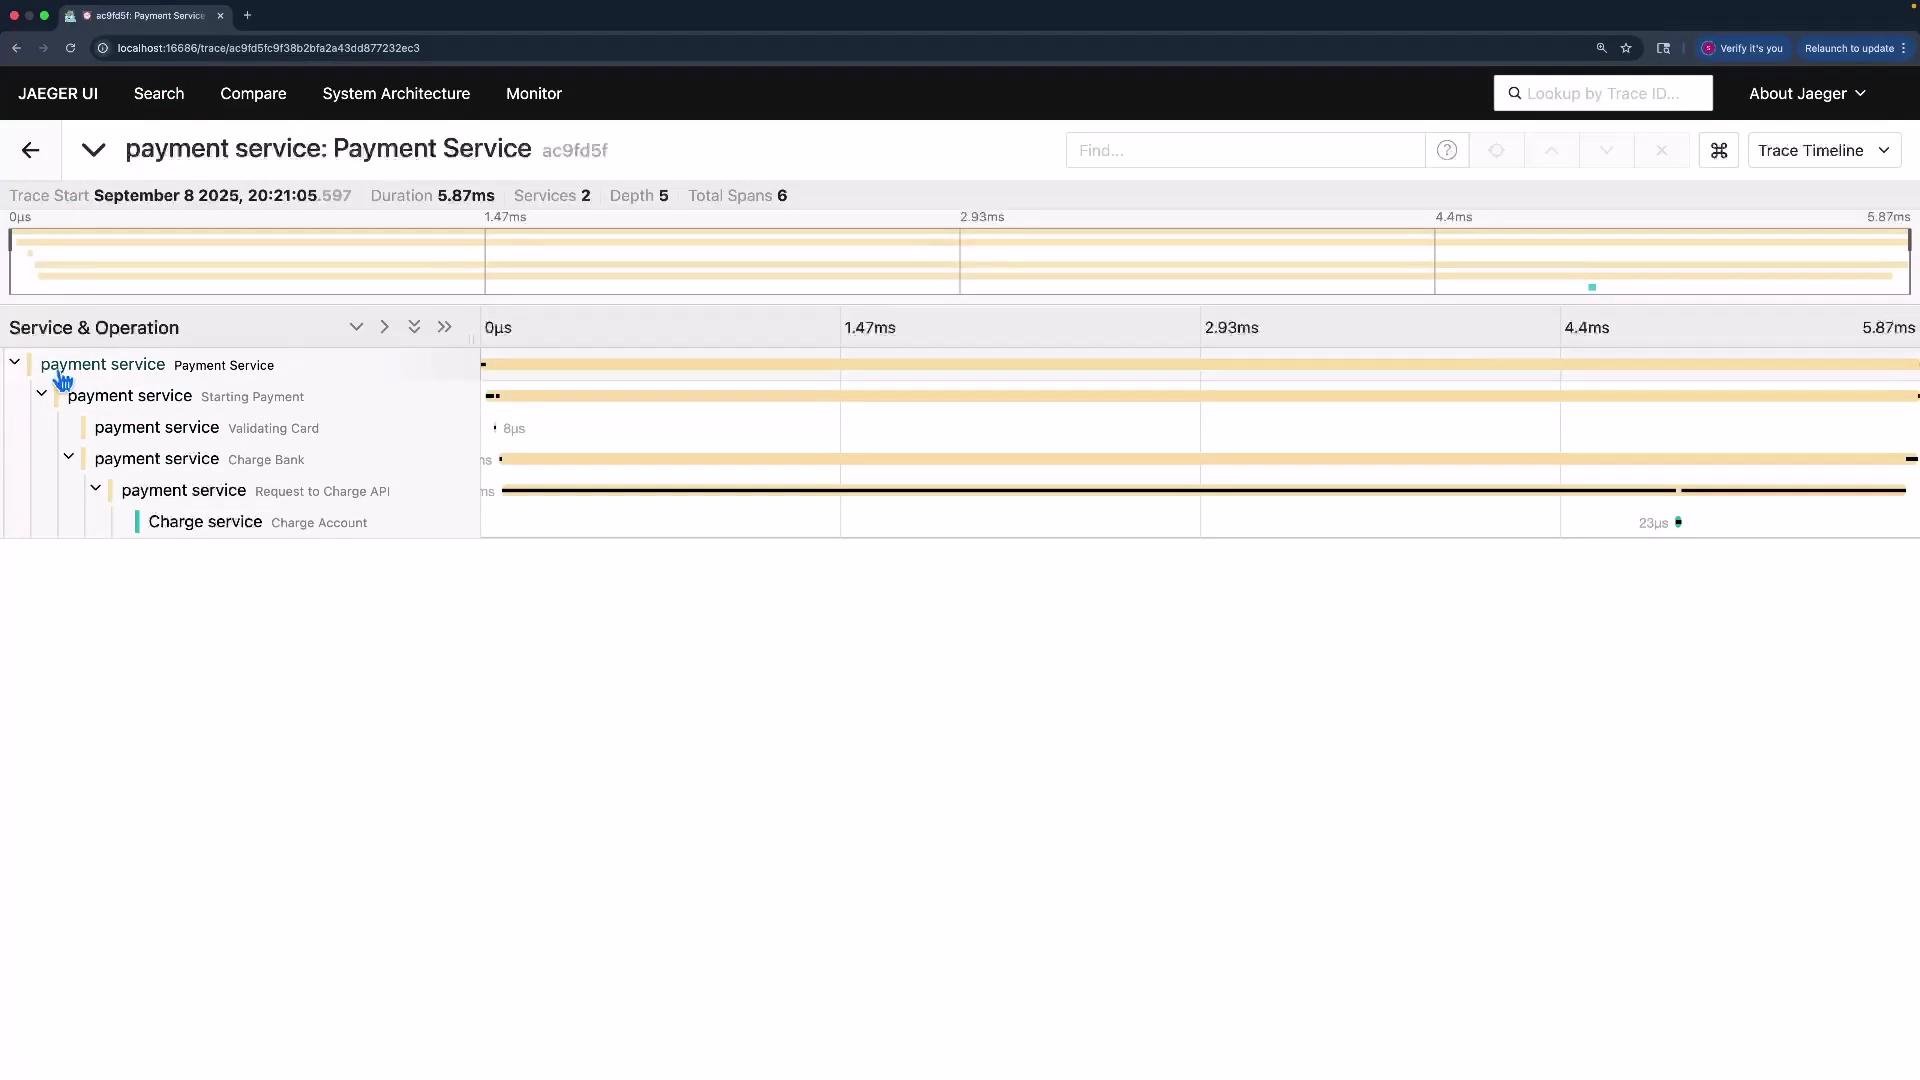
python payment.py - Observe the console output or your tracing backend. With the Console exporter you will see both client and server spans logged; with OTLP -> Jaeger you will see a single distributed trace containing both services.
- Both client and server spans should share the same
trace_id. - The server span’s
parent_idshould match the client span’sspan_id, indicating correct parent/child relationships.
- Shared
trace_idconfirms both spans belong to the same distributed trace. parent_idon the server span matches the client span’sspan_id, confirming the correct parent-child relationship.