

service.telemetry.logs. These logs include startup/shutdown messages, pipeline readiness confirmations, component warnings, and metadata such as the Collector version and service instance ID.
By default the Collector logs internal activity at INFO to standard error (
stderr). This provides immediate visibility into startup and runtime behavior without adding any telemetry configuration.Minimal configuration example
A minimal Collector config without aservice.telemetry.logs section still emits INFO logs to stderr:
Where to view Collector logs in production
Common ways to stream Collector logs by environment:
Tip: in Kubernetes, replace
<pod-name> with your actual Collector pod name or use a label selector with -l. See Kubernetes Logs for more details.
Configuring service.telemetry.logs
To control Collector internal logging (verbosity, format, sampling, and destinations), add aservice.telemetry.logs block under service. The level field accepts DEBUG, INFO, WARN, and ERROR.
- DEBUG: detailed component-level activity — useful for development and troubleshooting.
- INFO: default operational messages.
- WARN / ERROR: reduce output to only problematic events — recommended for production.
Writing logs to local files or enabling DEBUG in production can increase disk usage and expose sensitive details. Review retention and access controls if you persist Collector logs.
Advanced logging options
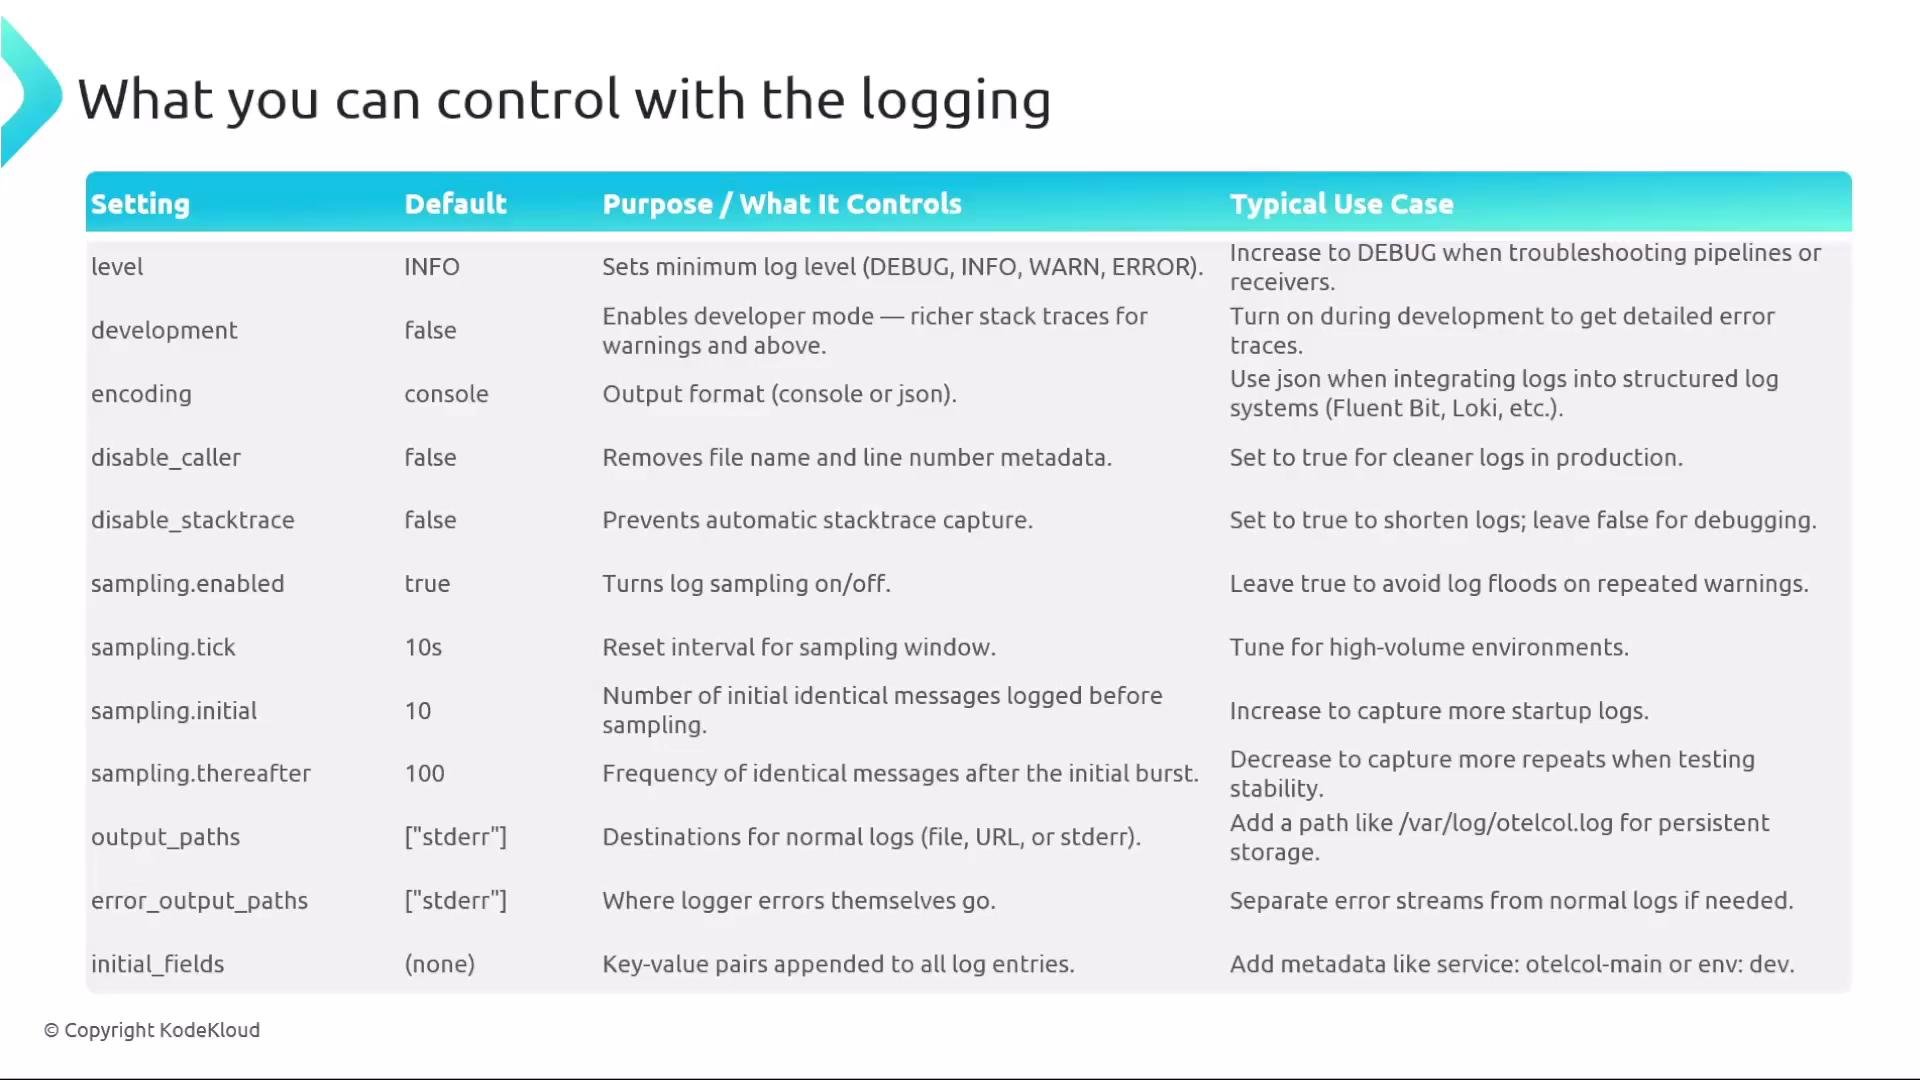
Beyondlevel, the service.telemetry.logs block supports additional fields to fine-tune behavior: development, encoding, caller info, stack traces, sampling, and output paths.
Example advanced configuration:
- Use
encoding: jsonfor structured logs that integrate with log aggregation systems. - Enable
samplingto prevent repeated identical messages from flooding logs. output_pathsanderror_output_pathslet you persist logs to files in addition to stderr.
Structured logging and troubleshooting
Whenencoding: json is enabled, each log line is a JSON object which is much easier to ingest and query in centralized log systems. During debugging, keep disable_stacktrace: false and disable_caller: false to get file/line and stack traces for errors.
Example pipeline + telemetry configuration — ensure the telemetry block is nested under service:
debug exporter.
Quick references
Log level summary:
Commands to stream Collector logs (repeat):
Key takeaways
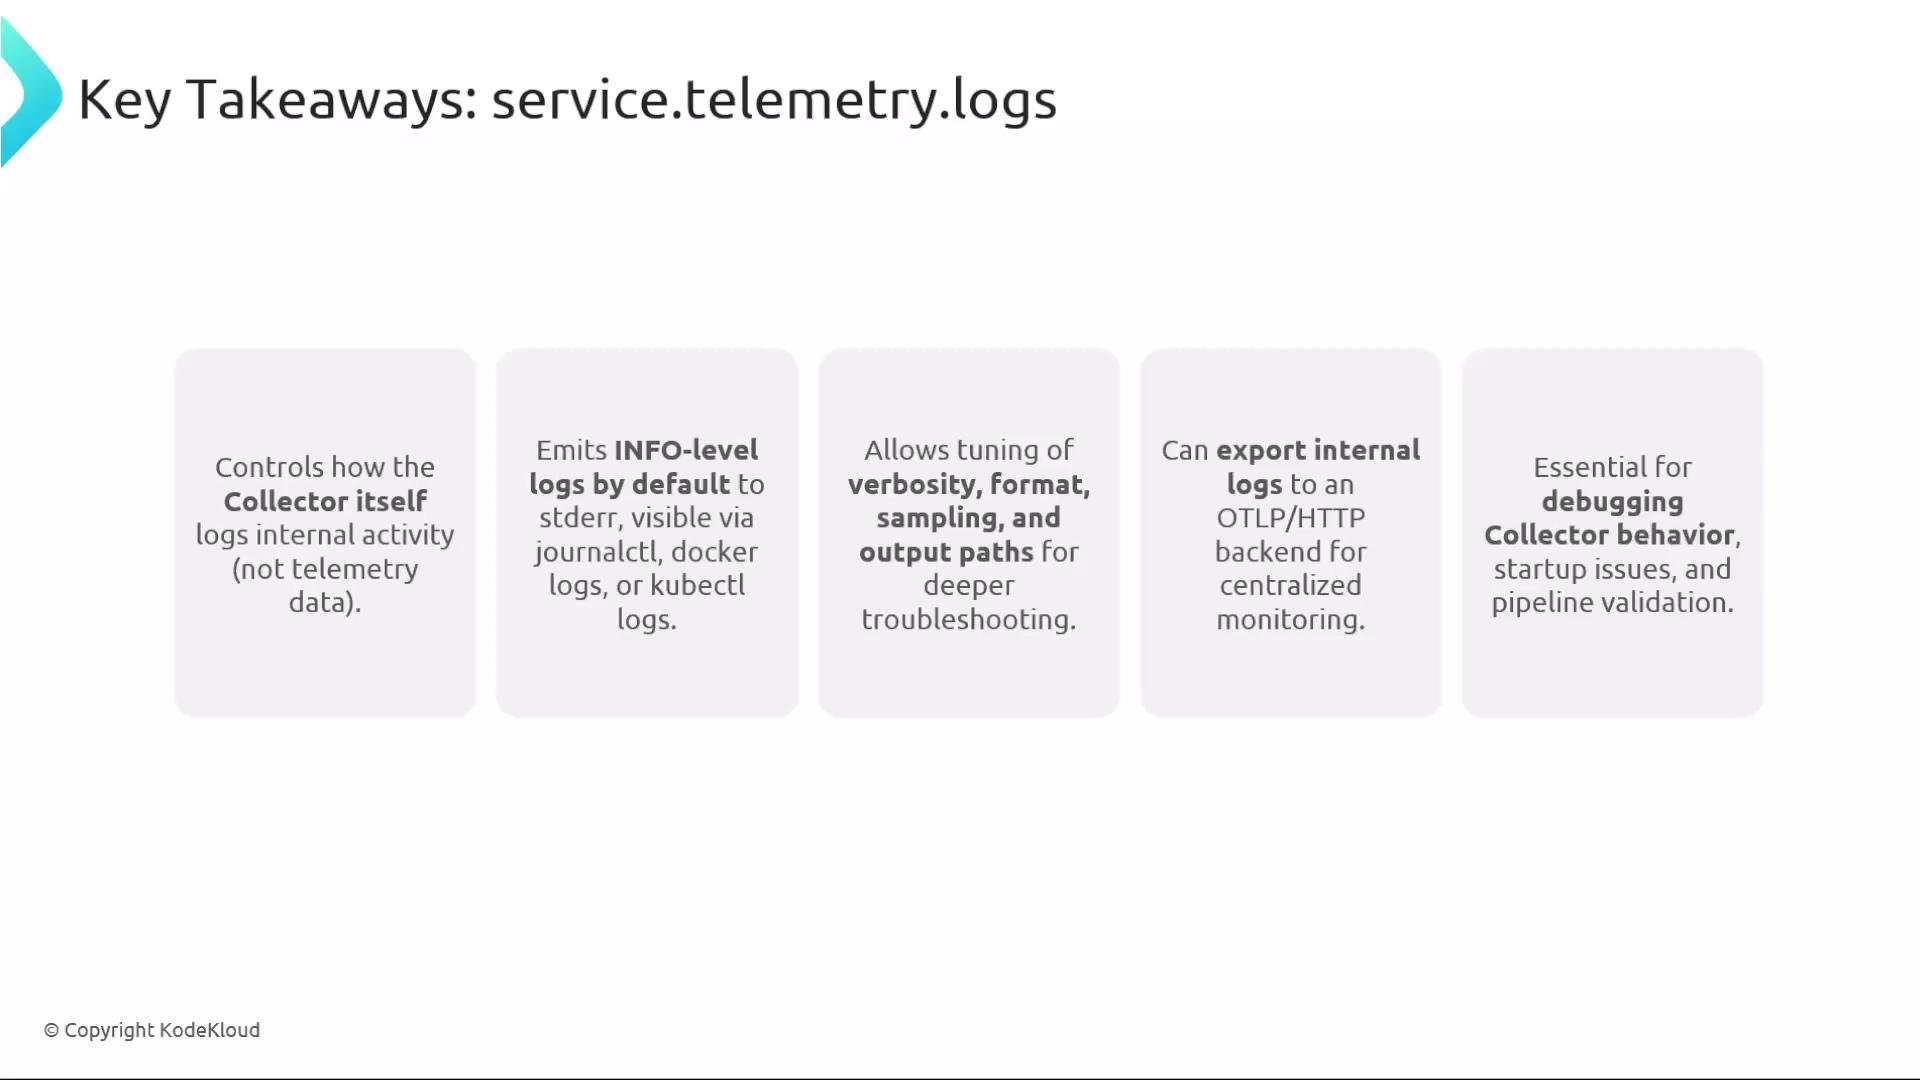
service.telemetry.logs.levelcontrols the Collector’s internal log verbosity (this is separate from telemetry data you collect or export).- By default, the Collector emits INFO-level logs to
stderr. - Use
journalctl,docker logs, orkubectl logsto access Collector logs in common environments. - Tune
level,encoding,sampling, andoutput_pathsto balance visibility and performance. - Persist or forward internal logs to a centralized backend to aid cross-system troubleshooting and historical analysis.
- OpenTelemetry Collector: https://opentelemetry.io/docs/collector/
- Kubernetes logging: https://kubernetes.io/docs/concepts/cluster-administration/logging/