

Log appender / bridge
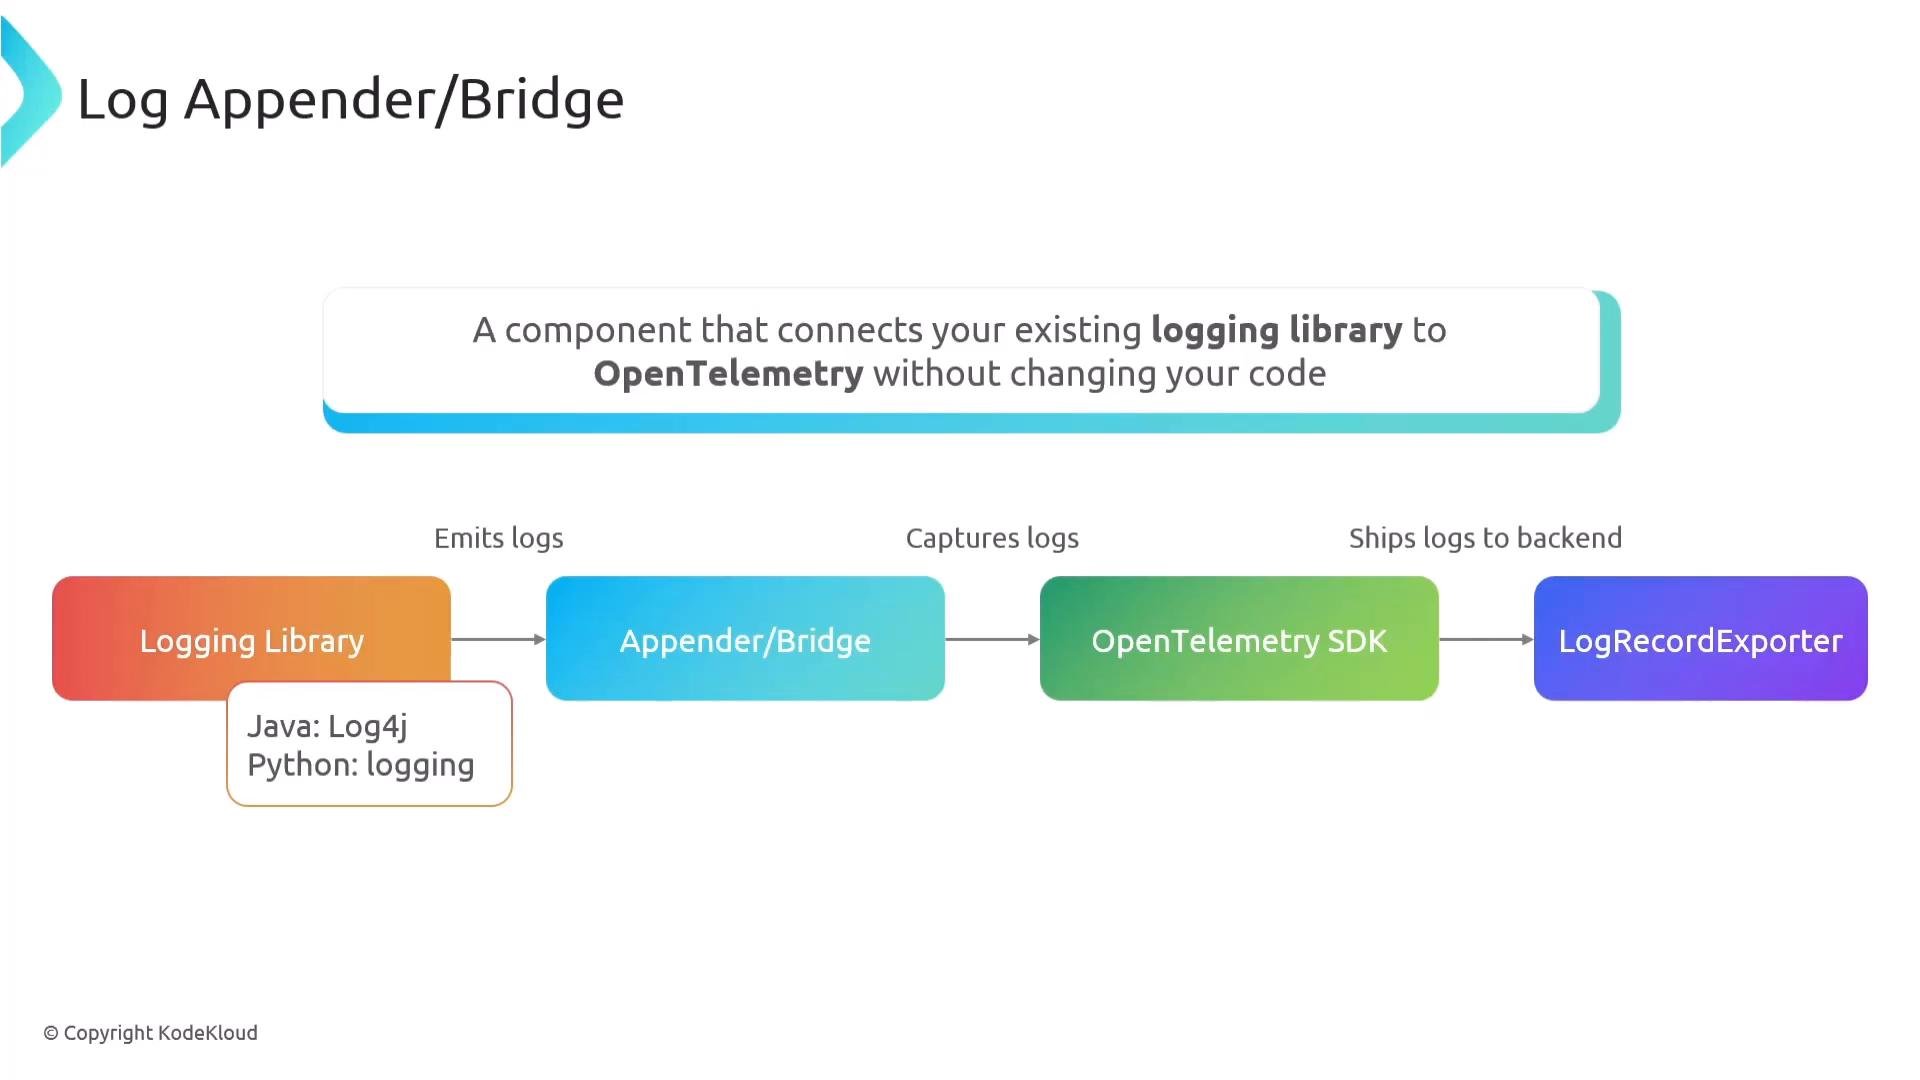
A log appender (also called a bridge) hooks your existing logging framework into OpenTelemetry. Your application continues to call its usual logging APIs (for example,
log.info() or logger.error()); the appender intercepts those calls and forwards standardized, enriched log records to the OpenTelemetry SDK. This lets you adopt OpenTelemetry logging without changing application code.
The exporter commonly sends logs to an OpenTelemetry Collector or directly to an OTLP-compatible backend such as a hosted observability platform.
LoggerProvider
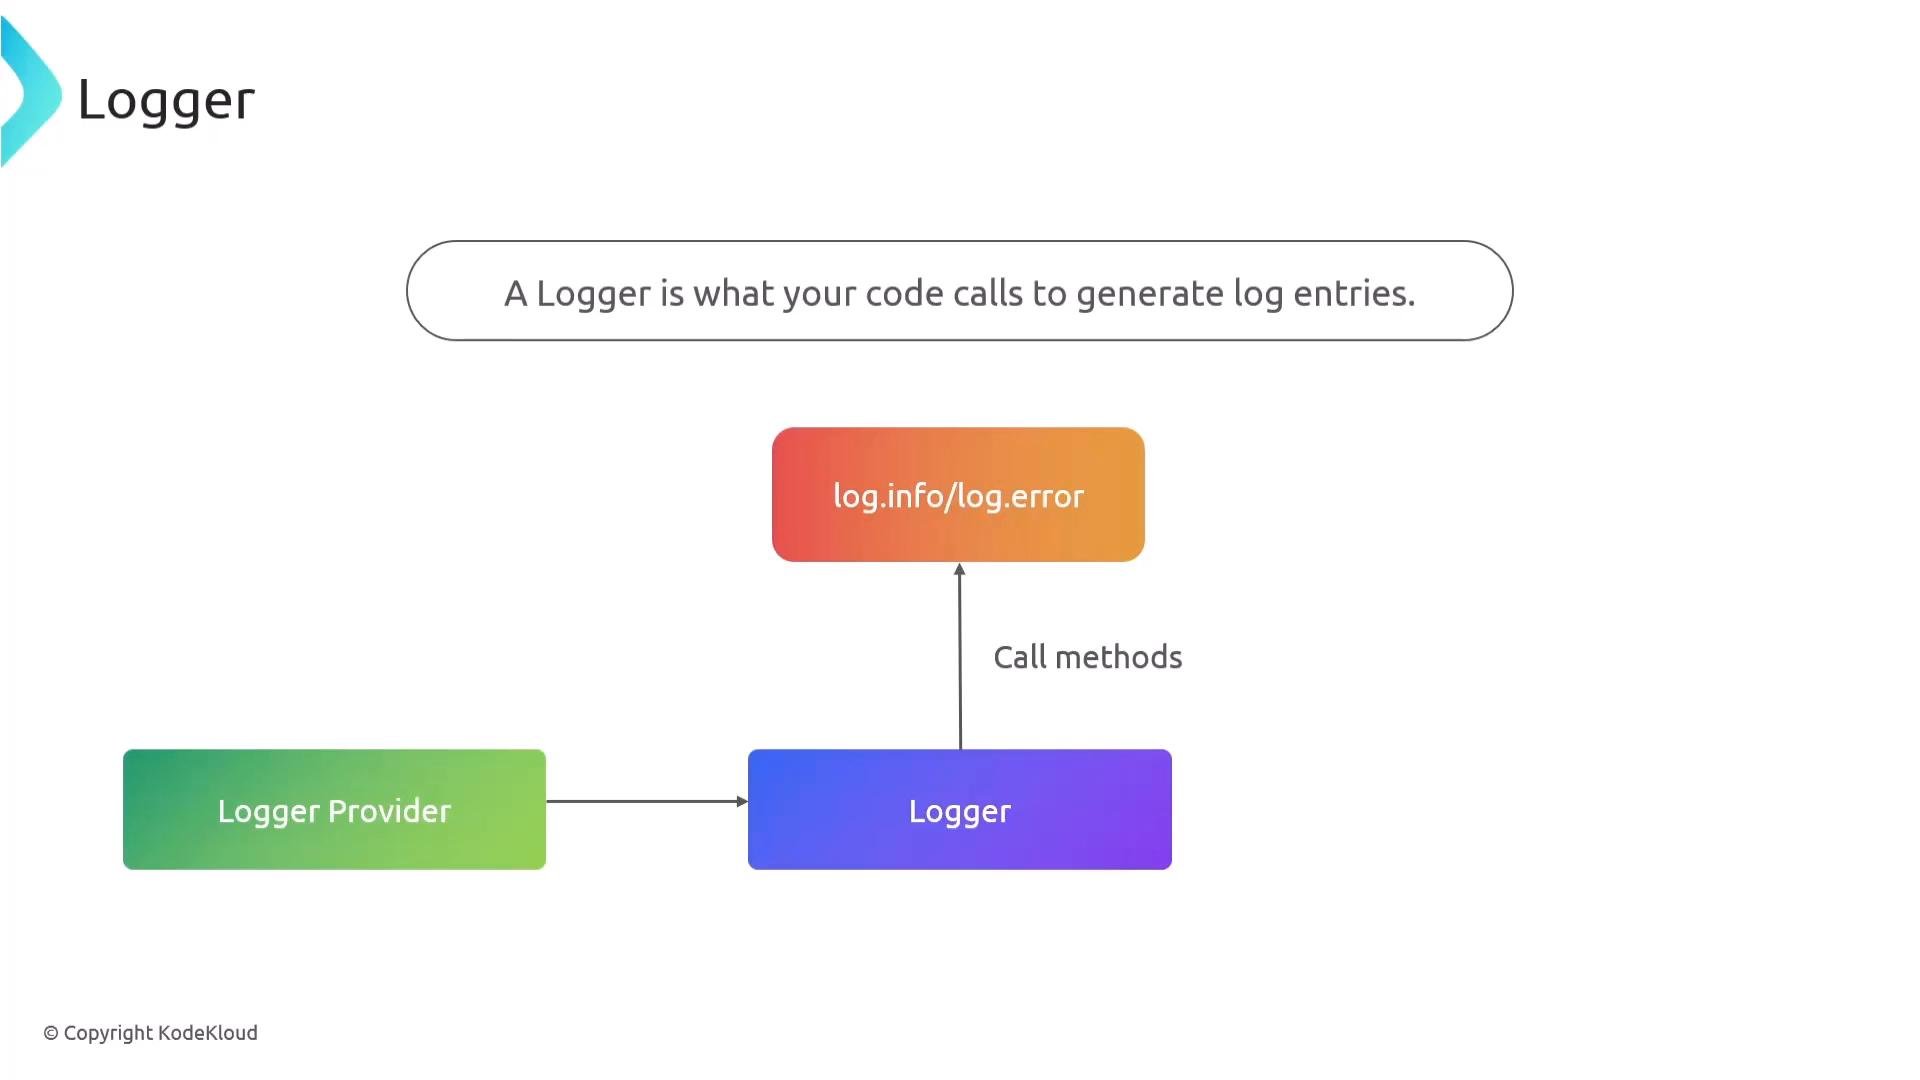
The LoggerProvider is created once per application lifecycle and acts as a centralized factory and manager for all logger instances. Its responsibilities include:
- Creating logger instances used by application code (e.g.,
log.info,log.error). - Configuring resource metadata such as
service.name,service.version, anddeployment.environment. - Wiring exporters that will deliver logs to your backend(s).
- Serving as part of the Log Bridge API to help library authors integrate frameworks consistently with OpenTelemetry.
Initialize the LoggerProvider once per application. Treat it as an application-wide singleton so all loggers inherit the same resource and exporter configuration.
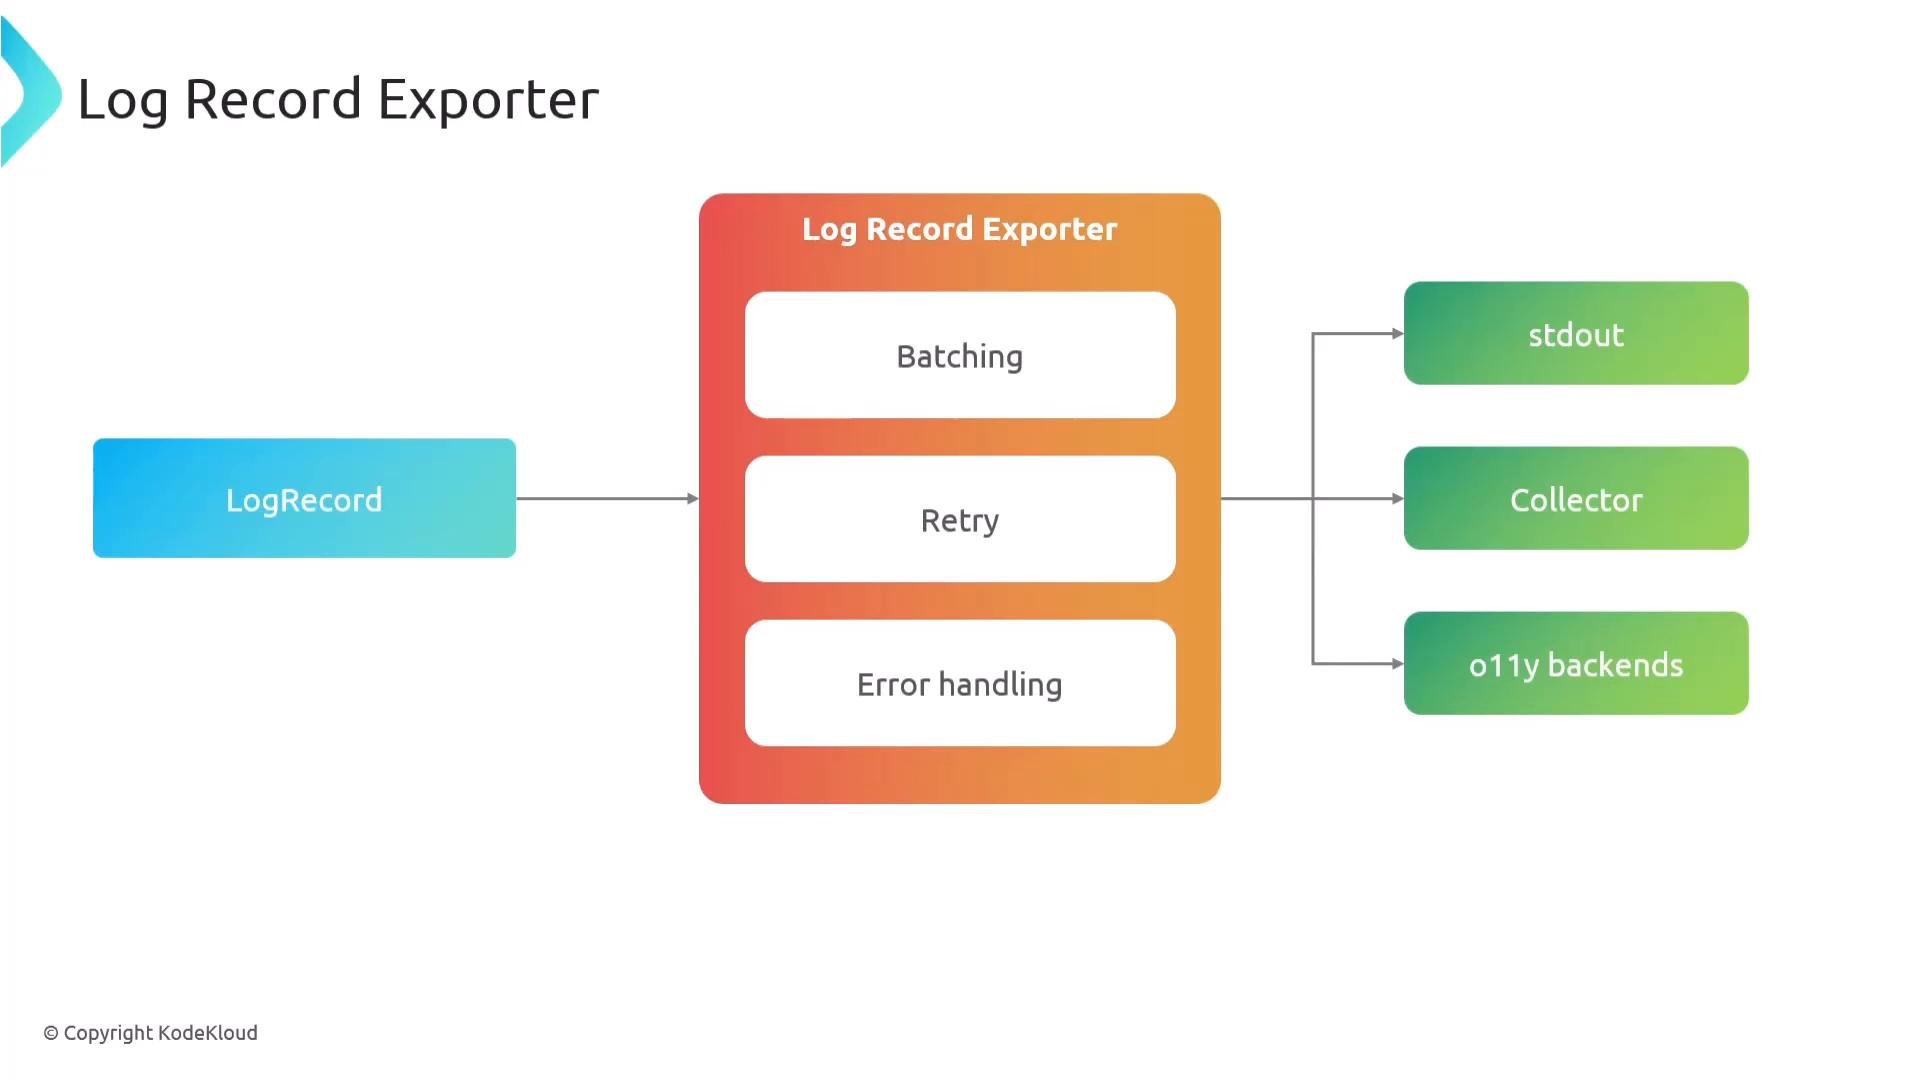
- Batching to reduce overhead and improve throughput.
- Retry logic to handle transient failures.
- Error handling and backpressure strategies.
stdout, for aggregation and enrichment you commonly send logs to an OpenTelemetry Collector, and for long-term storage or analysis you send logs to an observability backend.
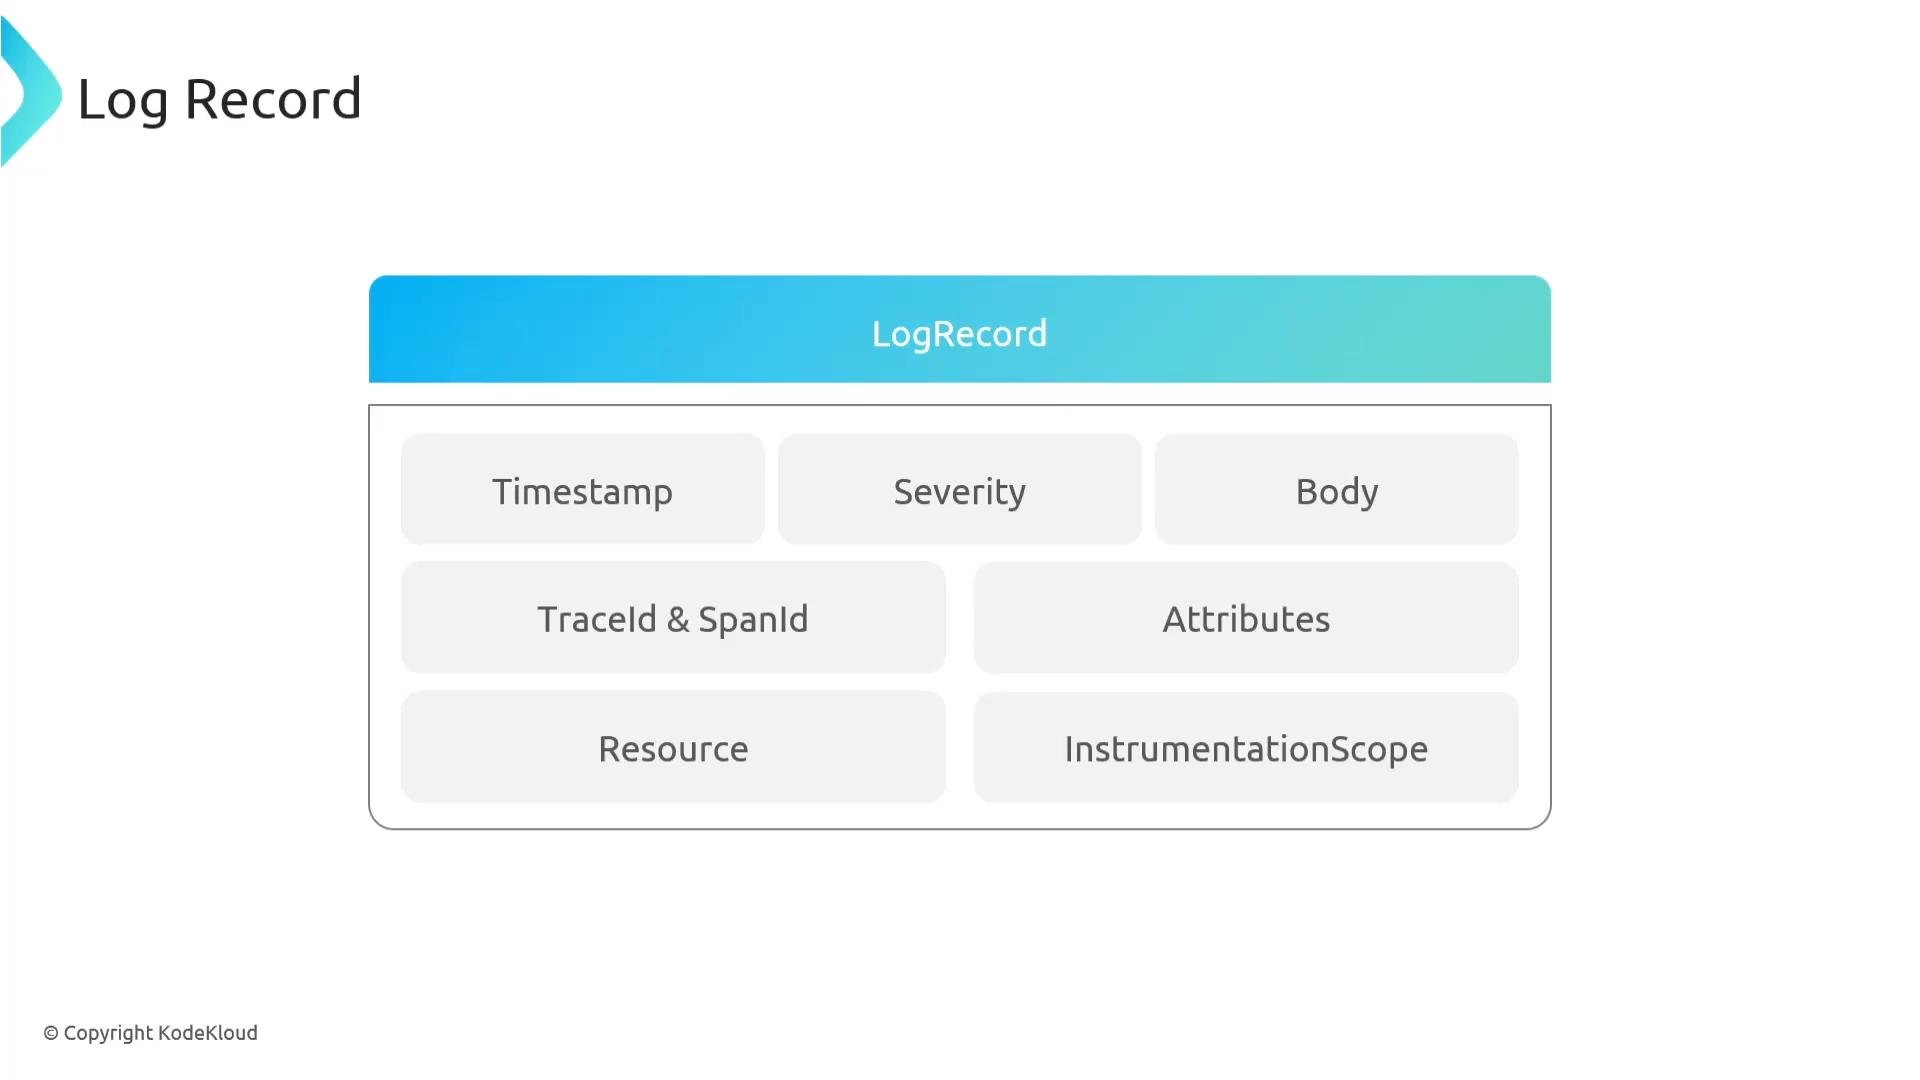
- Timestamp: when the event occurred.
- Severity: severity text and numeric level (e.g., INFO, ERROR).
- Body: the main log message.
- Trace and span IDs: present when a log is emitted during an active span to enable correlation.
- Attributes: structured key/value pairs storing business or contextual metadata.
- Resource: information identifying where the log originated (e.g.,
service.name,host.name, Kubernetes metadata). - Instrumentation scope: the library or module that produced the log.
_source document to illustrate how fields and resource metadata are preserved.
Plain-text log entries (shortened for readability):
_source from a search result):
- Observed timestamp (ingestion timestamp): when the collector or ingest pipeline captured the log.
- Event/timestamp: when the event actually occurred at the source.
- The log appender/bridge integrates existing logging libraries with OpenTelemetry without requiring application code changes.
- Initialize the LoggerProvider once per application so all loggers share the same resource and exporter configuration.
- LogRecord exporters handle batching, retries, and delivery to stdout, an OpenTelemetry Collector, or an observability backend.
- Log records are structured and often include timestamps, severity, body, trace/span correlation (when available), attributes, resource metadata, and instrumentation scope.
- Exporters are pluggable—swap backends without changing application code. Sending logs to the OpenTelemetry Collector is a common production pattern.