In this lesson we examine metric instruments in OpenTelemetry: the primitives that produce metric data points. Every instrument you define begins with a few core parameters: a name and a kind (type). Optionally, you can supply a unit, description, and advisory hints (for example, explicit histogram bucket boundaries). Here’s a typical example that creates a synchronous counter in Python:
  • name: the instrument identifier, e.g. http.requests_total.
  • unit: the measurement unit, e.g. "1" for a simple count.
  • description: a human-readable explanation of what the instrument measures.
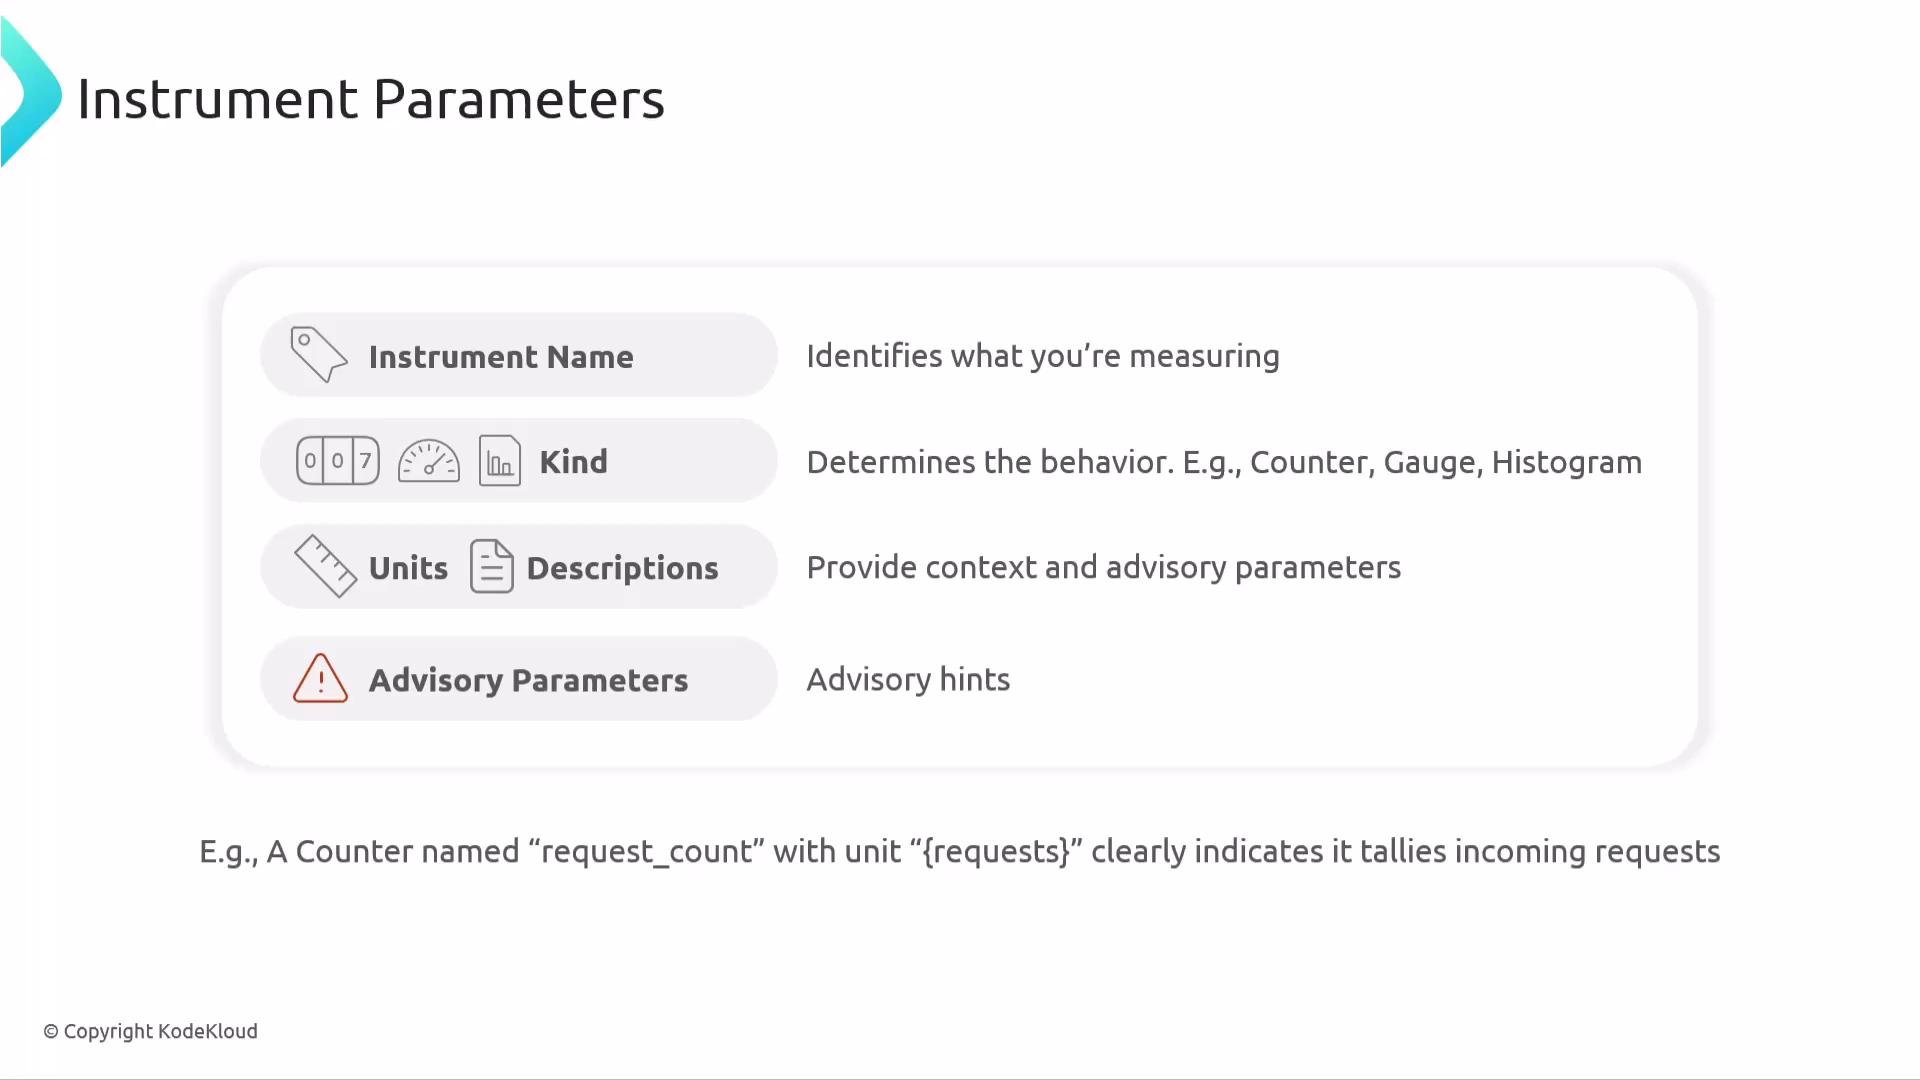
The image outlines the components of "Instrument Parameters," including Instrument Name, Kind, Units, Descriptions, and Advisory Parameters, with descriptions of their purposes. It also includes an example of a "Counter" named "request_count" that tallies incoming requests.
Instrument parameters (quick reference)
  • Instrument name: identifies what is being measured (for example, request_count or http.requests_total).
  • Kind: determines the instrument behavior (Counter, Gauge/ObservableGauge, Histogram, UpDownCounter, and their async counterparts).
  • Unit and description: give context so humans and backends can interpret values correctly.
  • Advisory hints: optional guidance such as explicit histogram bucket boundaries.
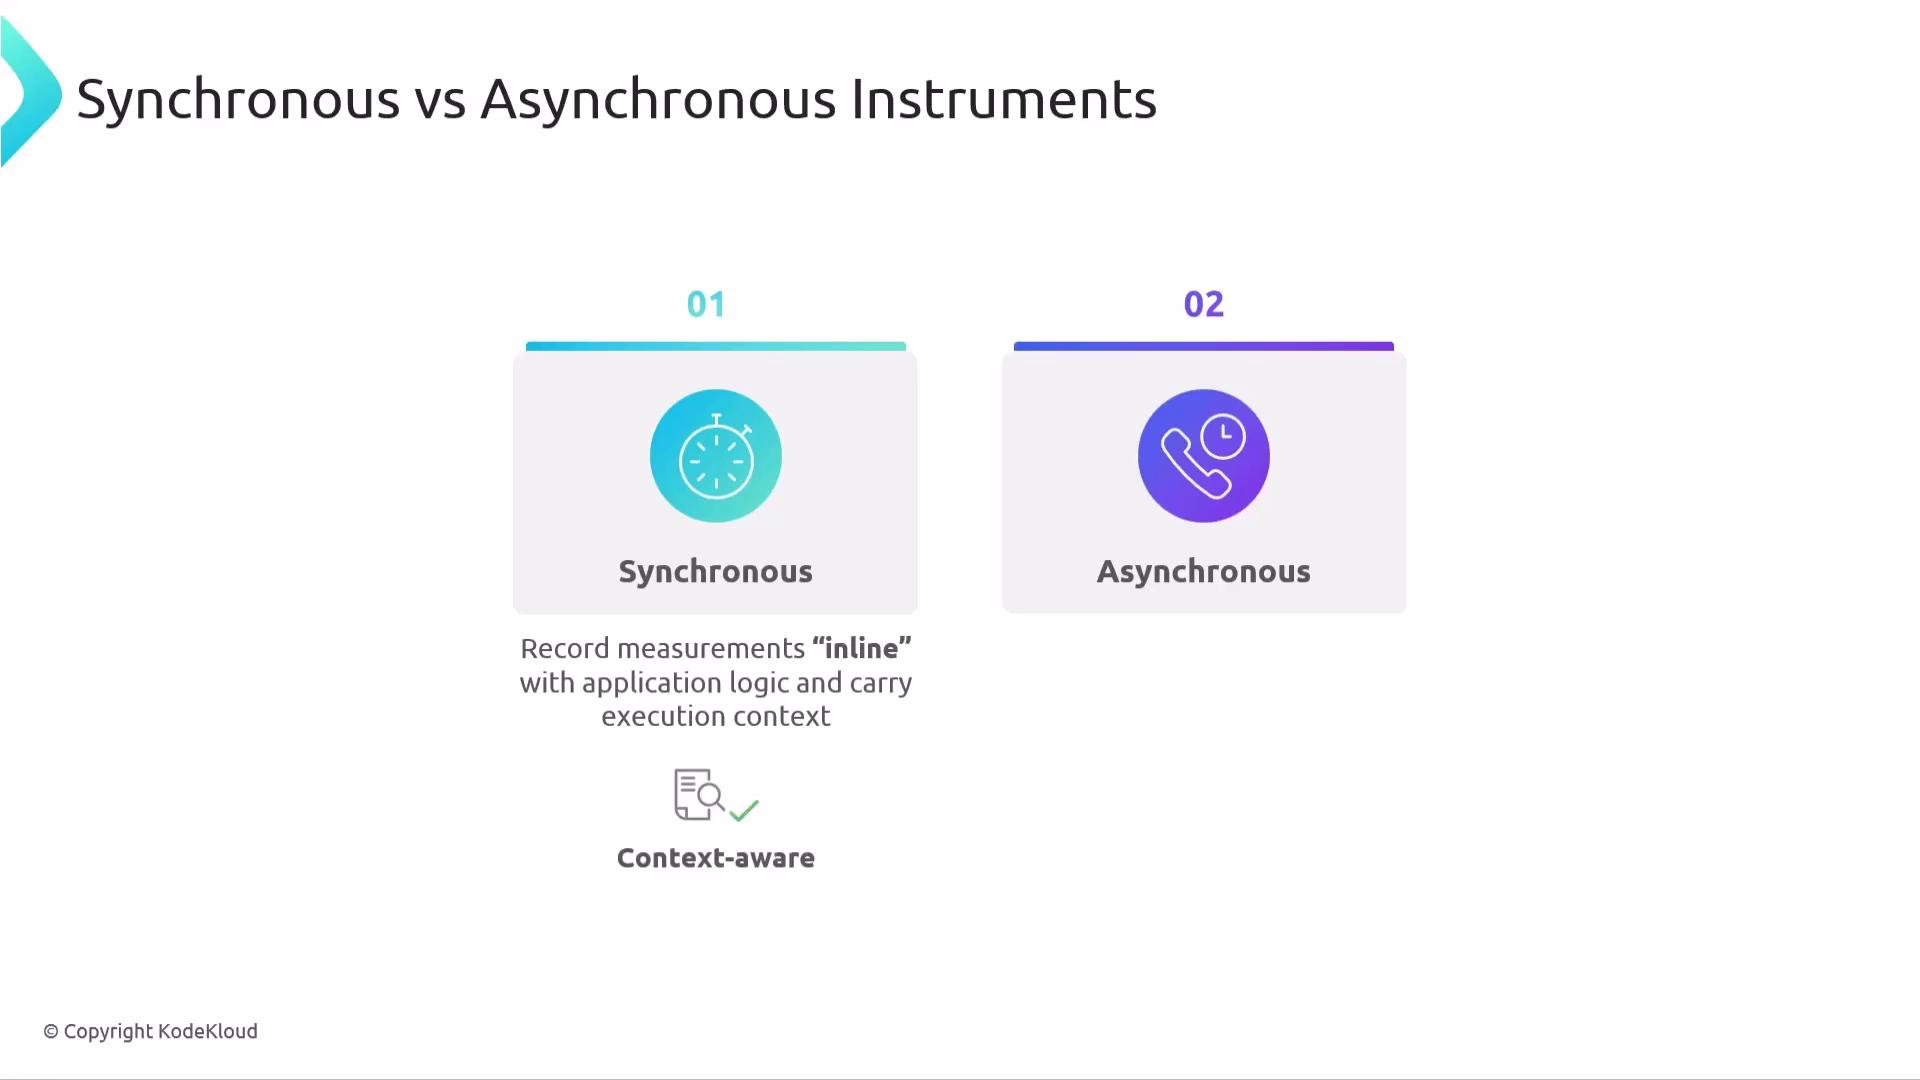
OpenTelemetry instruments are grouped into synchronous and asynchronous types. Synchronous instruments record measurements inline within application logic. They run on the same thread and carry the active execution context, so recorded values can be associated with the current trace/span and other contextual attributes.
The image compares synchronous and asynchronous instruments, highlighting that synchronous measurements are recorded "inline" with application logic and are context-aware.
Asynchronous callbacks typically run without an active trace/span context. Do not rely on trace context inside asynchronous callbacks—design async metrics to be context-independent.
Asynchronous instruments are callback-driven and report values at collection time. They are ideal when periodic or on-request snapshots are sufficient and when frequent synchronous updates are unnecessary. Instrument types and when to use them
  • Counter (synchronous)
    • Records increases only (monotonic).
    • Synchronous: can be associated with the current trace/span and context.
    • Use for counting events such as completed orders, processed requests, or errors in real time.
    • Aggregation: sum.
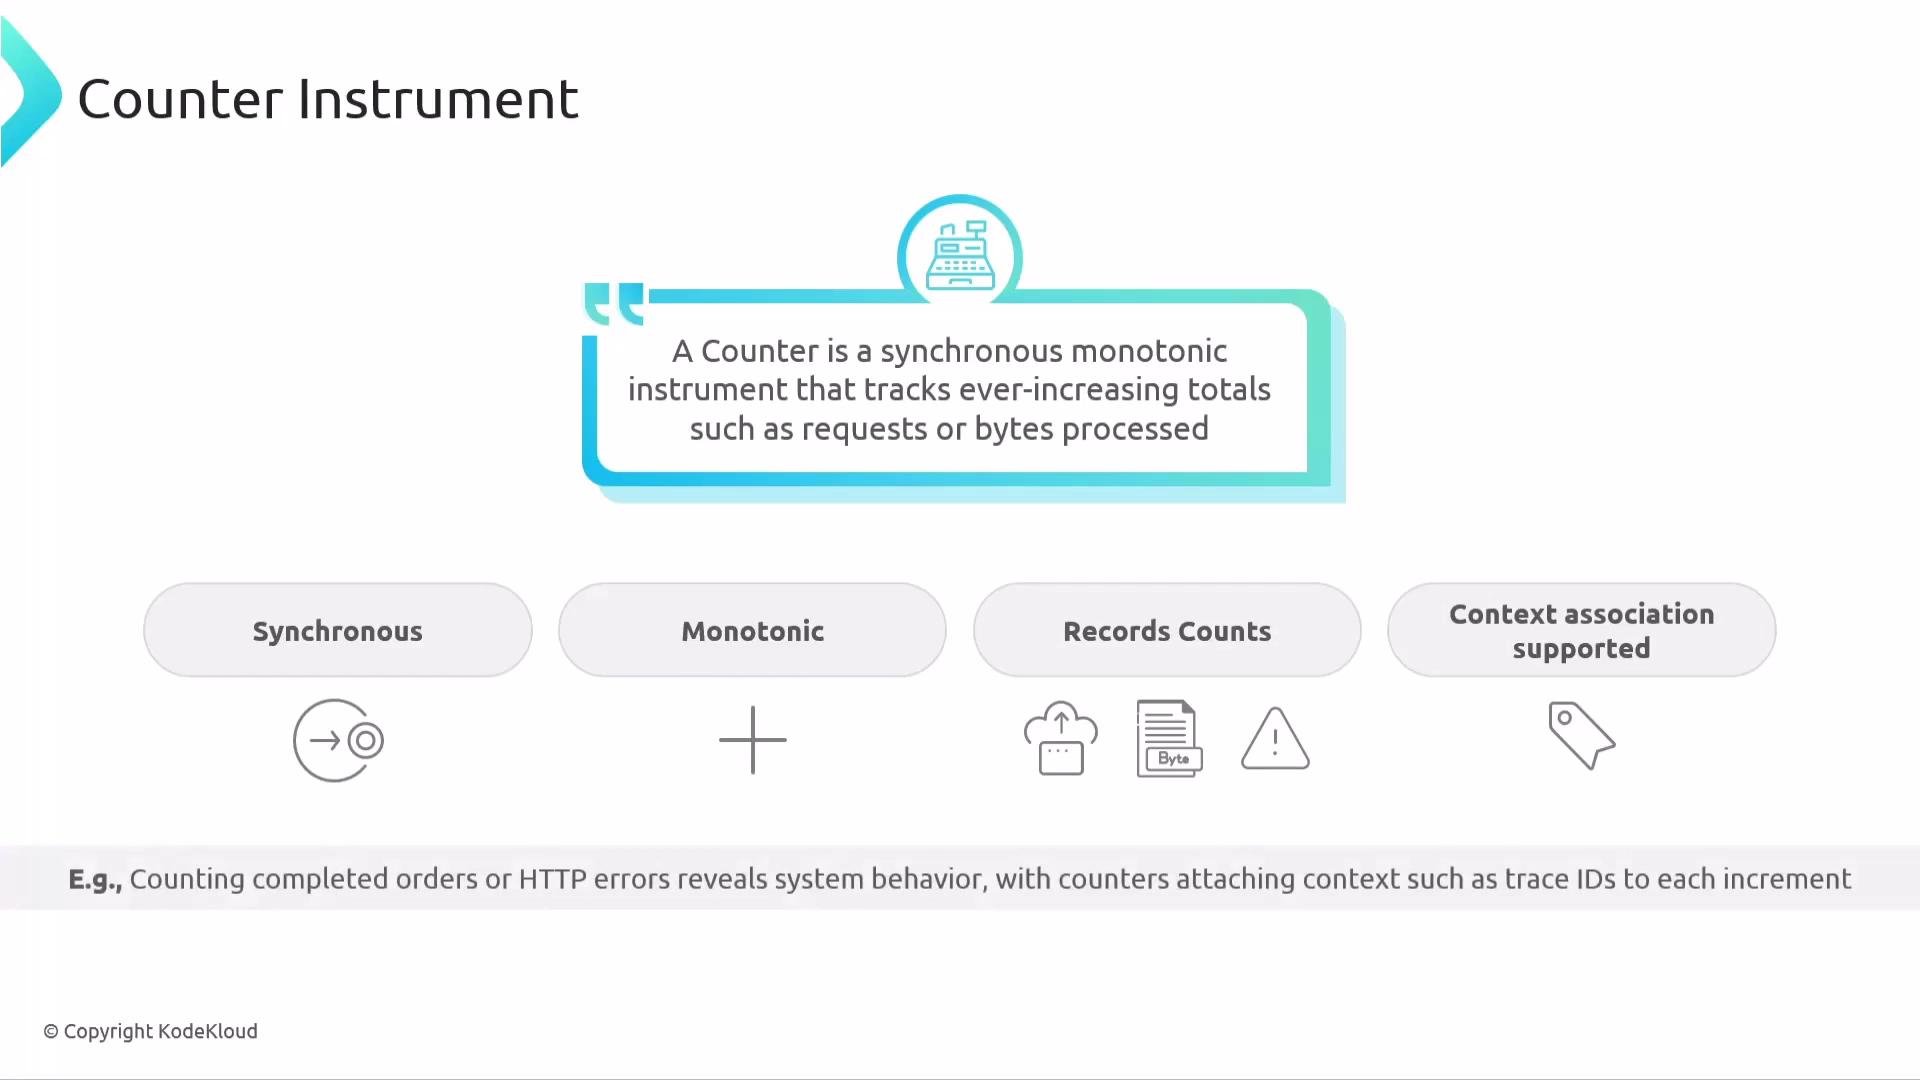
The image describes a "Counter Instrument," which is a synchronous monotonic tool that tracks ever-increasing totals like requests or bytes processed. It highlights features such as synchrony, monotonic behavior, count recording, and context association.
  • Asynchronous Counter
    • Callback-based: the SDK invokes a function at collection time to obtain a reported value.
    • Monotonic: typically used to represent cumulative totals (depending on how the callback reports the metric).
    • No guaranteed context association during callback execution.
    • Use for metrics like total bytes transmitted since process start, where continuous synchronous updates are unnecessary.
Example asynchronous counter callback (Python pseudocode):
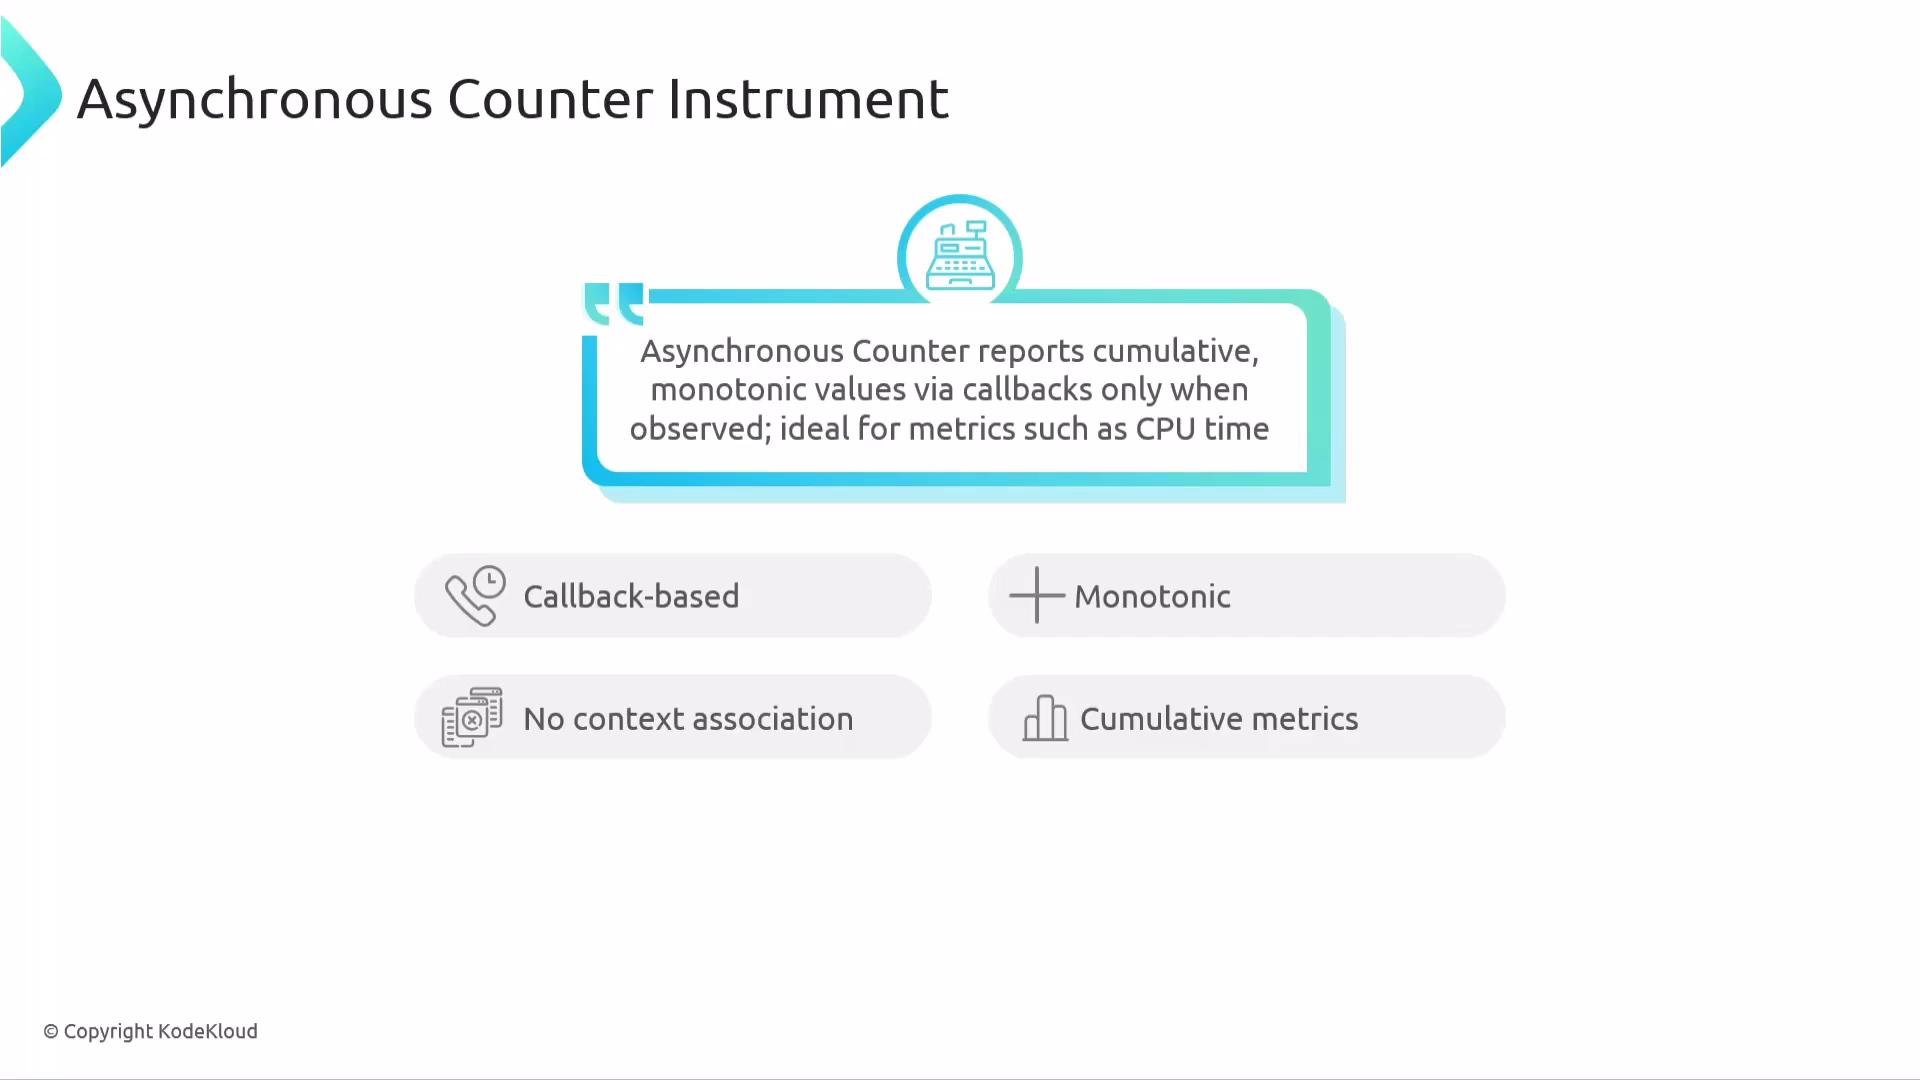
The image describes an "Asynchronous Counter Instrument," highlighting its use for reporting cumulative, monotonic values via callbacks, and its characteristics like being ideal for metrics such as CPU time, callback-based, and having no context association.
  • Histogram (synchronous)
    • Records arbitrary values (not restricted to monotonic increases).
    • Produces statistical summaries such as percentiles and distributions (backends compute percentiles from histogram aggregates).
    • Useful for response times, payload sizes, or any measurement where distribution matters.
    • Aggregation: histogram (bucketed distribution).
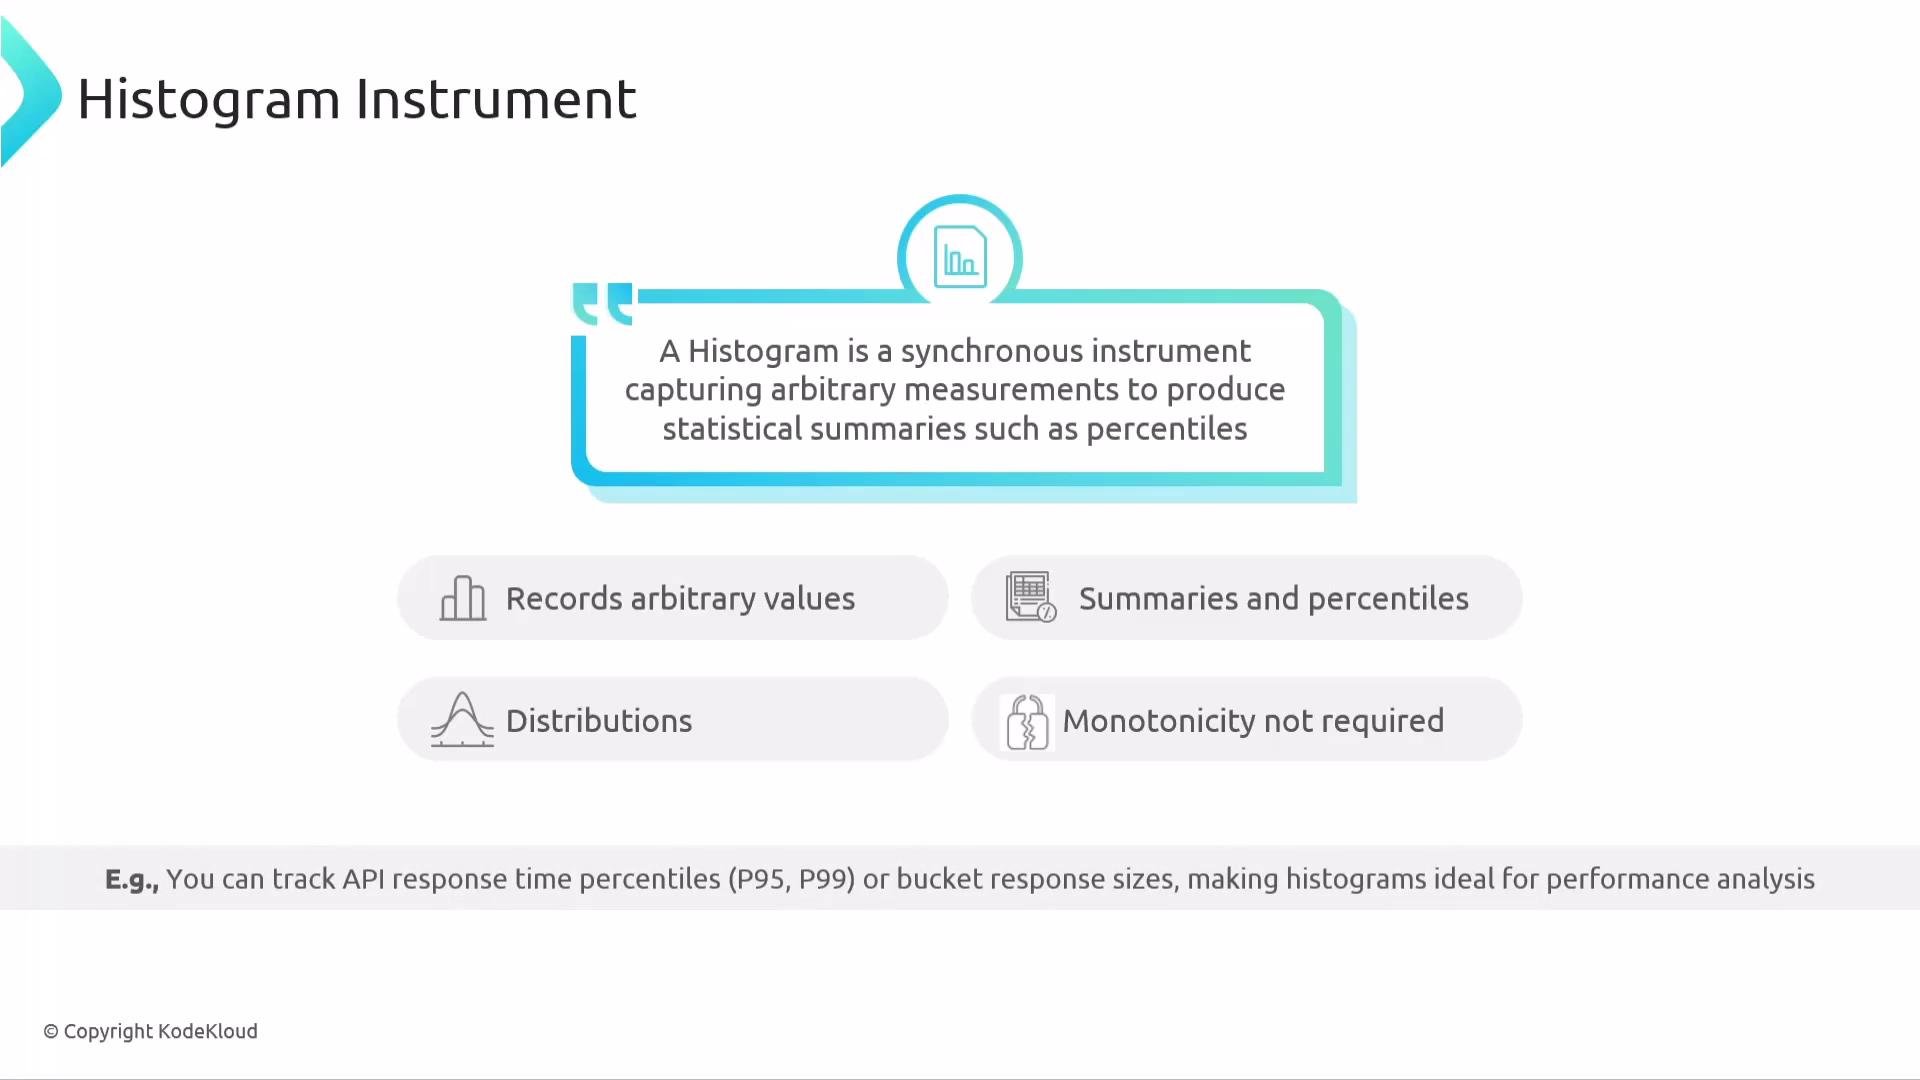
The image describes a histogram instrument as a tool for capturing arbitrary measurements to produce statistical summaries like percentiles. It lists features such as recording arbitrary values, generating summaries and percentiles, understanding distributions, and not requiring monotonicity.
  • Gauge (last-value snapshot)
    • Represents a current state or snapshot (values can go up or down).
    • Non-additive and typically uses last-value aggregation.
    • In OpenTelemetry, gauges are commonly implemented as observable (asynchronous) instruments reported via callbacks (ObservableGauge). Some SDKs may also offer last-value synchronous instruments—behavior and context association depend on the SDK.
    • Ideal for CPU usage, memory usage, queue length, active user counts, or any value representing current state.
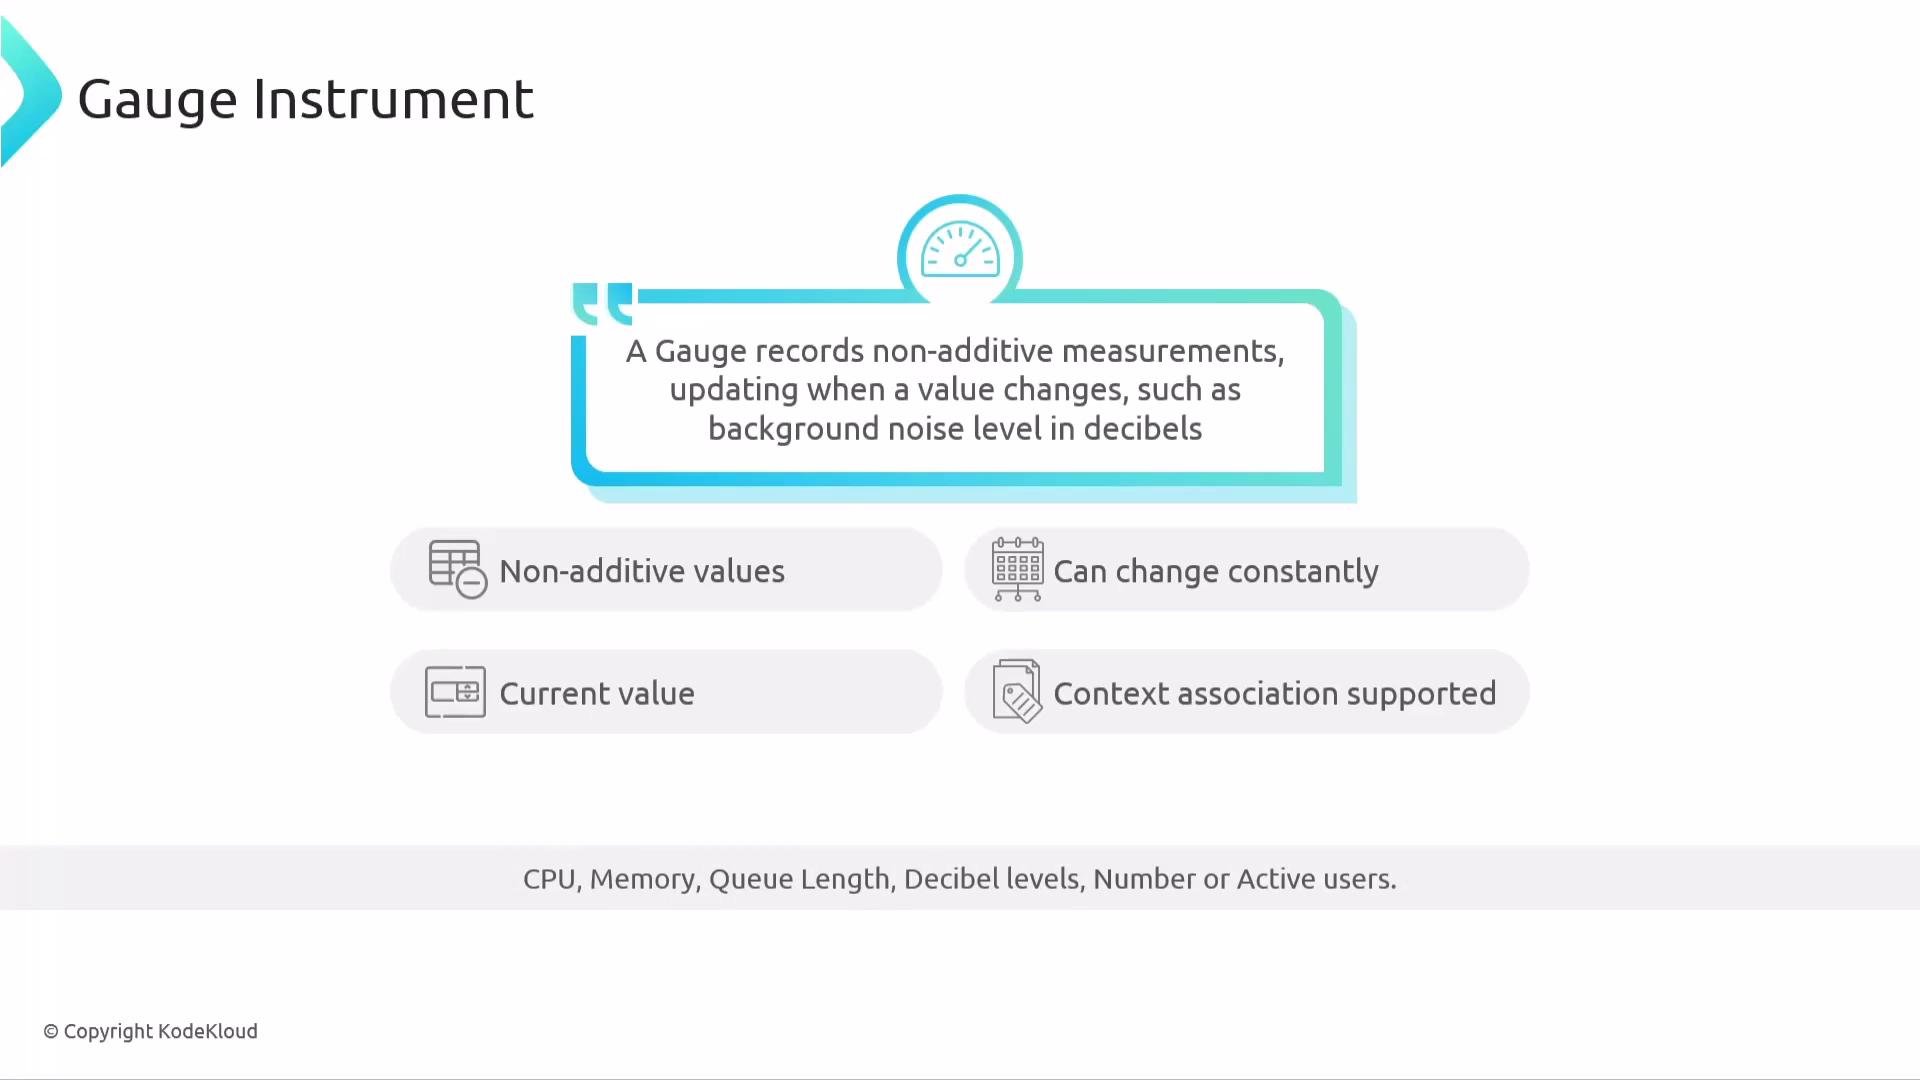
The image is an infographic about a gauge instrument, describing it as recording non-additive measurements that update with changes in values, such as background noise levels, and highlighting features like non-additive values, constant changes, current value, and context association.
  • Asynchronous Gauge
    • Callback-based snapshot collected on demand (ObservableGauge).
    • No guaranteed context association during callback execution.
    • Use for periodically sampled readings such as disk space remaining, battery level, thread count, temperature, or humidity.
  • UpDownCounter (synchronous)
    • Supports both increments and decrements (non-monotonic).
    • Additive aggregation (sum), but values can go up or down.
    • Synchronous version supports context association.
    • Use for dynamic counts like queue sizes, active connections, or concurrent requests.
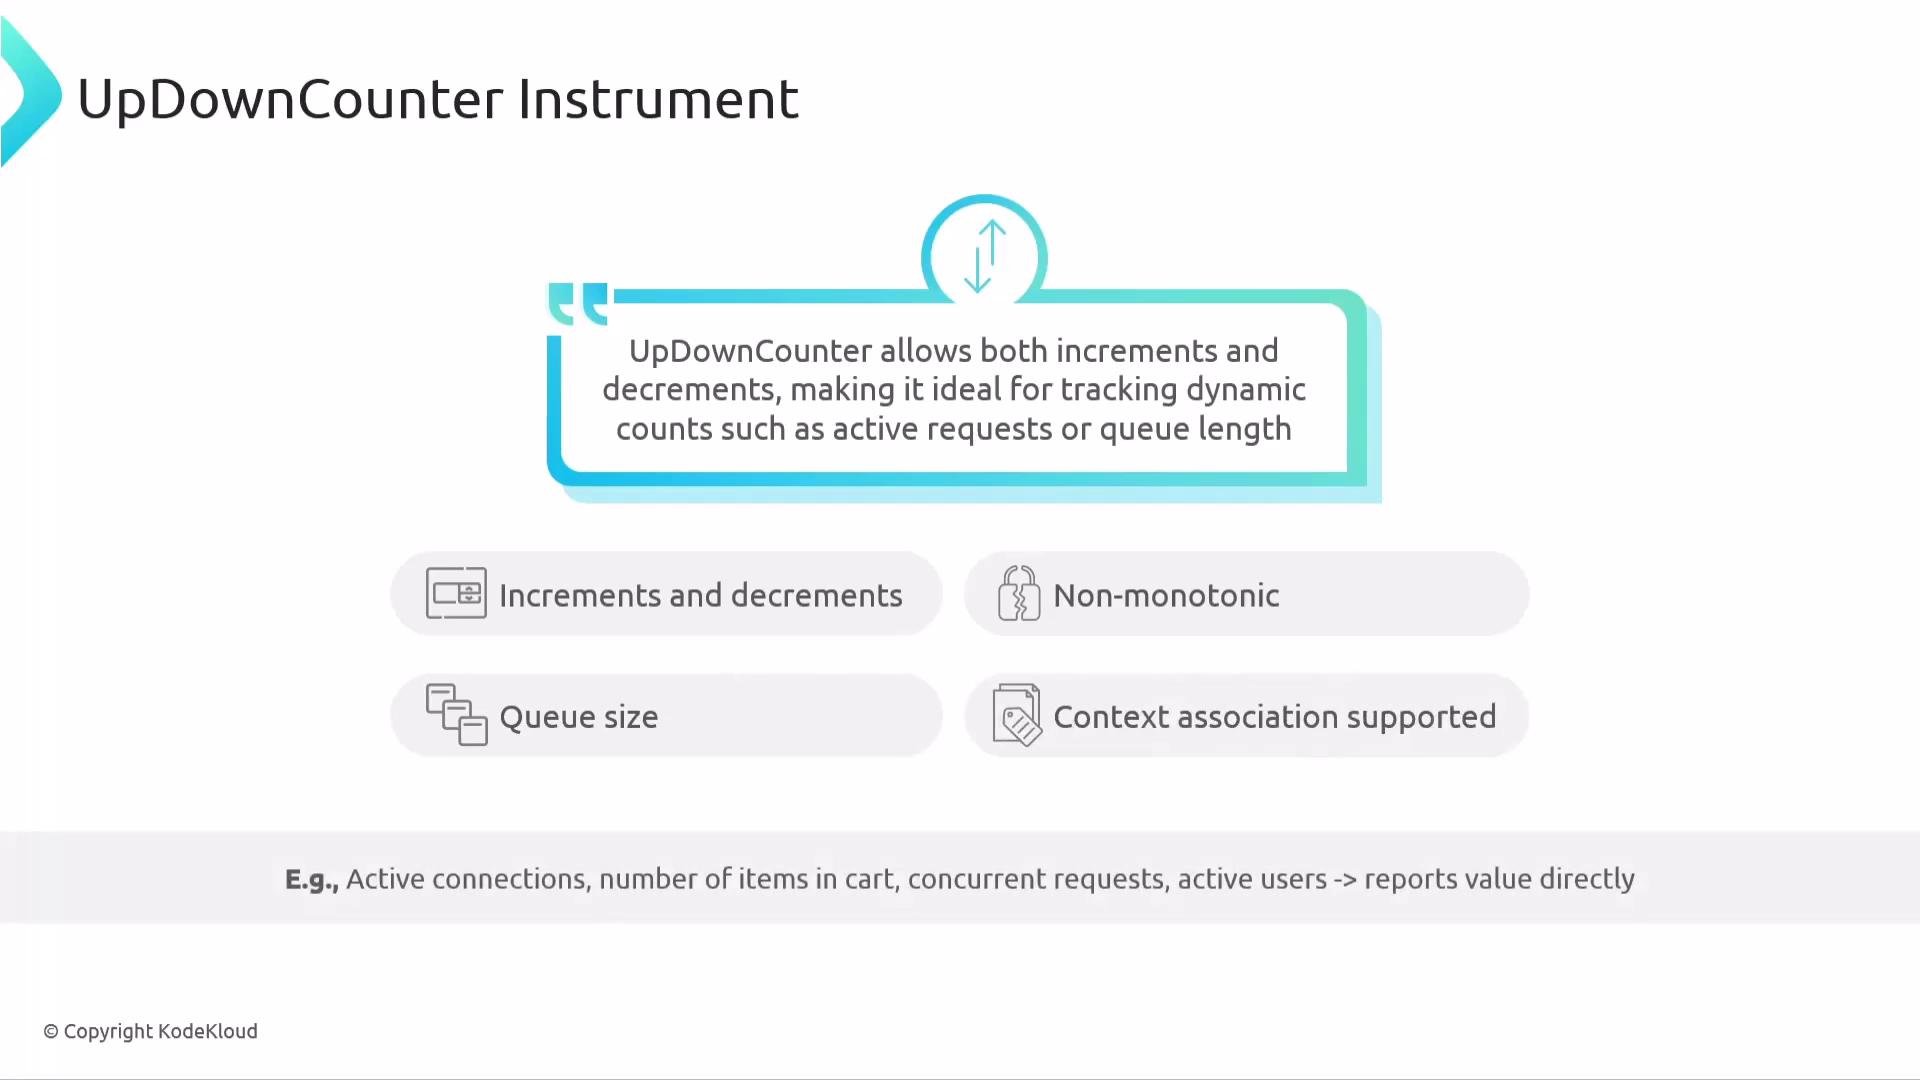
The image is a presentation slide about the UpDownCounter Instrument, highlighting its features such as tracking increments and decrements, non-monotonic behavior, queue size, and context association. It is useful for tracking dynamic counts like active requests or queue length.
  • Asynchronous UpDownCounter
    • Callback-based, reports additive snapshots but values can increase or decrease (ObservableUpDownCounter).
    • No guaranteed context association during callback execution.
    • Use cases: number of running processes, open file descriptors, connected clients—metrics collected periodically via a callback.
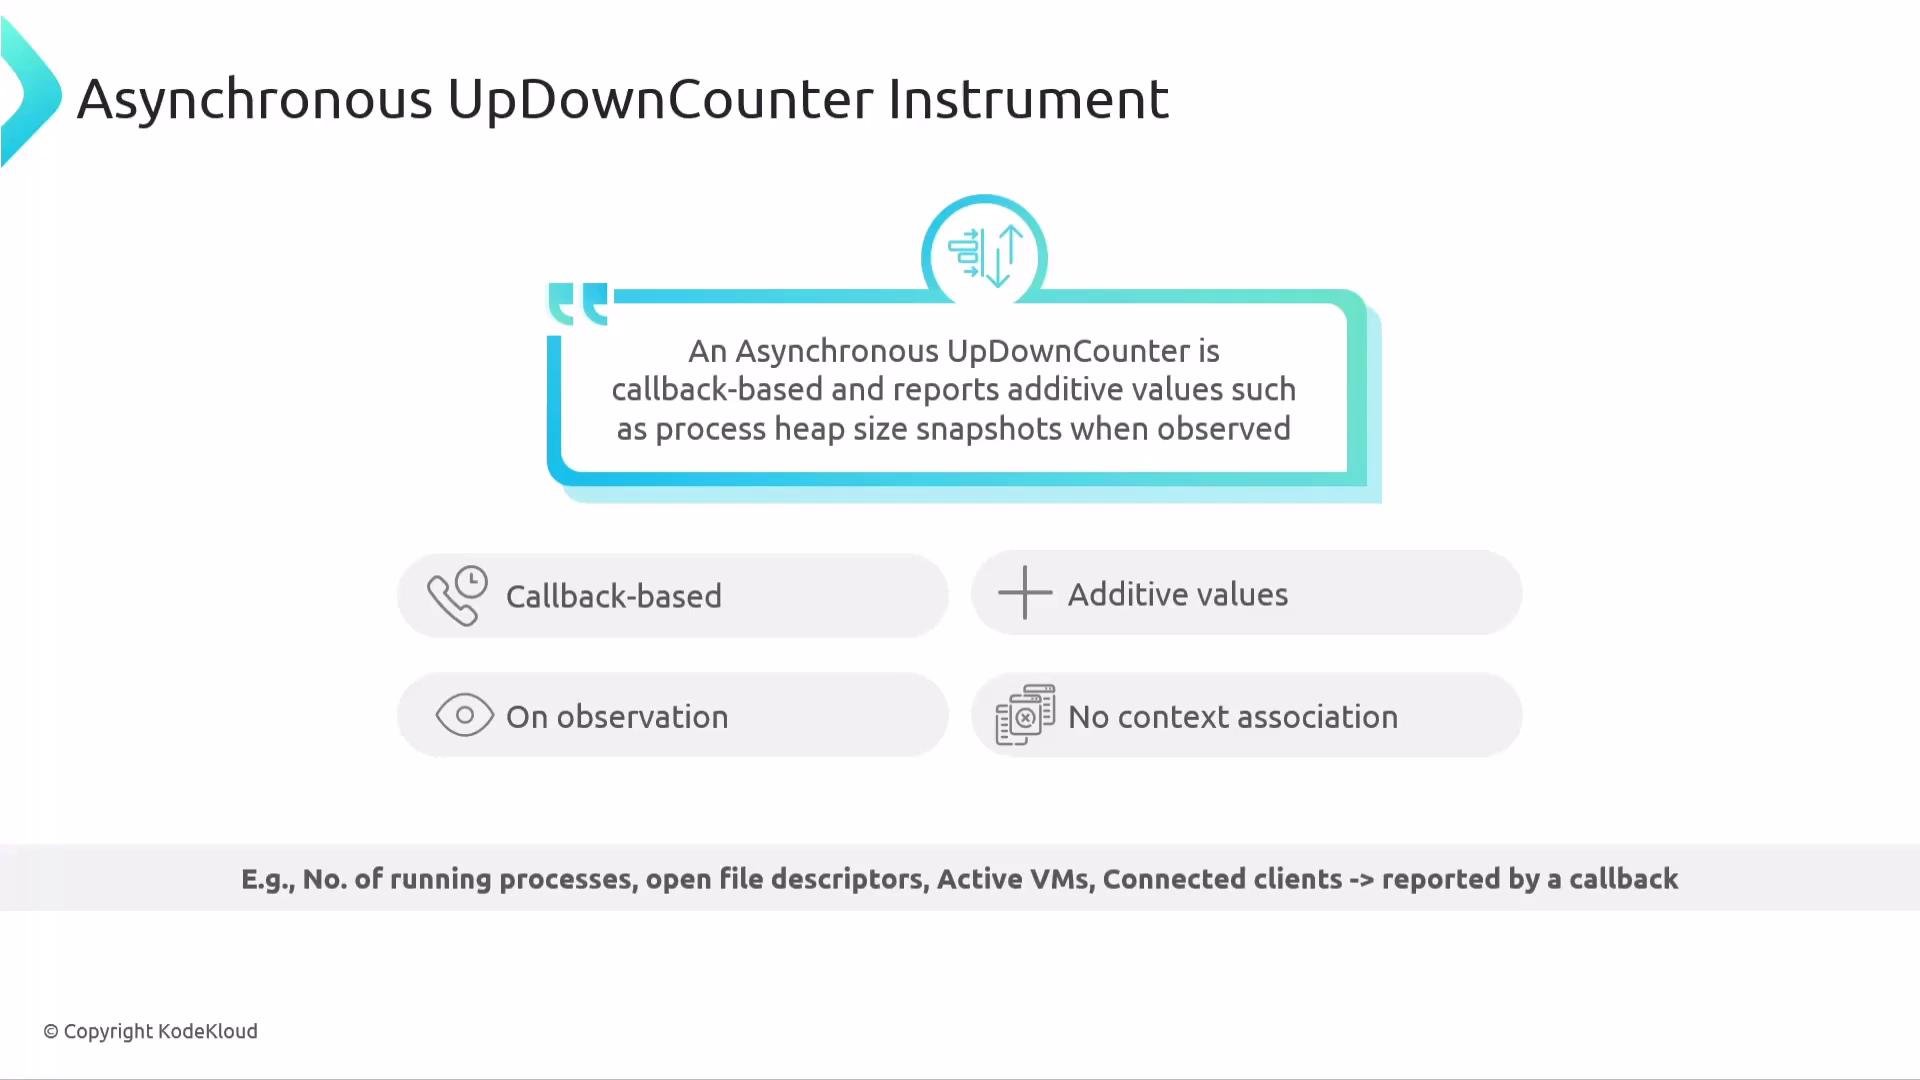
The image describes the "Asynchronous UpDownCounter Instrument," highlighting that it is callback-based, reports additive values such as process snapshots, and operates on observation without context association. Examples include running processes and open file descriptors reported by a callback.
Comparison summary (behavior and aggregation)
InstrumentBehaviorAggregationTypical use cases
Counter (sync) / Async CounterAdditive, monotonic. Sync is context-aware; async is callback-based.SumEvent counts, total requests, bytes transmitted
Histogram (sync)Non-additive, non-monotonic; records distributionsHistogram (bucketed)Latencies, payload sizes, response time distributions
Gauge (ObservableGauge)Non-additive, non-monotonic; last-value snapshotLast-valueCPU, memory, queue length, live counts
UpDownCounter (sync) / Async UpDownCounterAdditive but non-monotonic; sync supports contextSumQueue size, active connections, running processes
Choose the instrument that matches how you want the metric to behave and how your backend will aggregate it:
  • Counter: count occurrences over time (monotonic sum).
  • UpDownCounter: counts that can increase or decrease (e.g., active sessions).
  • Gauge / ObservableGauge: current-state snapshots (last-value).
  • Histogram: distributions and percentiles (latencies, sizes).
That covers the key metric instruments in OpenTelemetry: counters, up-down counters, gauges (last-value/observable), histograms, and their asynchronous counterparts. Select instruments based on metric semantics, collection cadence, and whether you need trace/context association. Links and references

Watch Video