

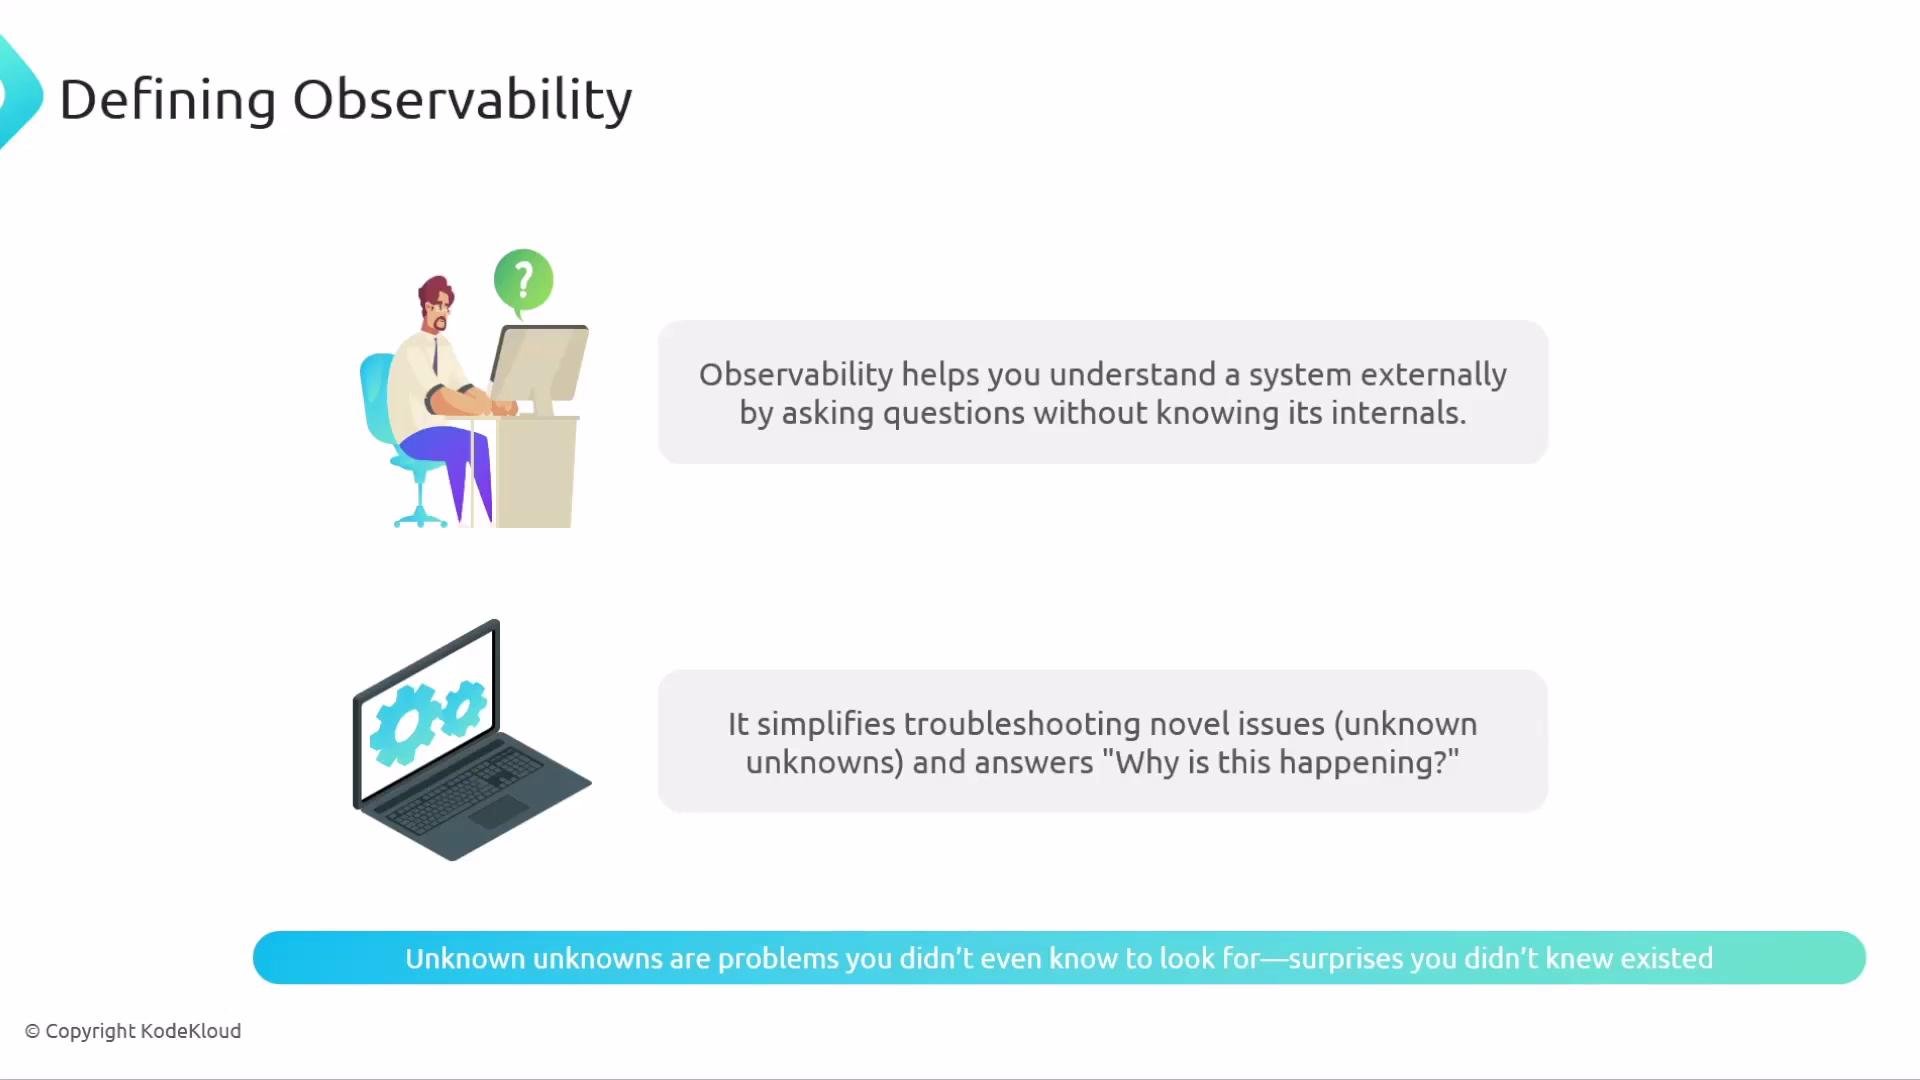
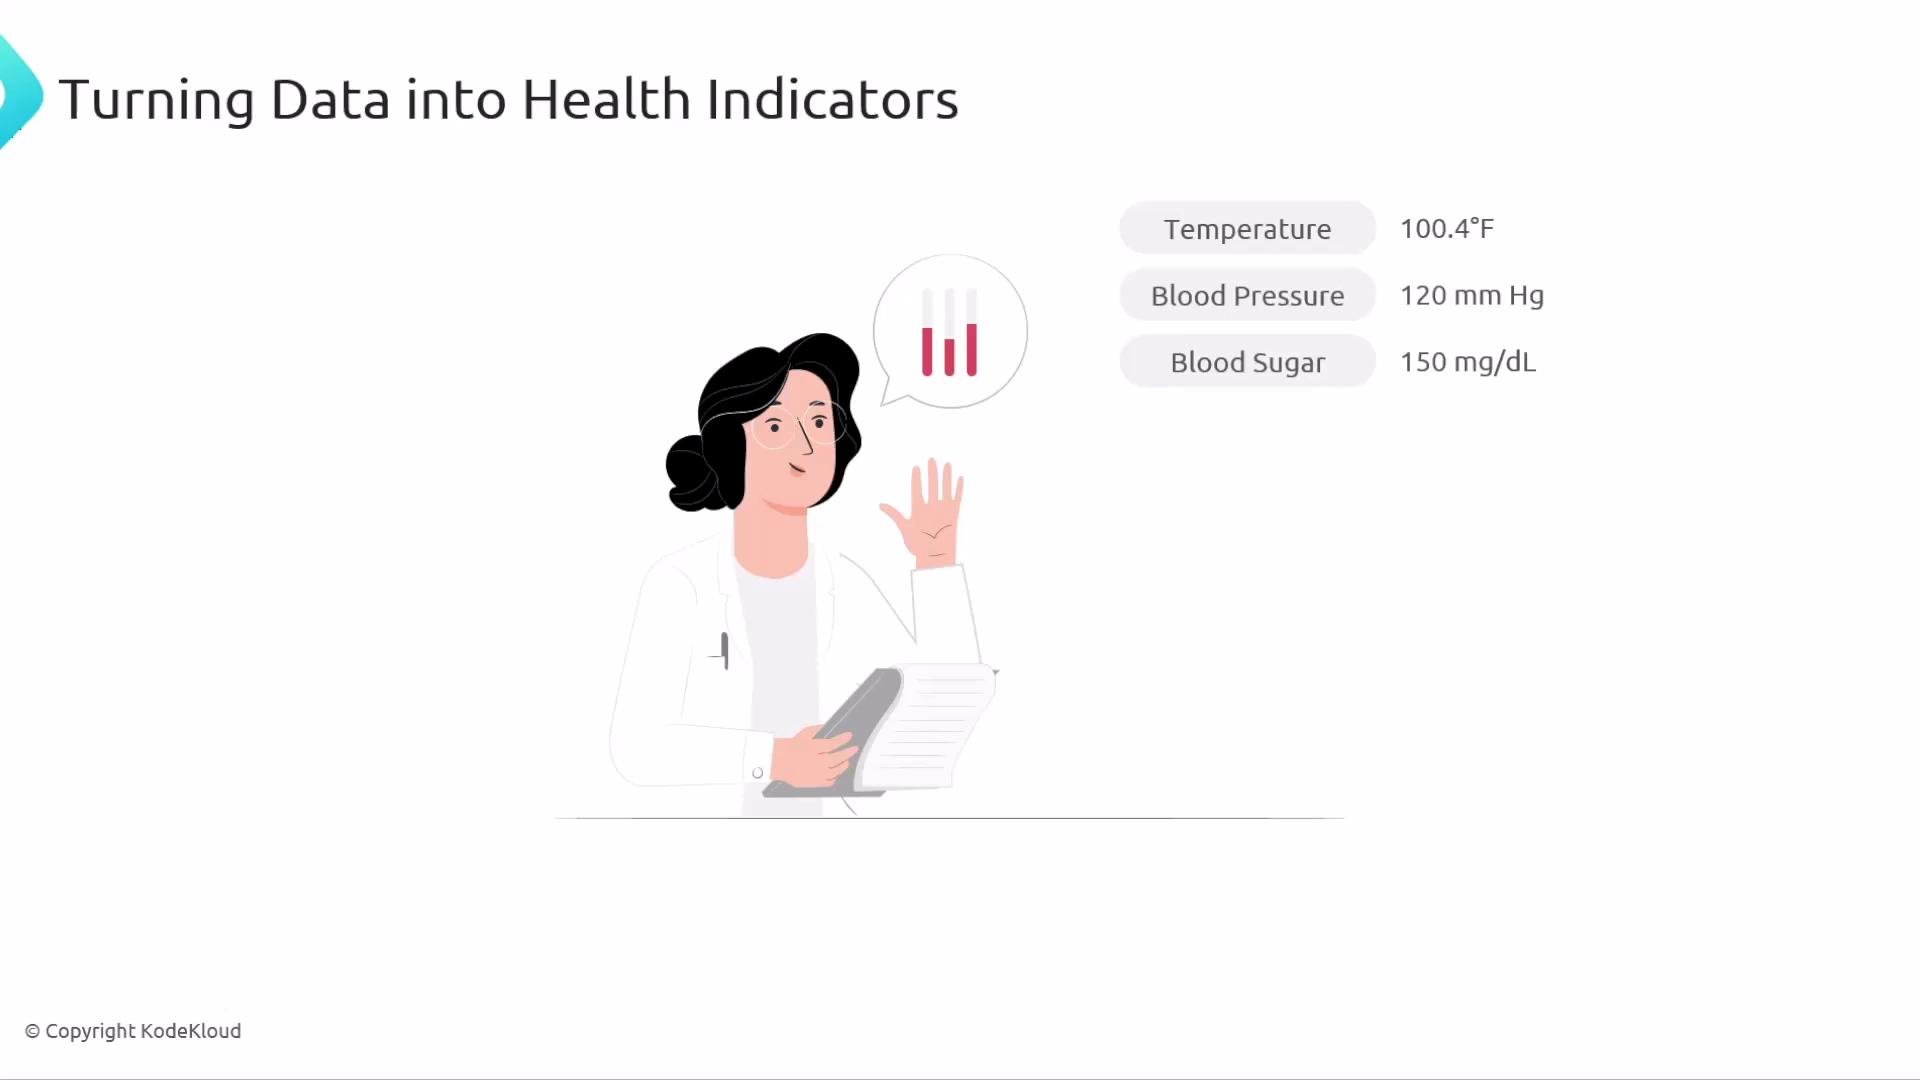
Observability through a medical diagnosis analogy
A medical diagnosis is a useful analogy:- Symptoms (fever, cough, fatigue) tell you something is wrong.
- Doctors gather measurements and tests to narrow down the cause.
- Medical history and timelines help build the full picture.
- Symptoms → metrics (high-level numeric indicators)
- Timeline and notes → logs (detailed, timestamped events)
- End-to-end diagnostic tests → traces (request-level paths across services)

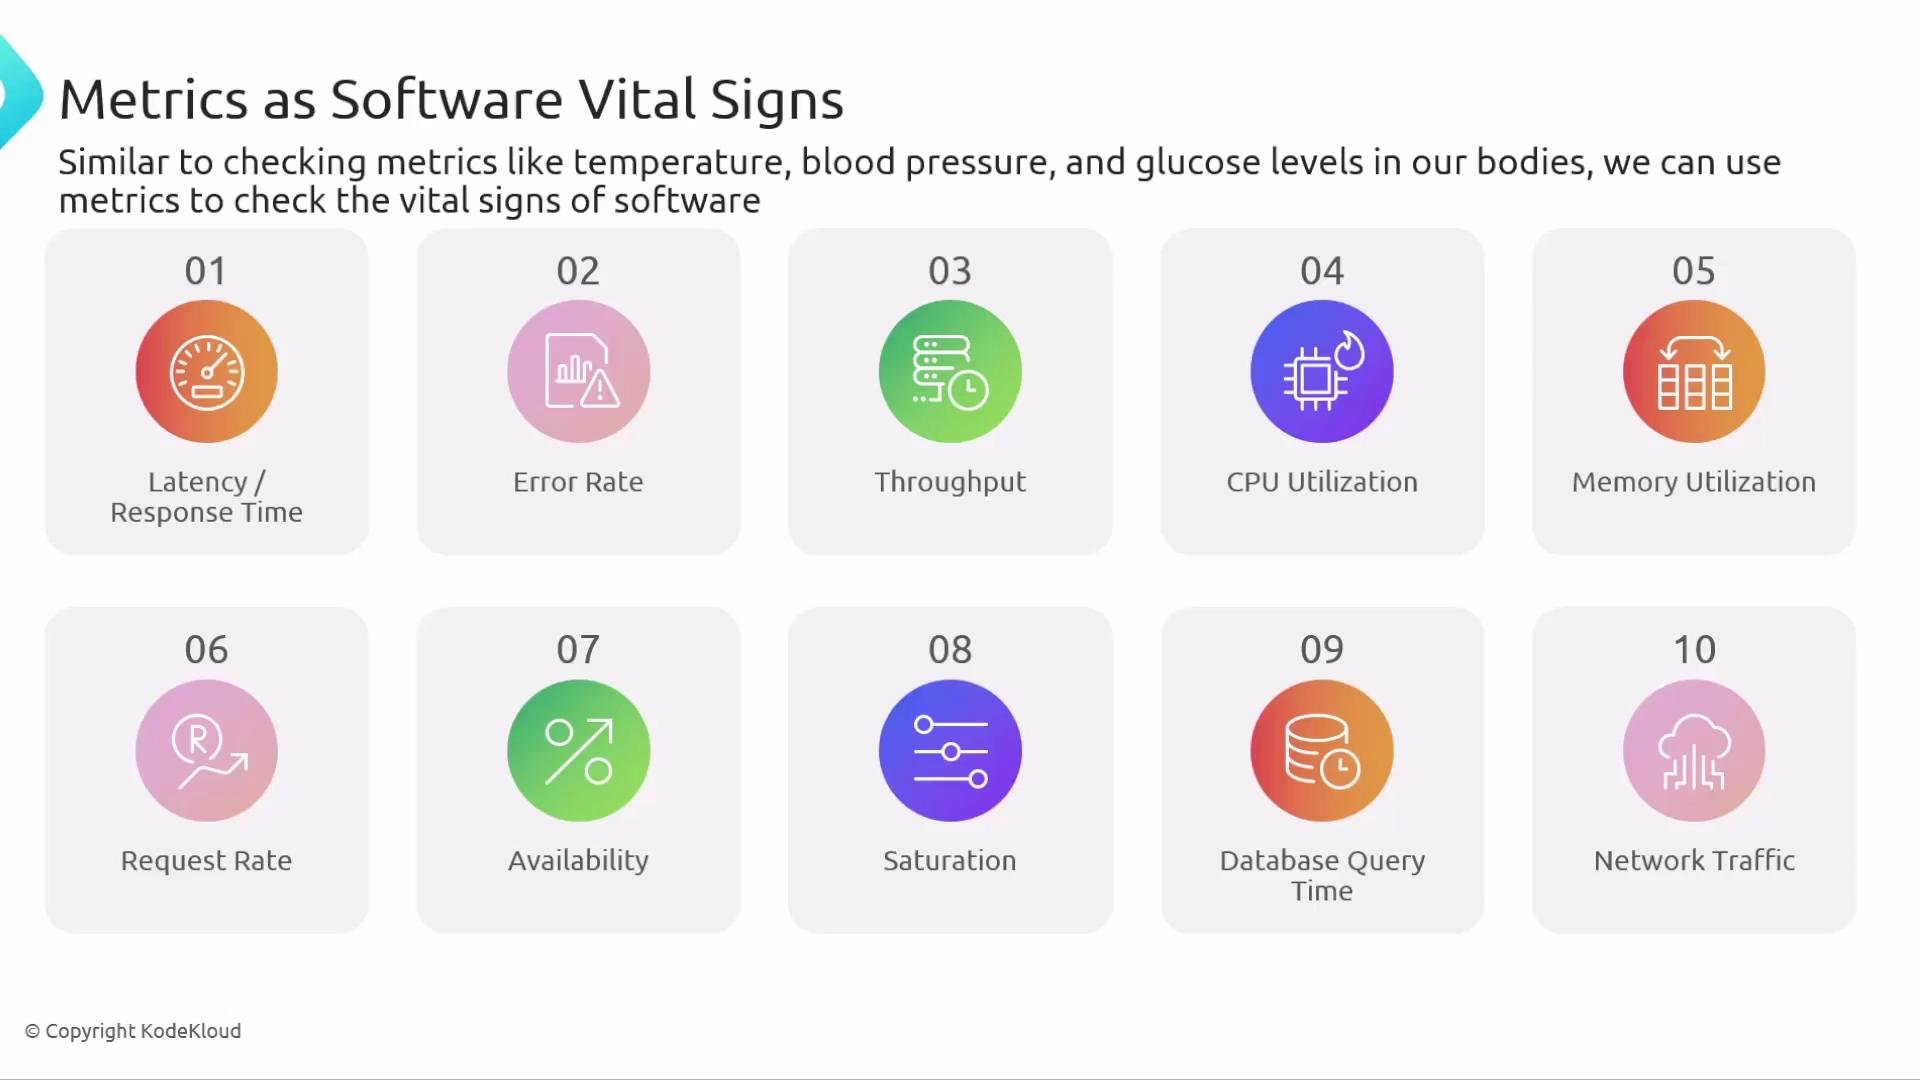
Common software “vital signs” (metrics)
- Latency / response time — indicates slowness.
- Error rate — shows increasing failures.
- Throughput — measures traffic volume.
- CPU / memory usage — show resource pressure.
- Saturation — tells if you’ve hit capacity limits.
- DB query durations and network traffic — additional key signals.
Logs — detailed, timestamped events
Logs are verbose records of individual events. They provide contextual details that metrics alone cannot. Think of a patient’s symptom timeline or diary. Example patient event timeline:Traces — end-to-end request insight
Distributed traces follow a single request as it travels through services. They show timing, dependencies, and where time is spent — ideal for locating latency hotspots or dependency failures. Think of a medical imaging test that reveals the precise area of impaired blood flow. In a web application example, a checkout request may touch multiple services (frontend → checkout → payment → catalog → shipping). A trace stitches spans from each service into a single end-to-end view, revealing total time and each service’s contribution. A trace (waterfall) view often highlights the slowest span and surfaces exceptions and errors encountered during the request.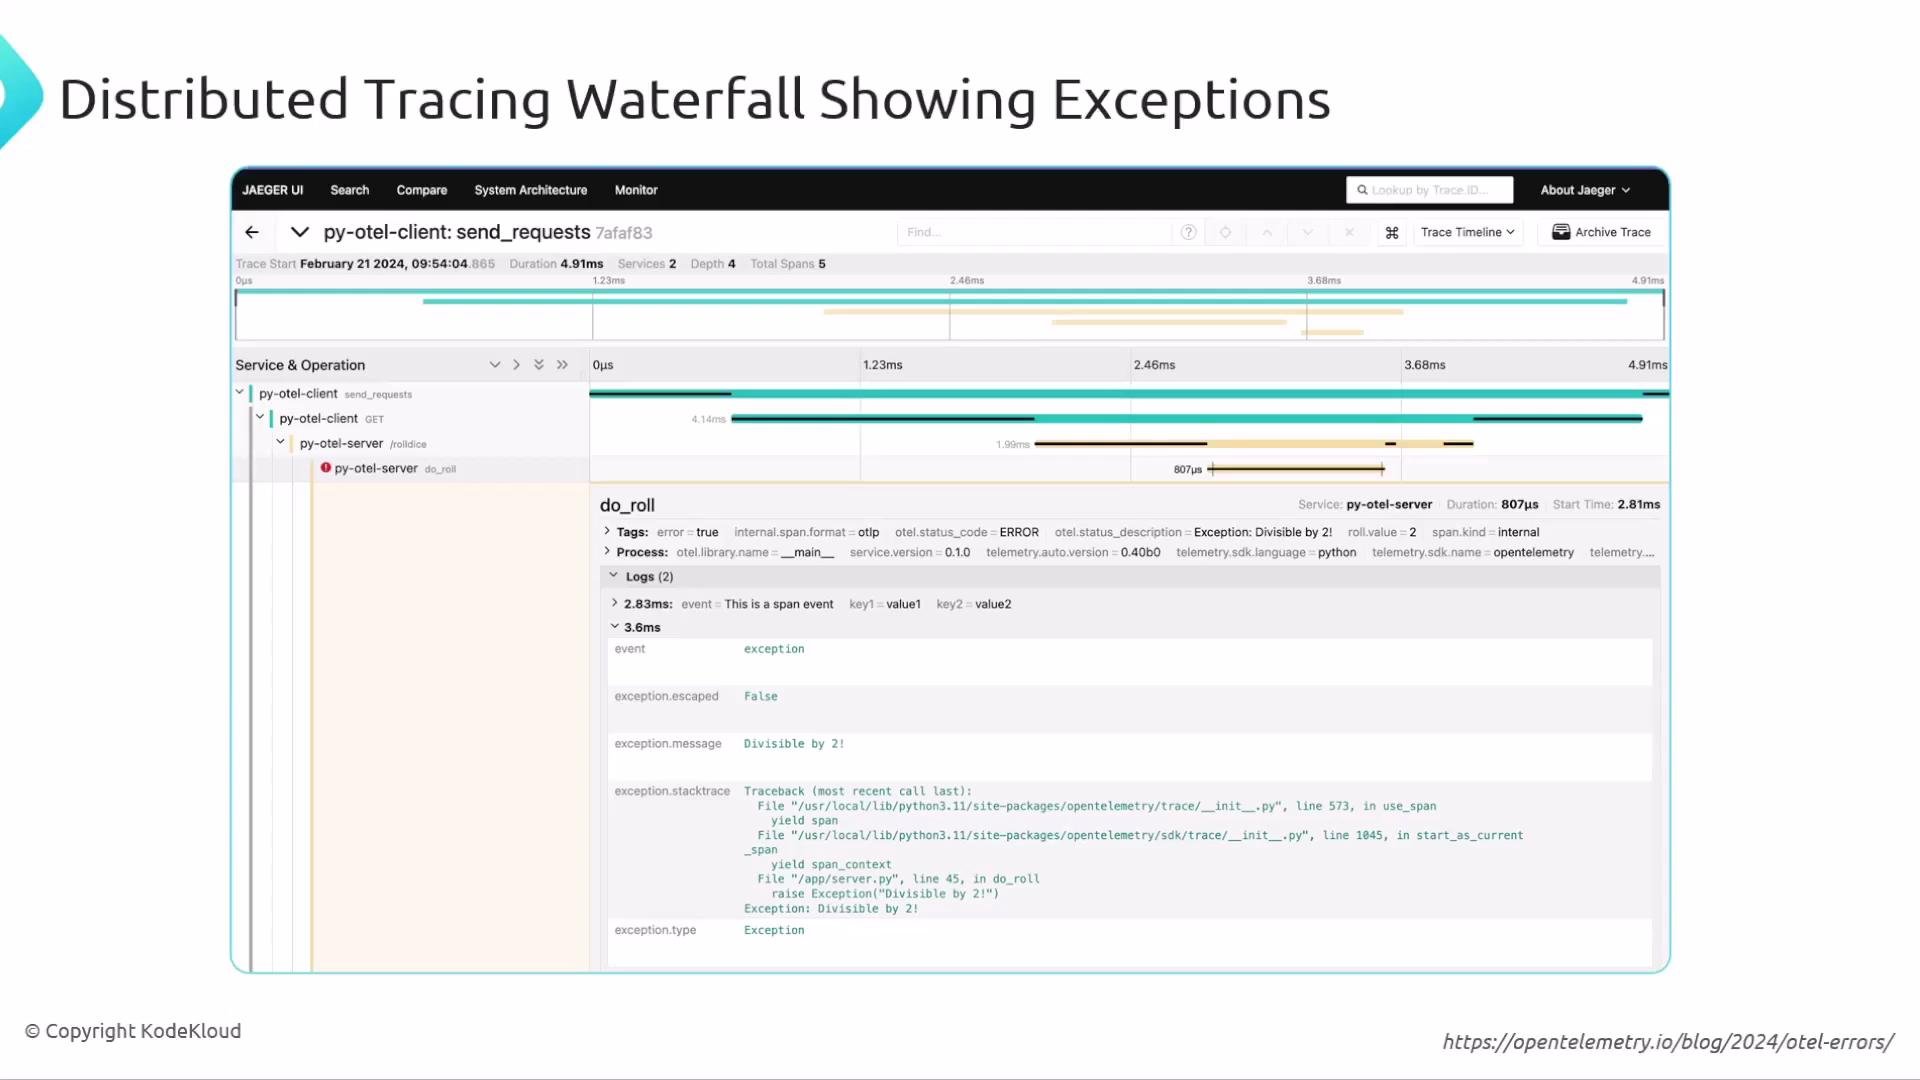
Metrics vs Logs vs Traces — quick comparison
These three are often called the “three pillars” of observability. That mental model helps structure thinking, but modern observability goes beyond just three signals.
Additional telemetry and contextual signals
- Baggage: key/value context that travels with a trace (e.g., user ID, region) to help correlate behavior across services.
- Profiling: runtime samples of CPU, memory, and heap allocations to find inefficient code paths.
- Events and custom context: business events or debug snapshots that add diagnostic clarity.
The “three pillars” is a useful starting point, but real-world observability improves when metrics, logs, and traces are correlated with additional telemetry (baggage, profiling, events). Treat metrics, logs, and traces as core signals that are amplified by richer context.
Correlation in practice
When metrics, logs, and traces are available and linked, you can answer the key operational question: why is this happening? Example: combining container logs with a shell output confirms a pod’s startup and worker processes: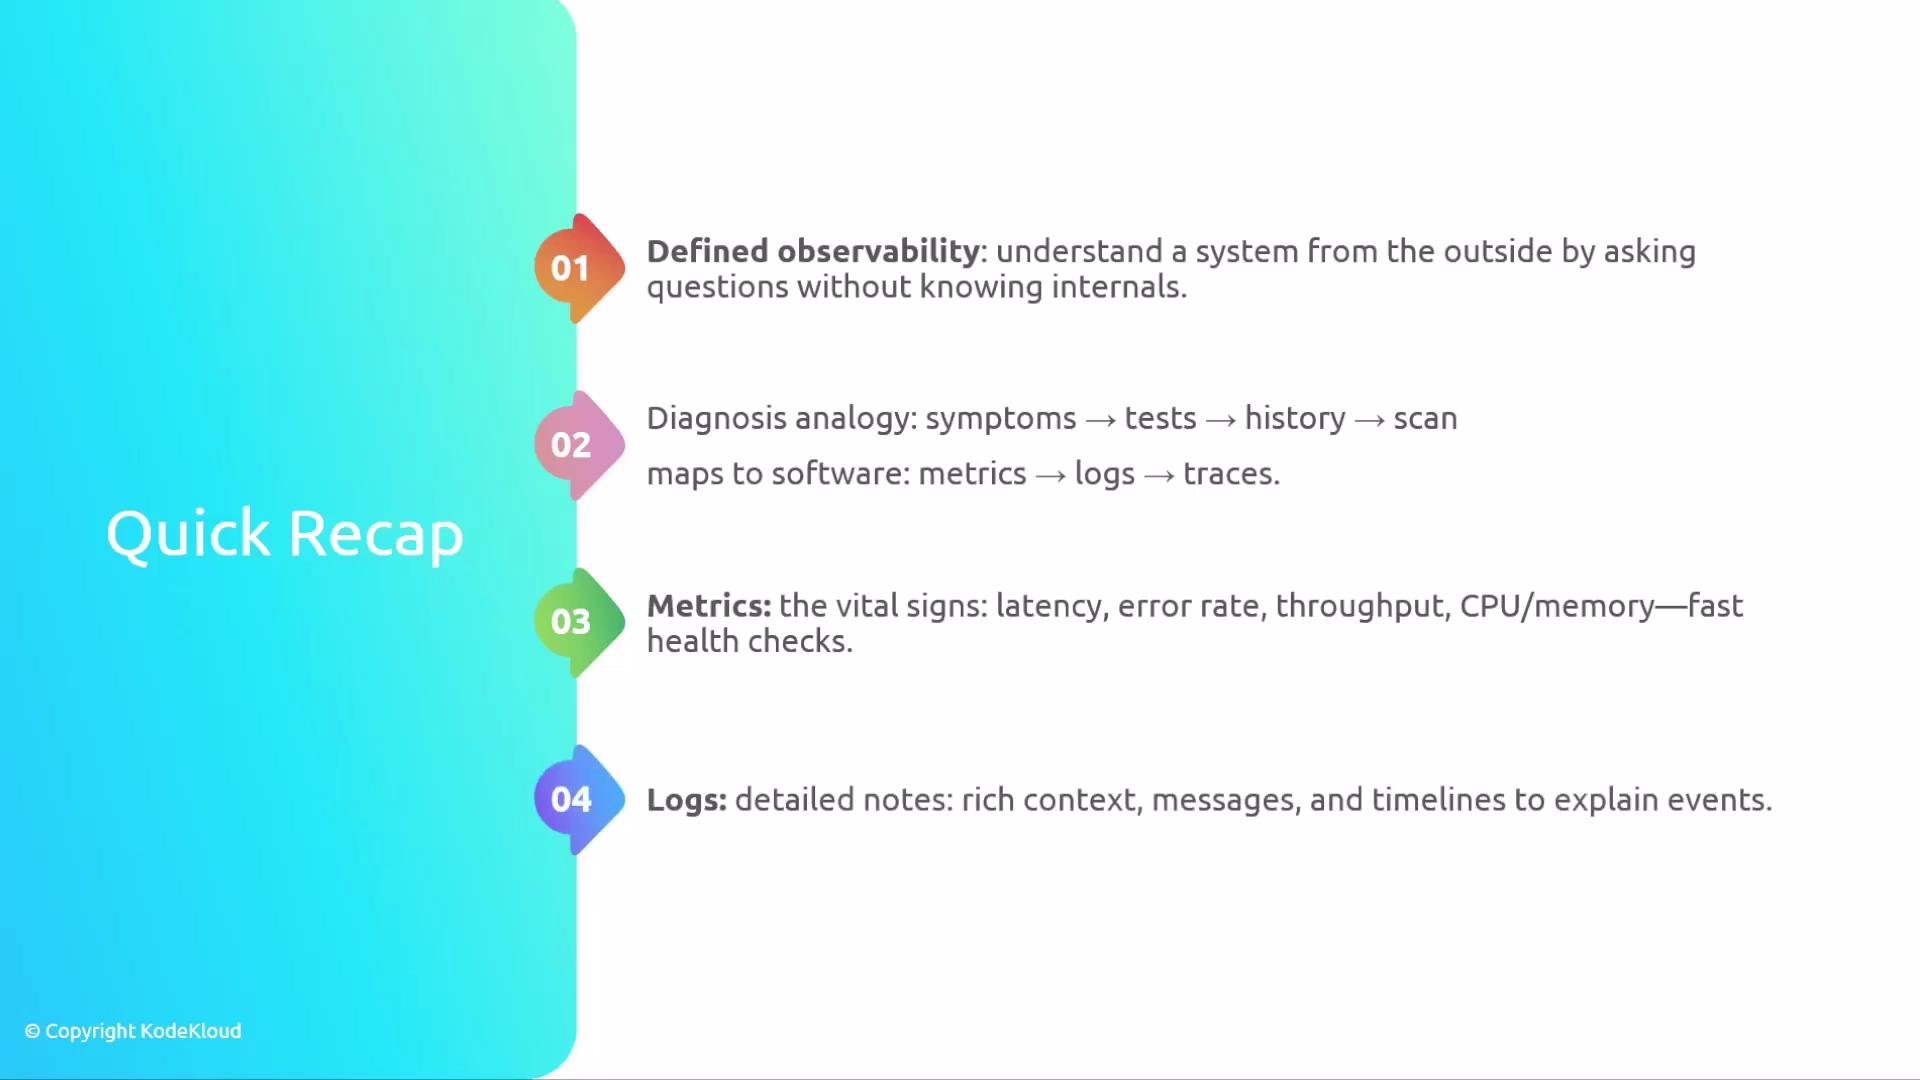
Quick recap
- Observability lets you understand a system from the outside without inspecting internals.
- Diagnosis analogy: symptoms → tests → history → scans maps to metrics → logs → traces.
- Metrics = vital signs; Logs = timelines and context; Traces = request paths and timing.
- Correlate signals (plus baggage and profiling when available) to reveal root causes and previously unknown issues.