Guide comparing auto, library, and manual OpenTelemetry instrumentation approaches and recommending a layered strategy to balance rapid visibility with deep business-context telemetry
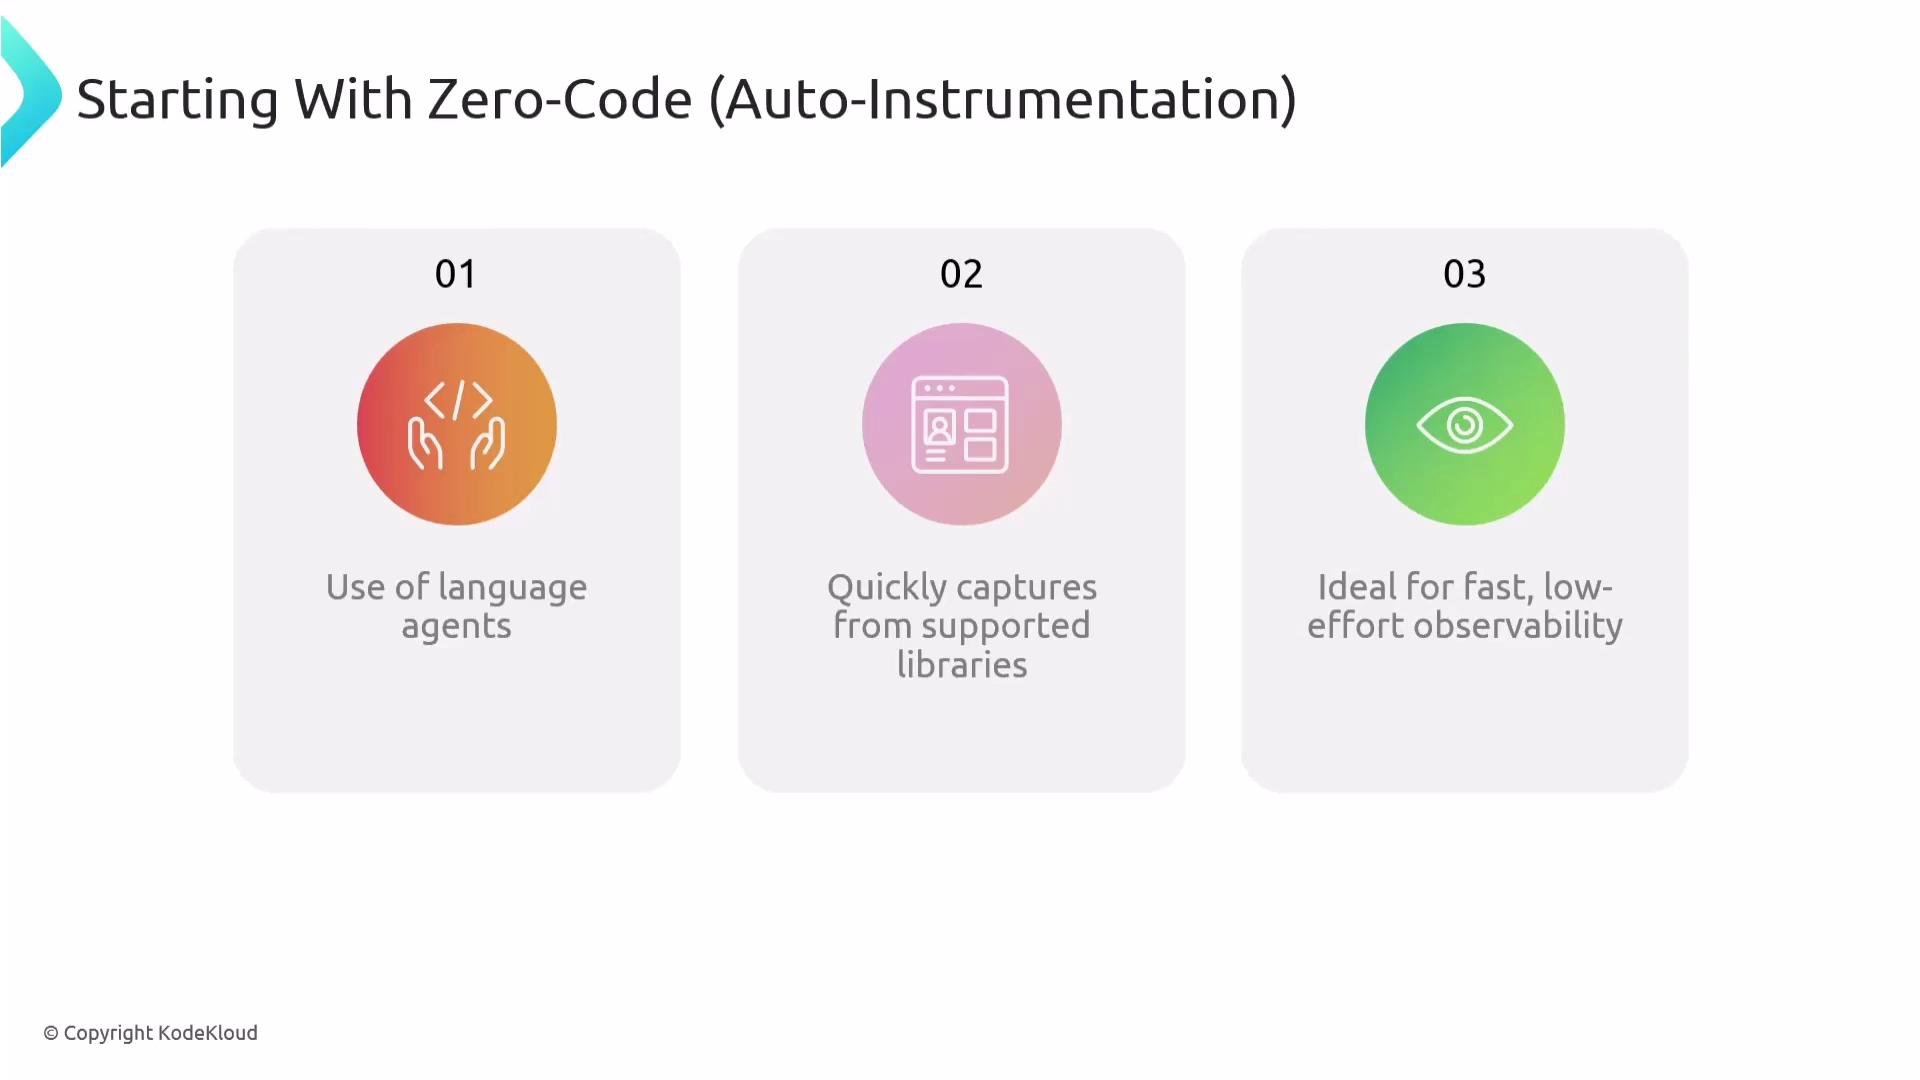
There are multiple ways to instrument an application with OpenTelemetry. Choosing the right approach depends on your goals (speed to visibility, depth of business context, and engineering effort). This guide clarifies the common approaches, their trade-offs, and a recommended layered strategy for production-grade observability.Start with zero-code (auto-)instrumentation. Language agents—such as the Python, Java, and .NET agents—can automatically capture spans from supported libraries without changing your source. This is the fastest, lowest-effort path to baseline telemetry because you typically don’t need to modify application code.
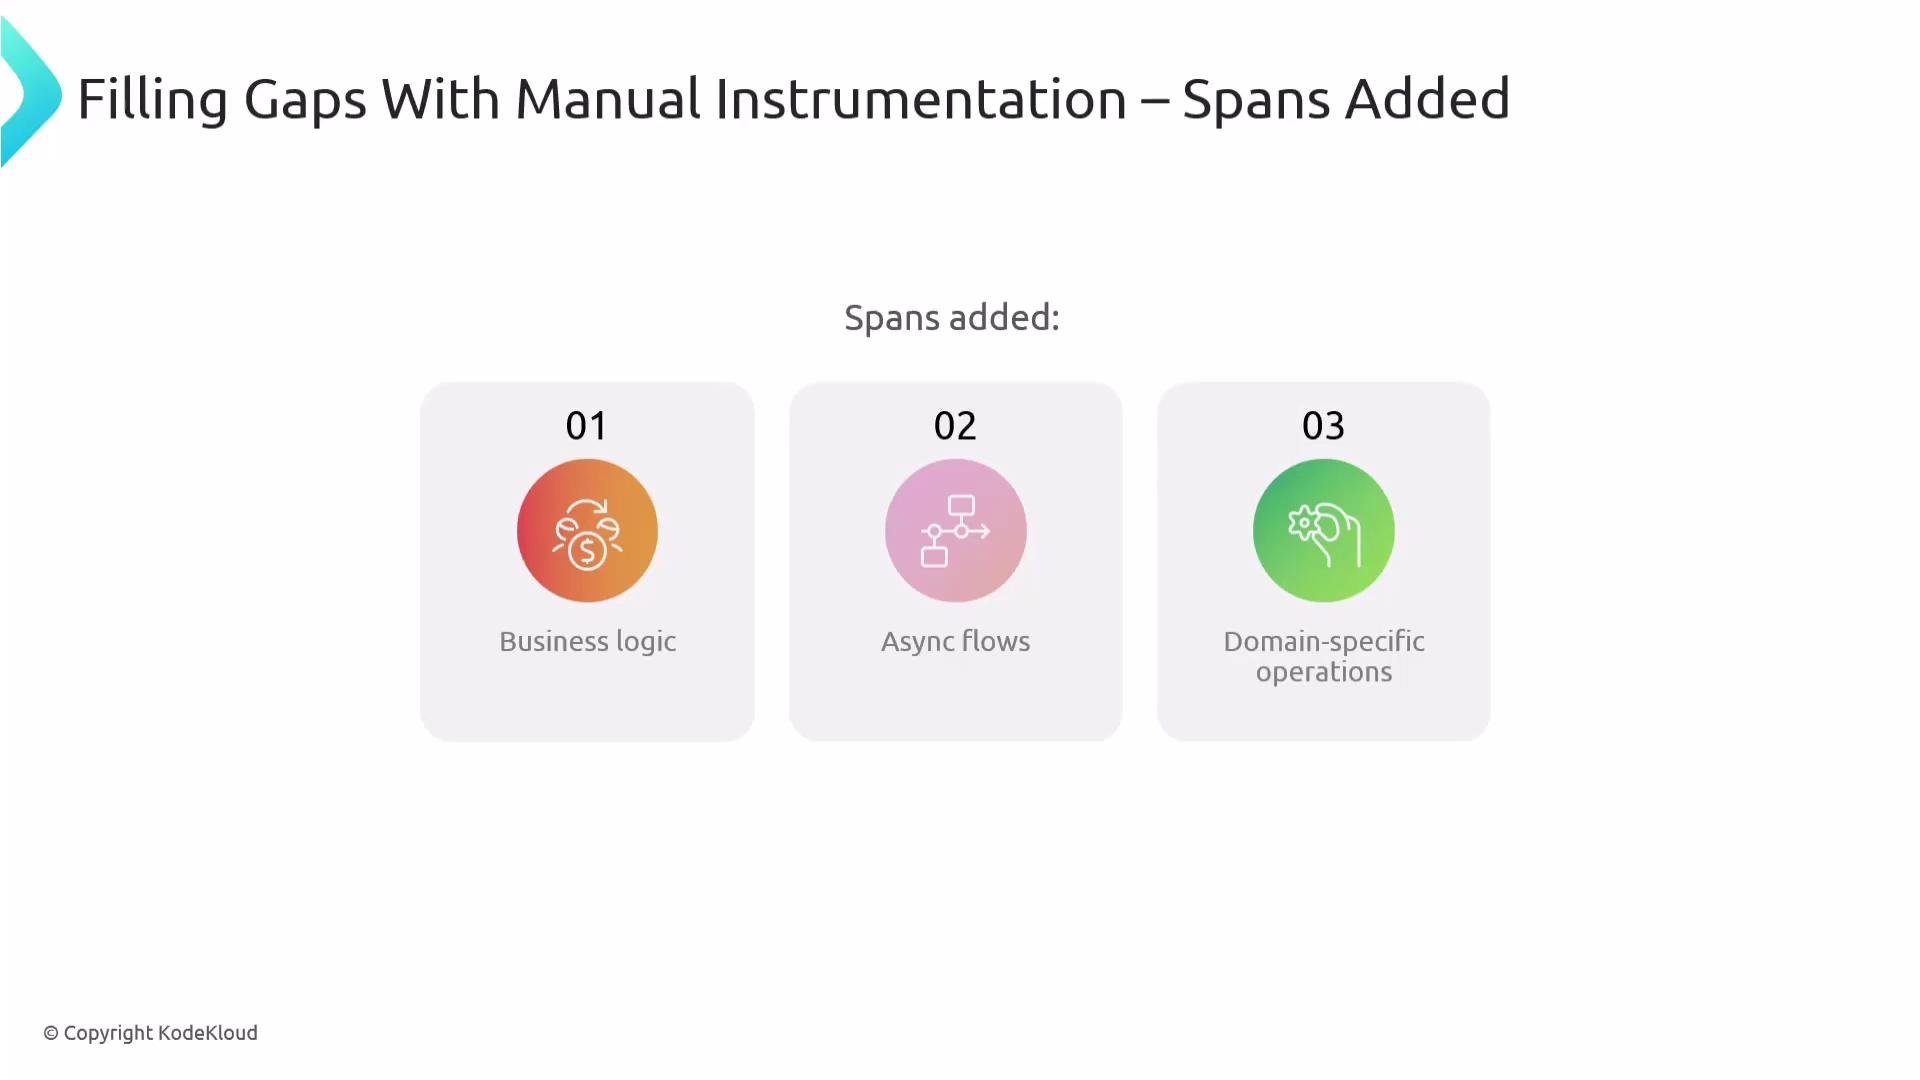
Auto-instrumentation commonly captures HTTP requests, database calls, messaging interactions, and well-known web frameworks (for example, Flask and Spring). It accelerates initial observability and helps you detect obvious performance issues and errors.Where auto-instrumentation leaves gaps—such as business logic, complex asynchronous flows, or domain-specific operations—you should supplement it with manual, code-based instrumentation.
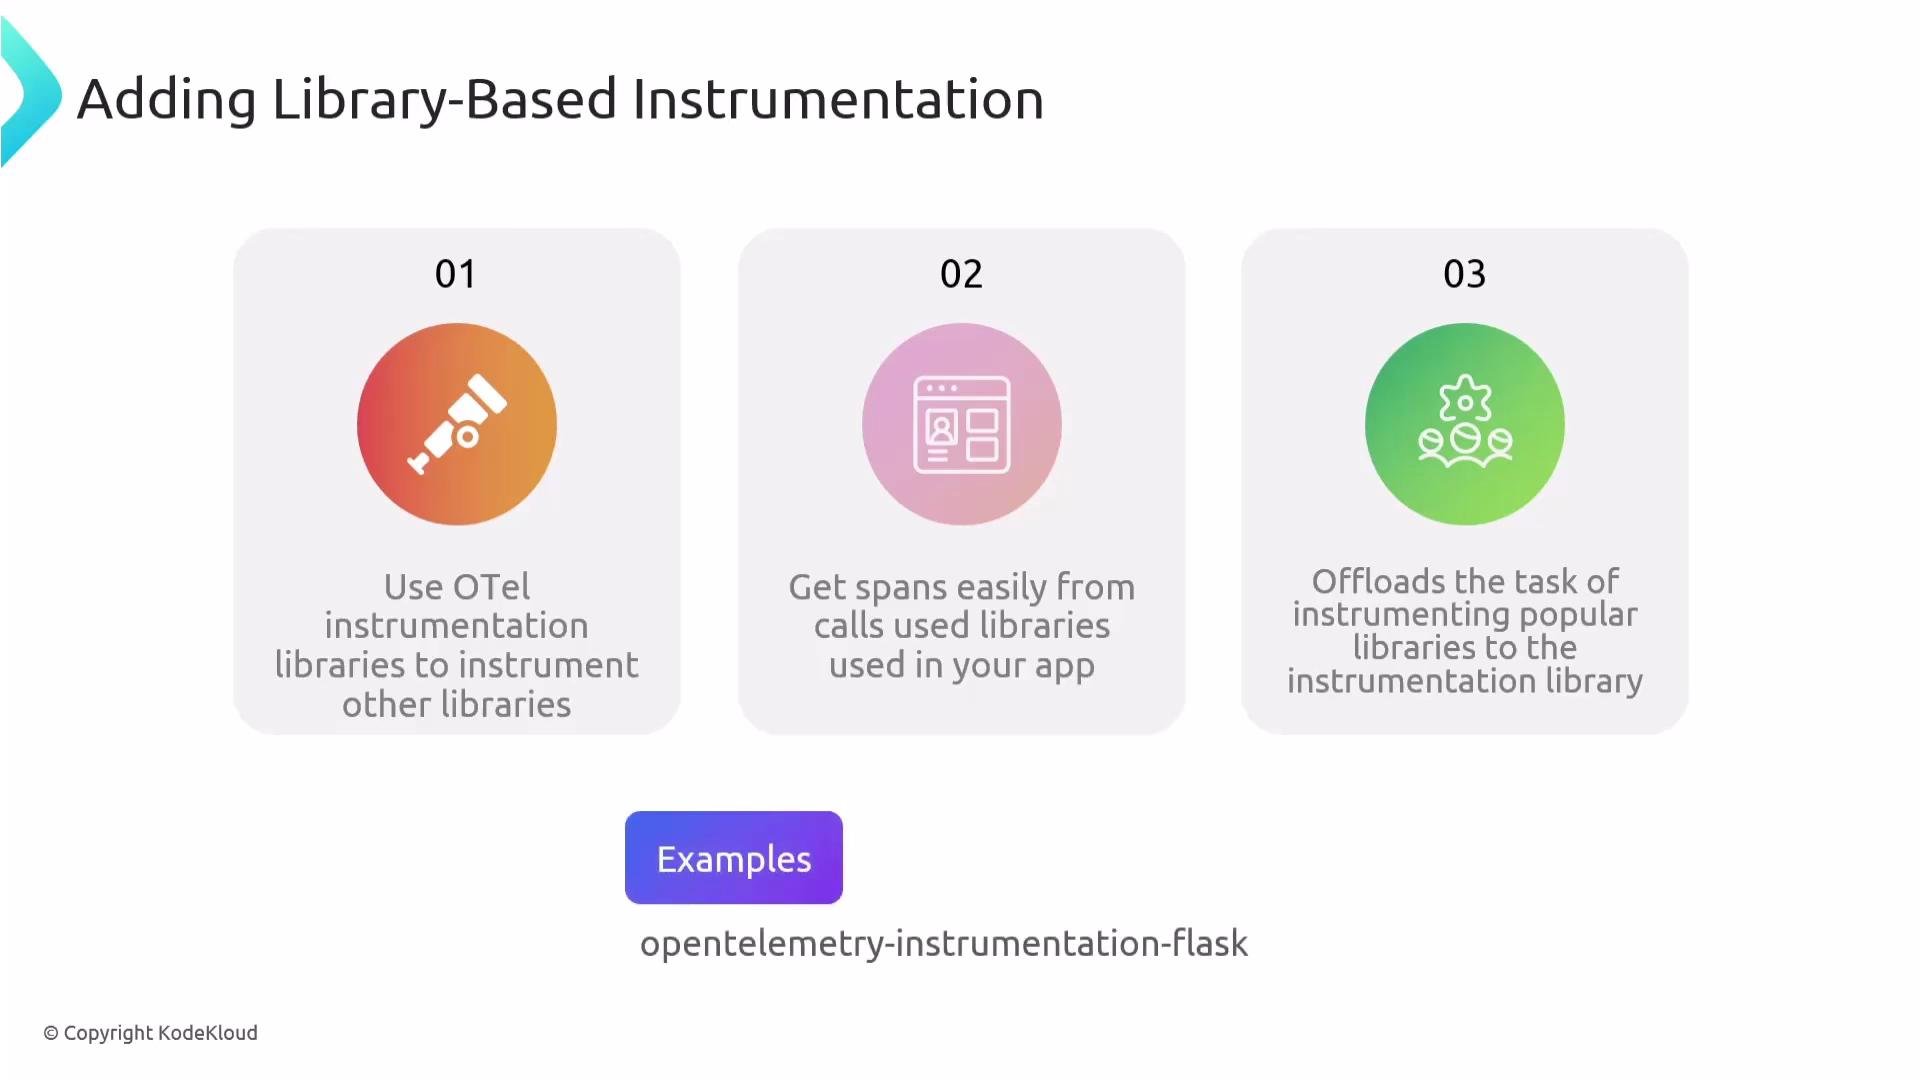
Manual instrumentation gives you precise control: create spans for business actions (for example, validate insurance claim, calculate premium), record meaningful attributes, log custom events, and build explicit span hierarchies that reflect your domain’s control flow. This requires developer effort and access to the codebase, but it produces the richest, most actionable telemetry.Another middle-ground option is library-based instrumentation. These are OpenTelemetry instrumentation packages that instrument specific third-party libraries for you (for example, opentelemetry-instrumentation-flask). They provide coverage for library-level interactions without requiring you to manually add spans around those calls.
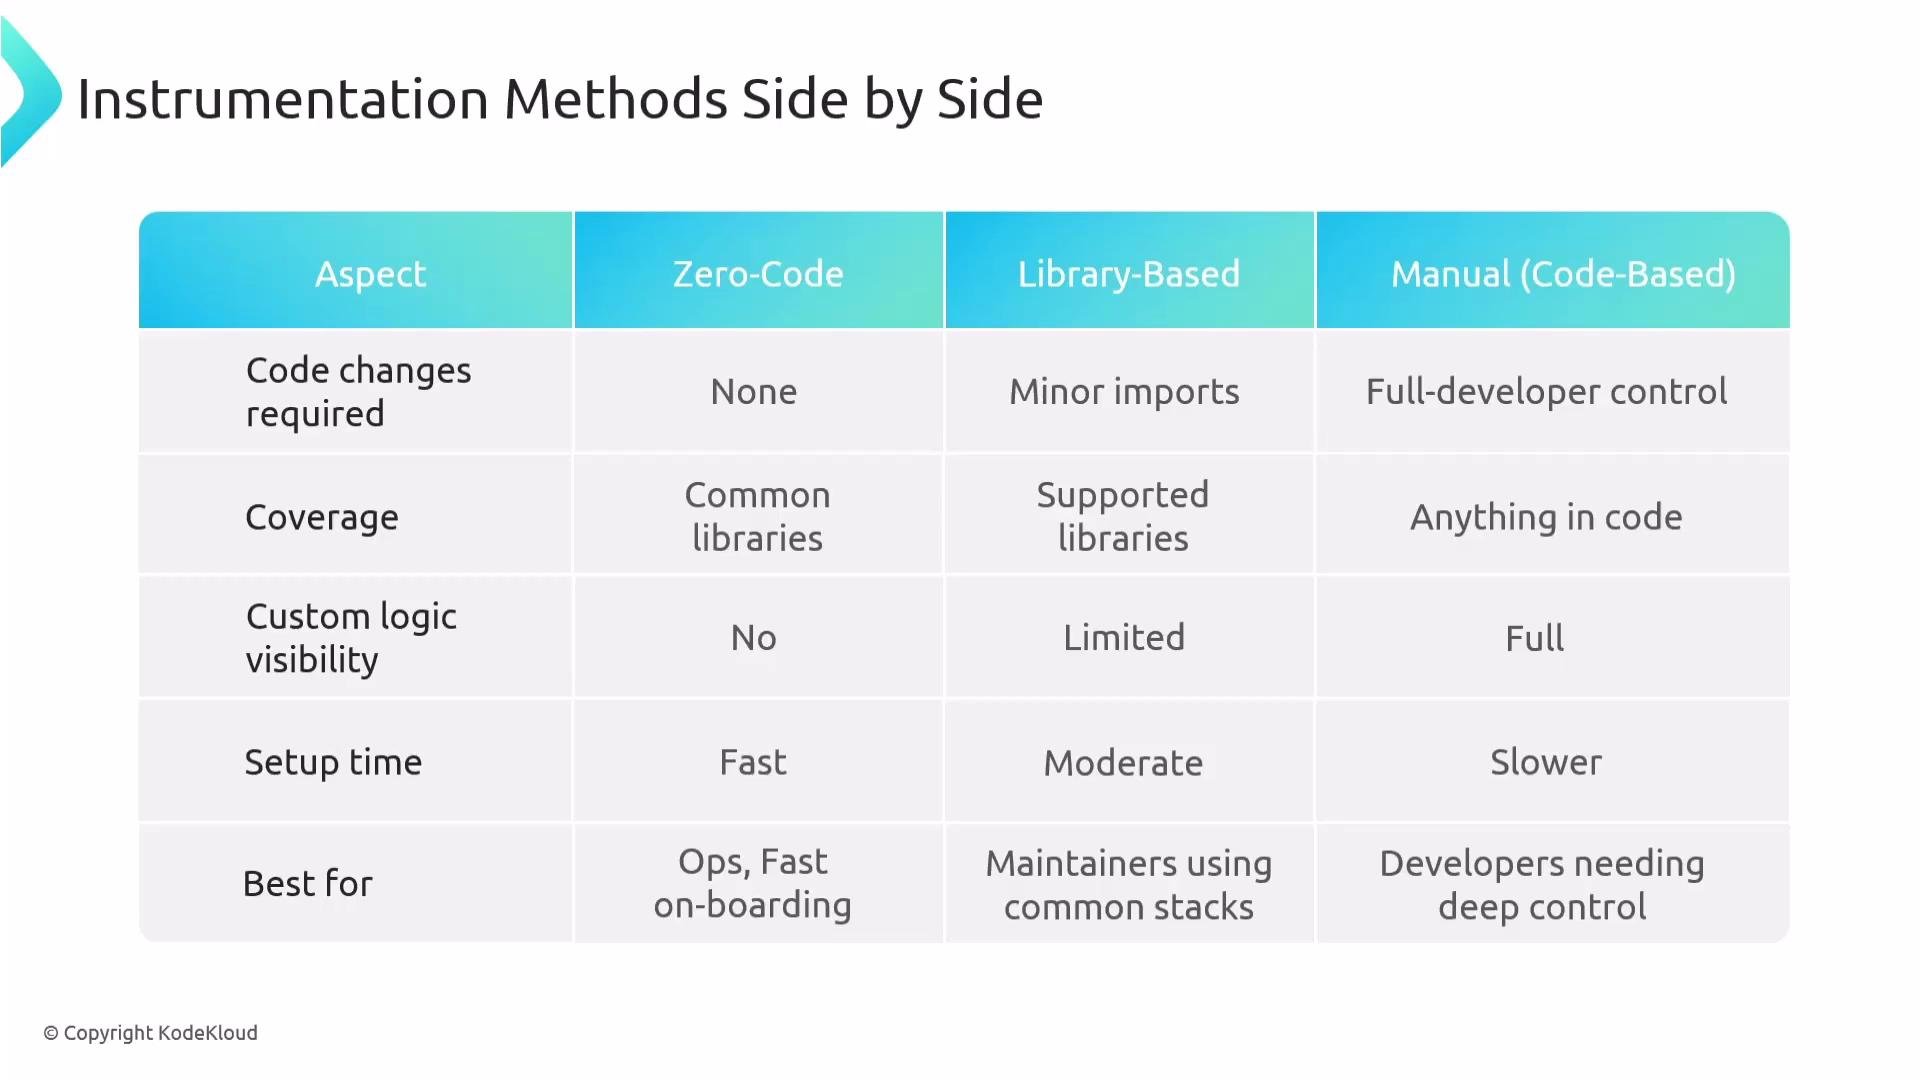
Below is a concise comparison of the three approaches to help with decision-making.
Method
Code Changes Required
Typical Coverage
Visibility into Business Logic
Setup Time
Best Use Cases
Zero-code (Auto)
None (agent-based)
Broad (HTTP, DB, messaging, common frameworks)
Low
Short
Rapid baseline telemetry, initial troubleshooting
Library-based
Minimal (add instrumentation packages)
Focused on popular third-party libs
Medium
Short–Medium
When a dependency needs better visibility without full manual spans
Manual (Code-based)
Yes (developer effort)
Targeted, depends on implementation
High
Medium–Long
Business-critical flows, async control paths, domain-specific operations
Manual instrumentation requires engineering time and discipline (naming conventions, attribute standards, sampling considerations), but it provides essential context for domain-specific troubleshooting that auto-instrumentation cannot infer. Library-based instrumentation is a useful compromise: it offloads work for well-known libraries while still allowing targeted manual spans where needed.In practice, the most effective strategy is layered:
Enable zero-code auto-instrumentation first to get immediate, wide coverage and rapid feedback.
Review traces to identify blind spots (missing business spans, confusing span hierarchies, or async gaps).
Add targeted manual spans for business-critical logic and complex flows.
Apply library-based instrumentation for third-party libraries that the agent doesn’t cover or where a library-specific implementation is preferable.
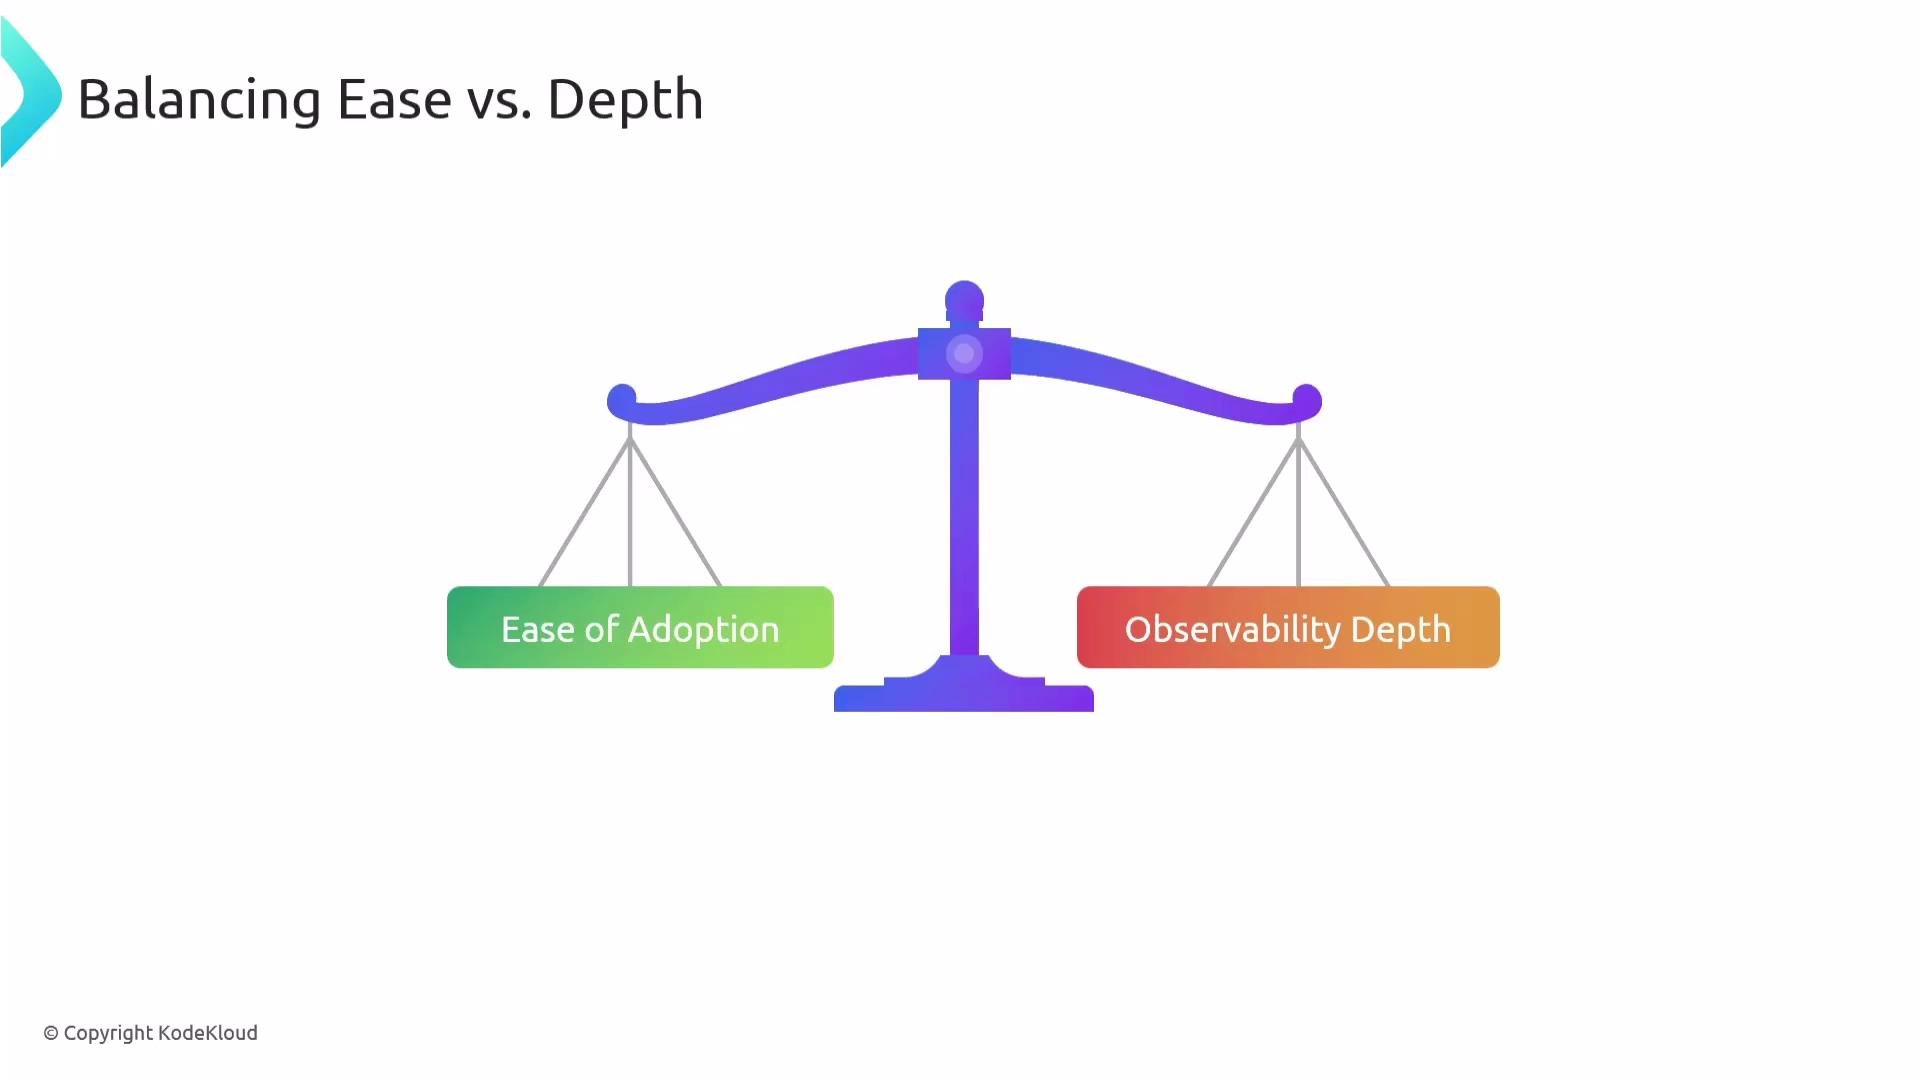
This layered approach balances ease of adoption against observability depth: auto-instrumentation gets you running quickly, library packages extend coverage for dependencies, and manual instrumentation provides the richest domain context.
A practical cadence: enable auto-instrumentation, inspect traces to find coverage gaps, then add targeted manual or library-based instrumentation where business value or debugging needs justify the effort.