

What is aggregation?
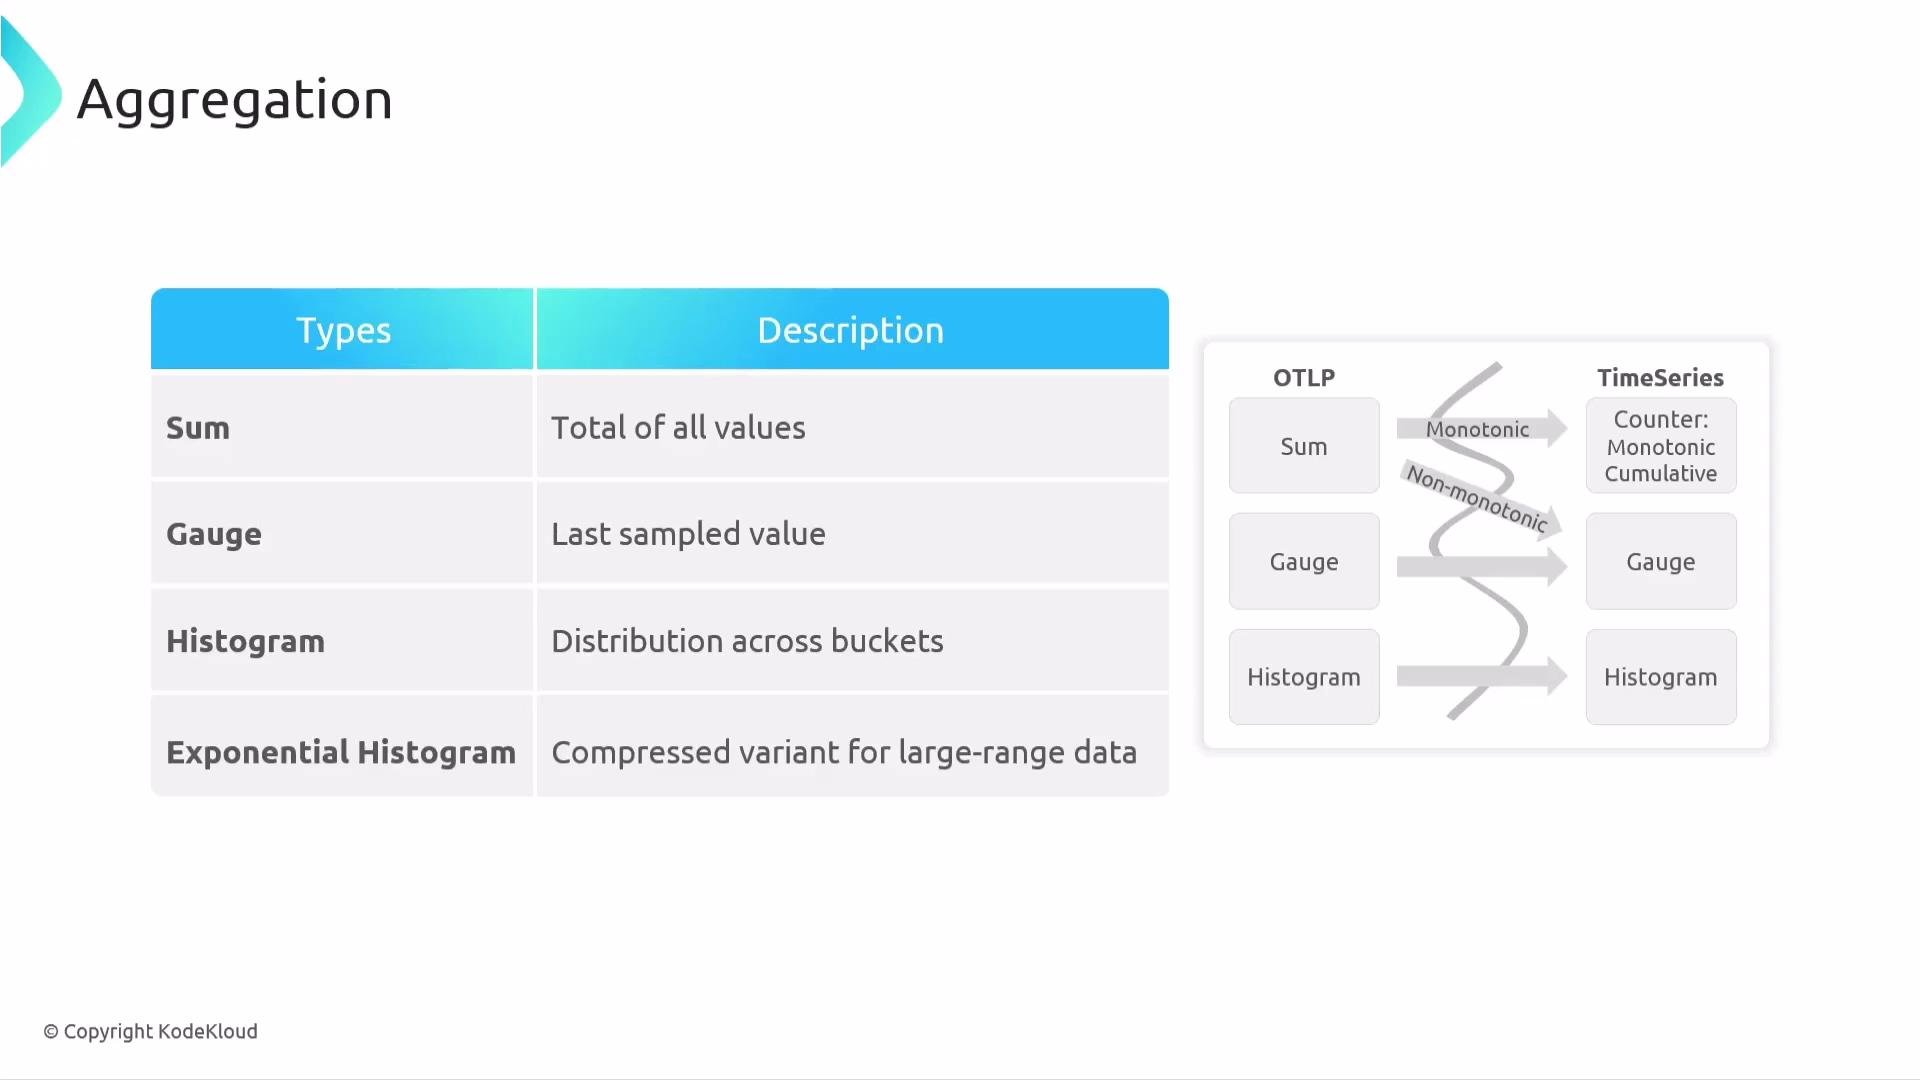
Aggregation takes individual measurements (for example, request latencies or current memory usage) and produces a summary such as a sum, a last-seen value, or a distribution. The aggregation type you choose determines what questions you can answer later from the stored metrics.Common aggregation types
Why use histograms?
Histograms capture a distribution instead of a single scalar. This is crucial when averages hide important behavior (for example, latency spikes). Histograms let you:- See the shape of latency or size distributions.
- Compute percentiles (P50, P95, P99) to characterize tail behavior.
- Detect and debug outliers and performance anomalies.
Example: histogram for HTTP request durations
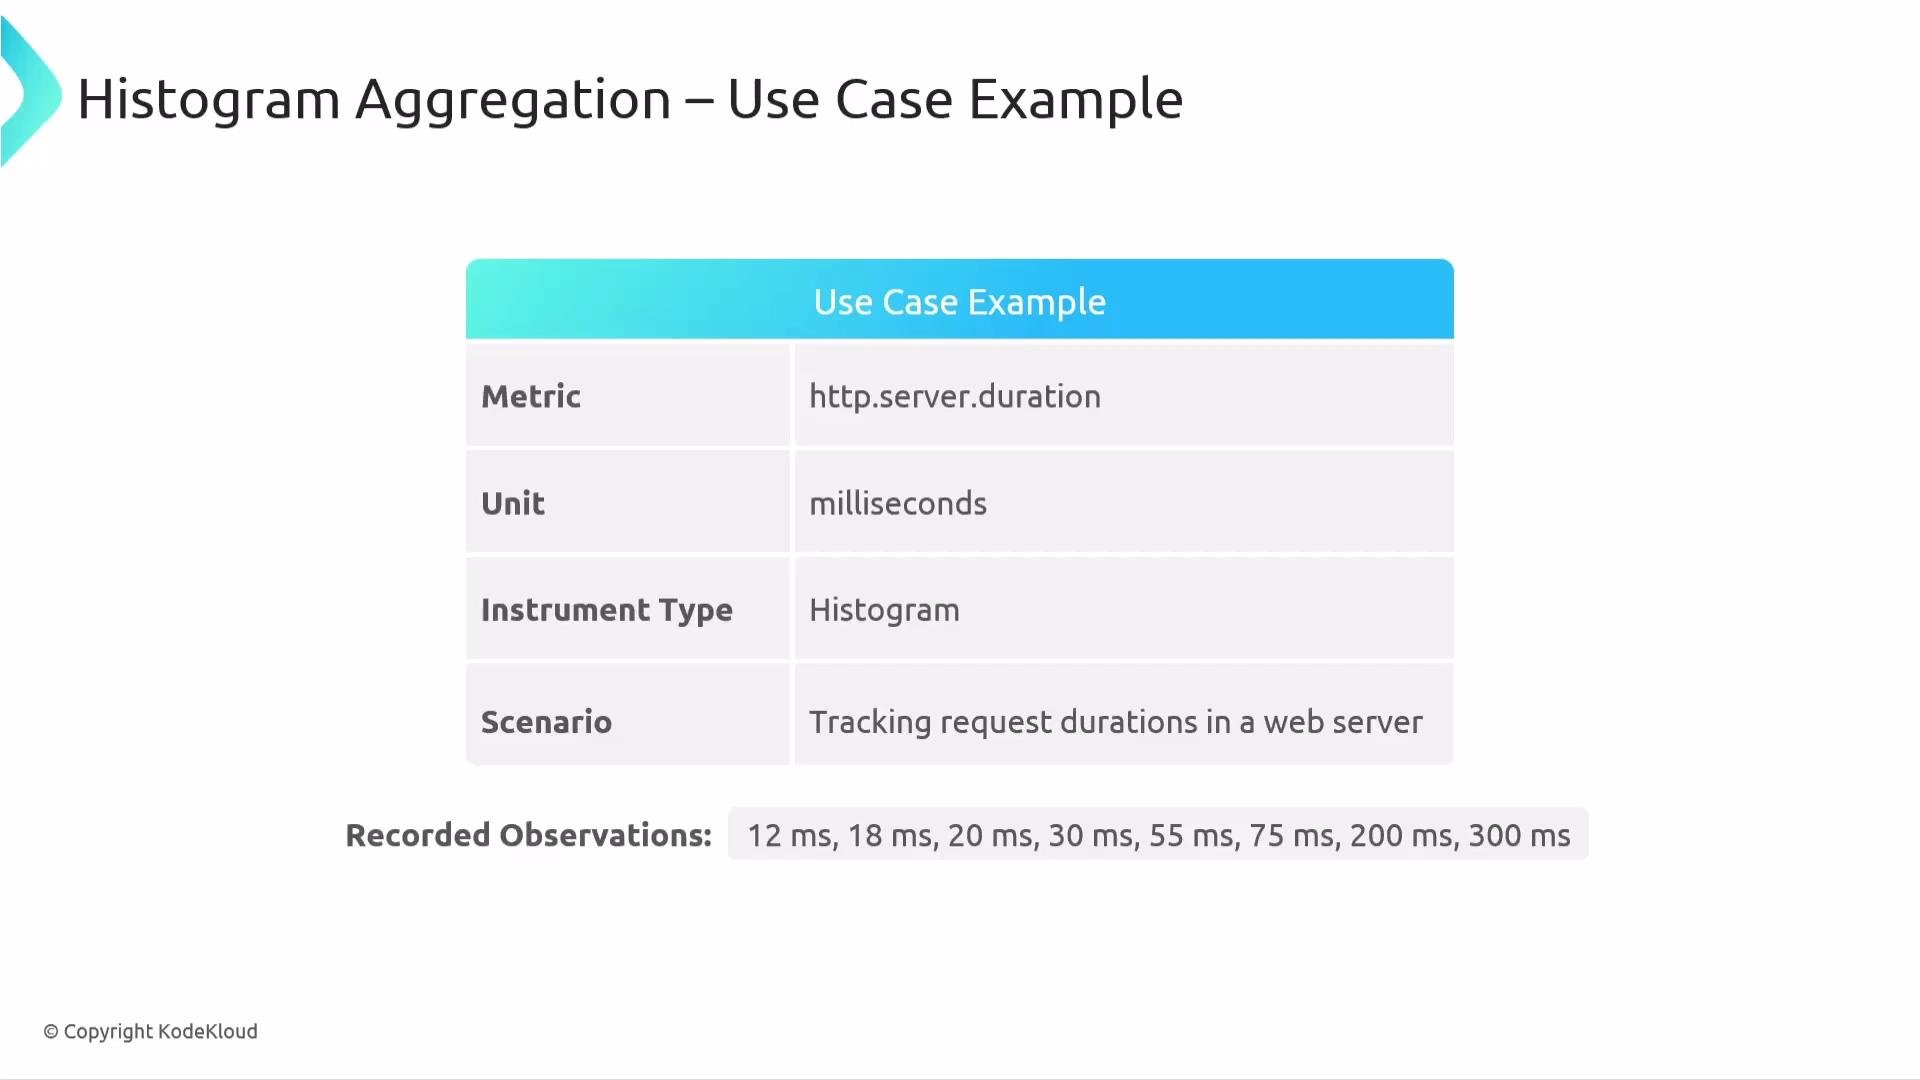
Consider a histogram metric that tracks server request durations:- Metric name:
http.server.duration - Unit: milliseconds
- Instrument type: histogram
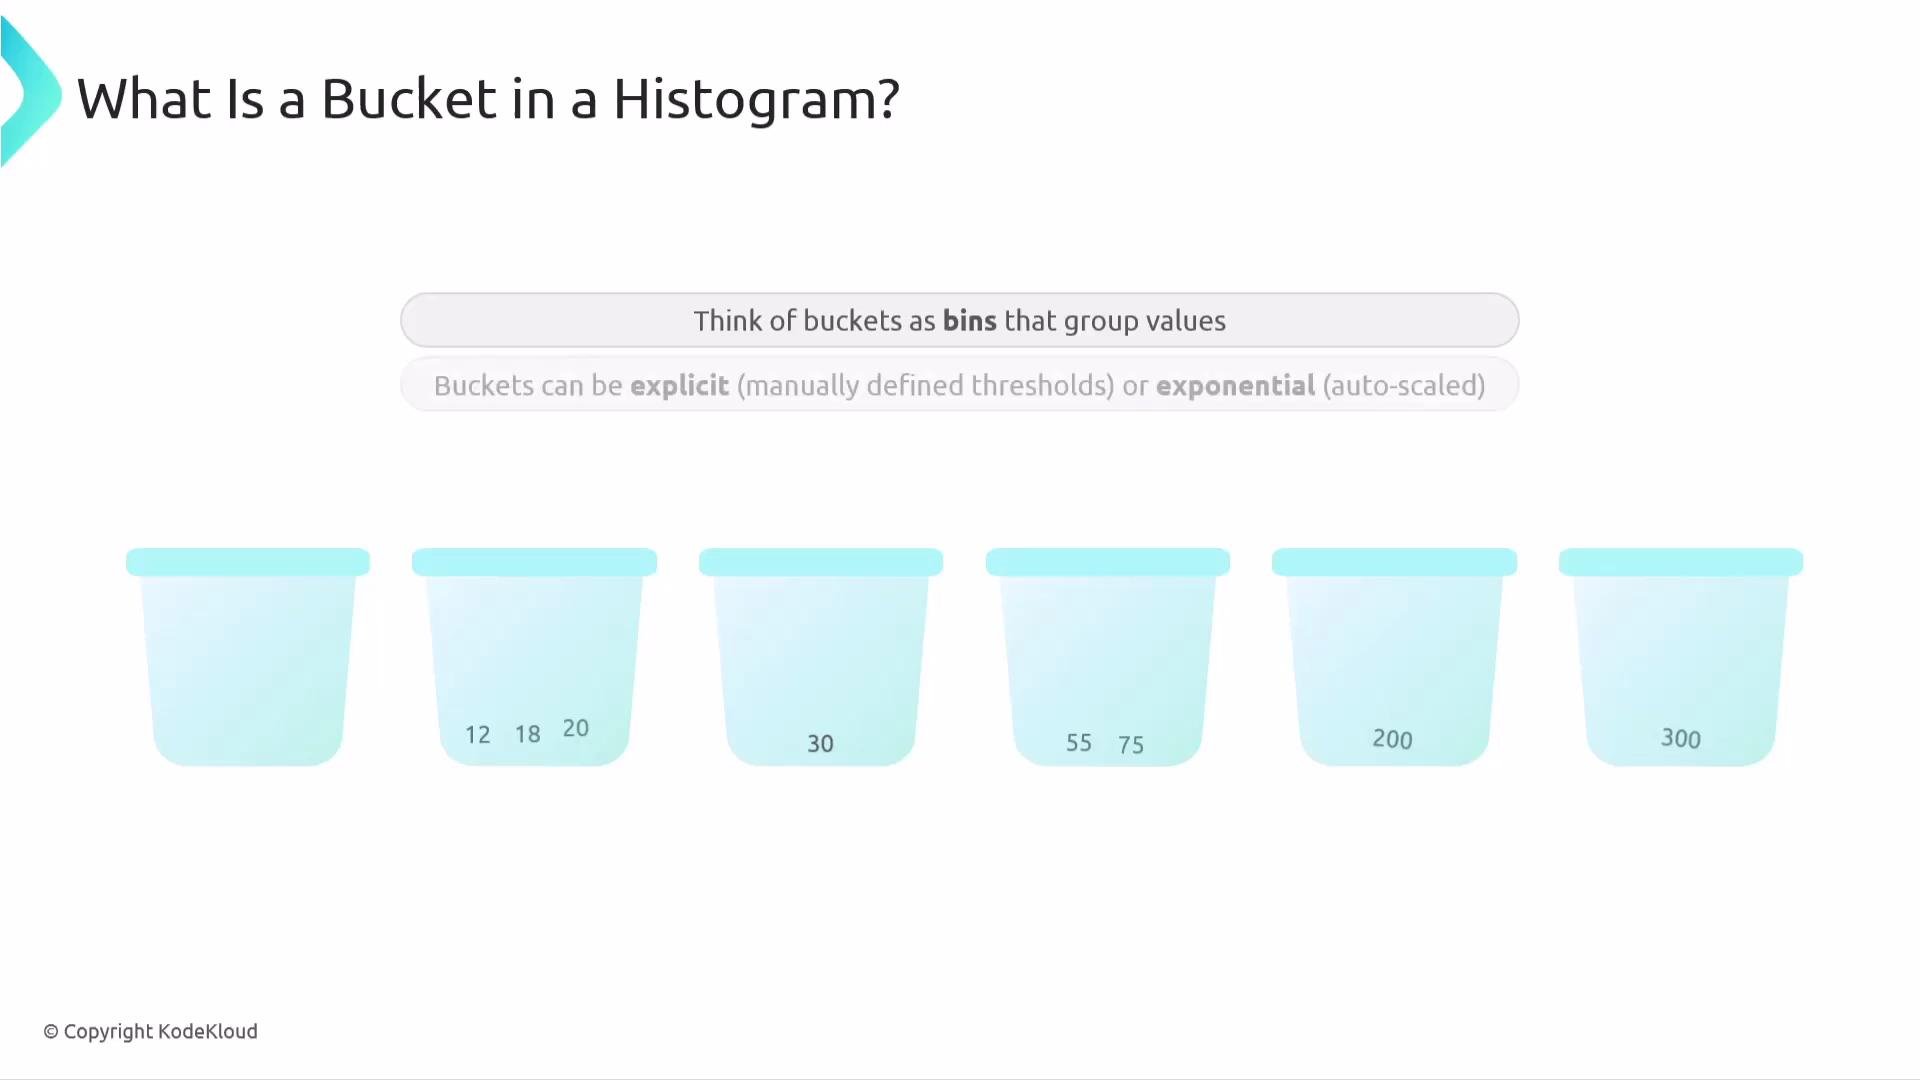
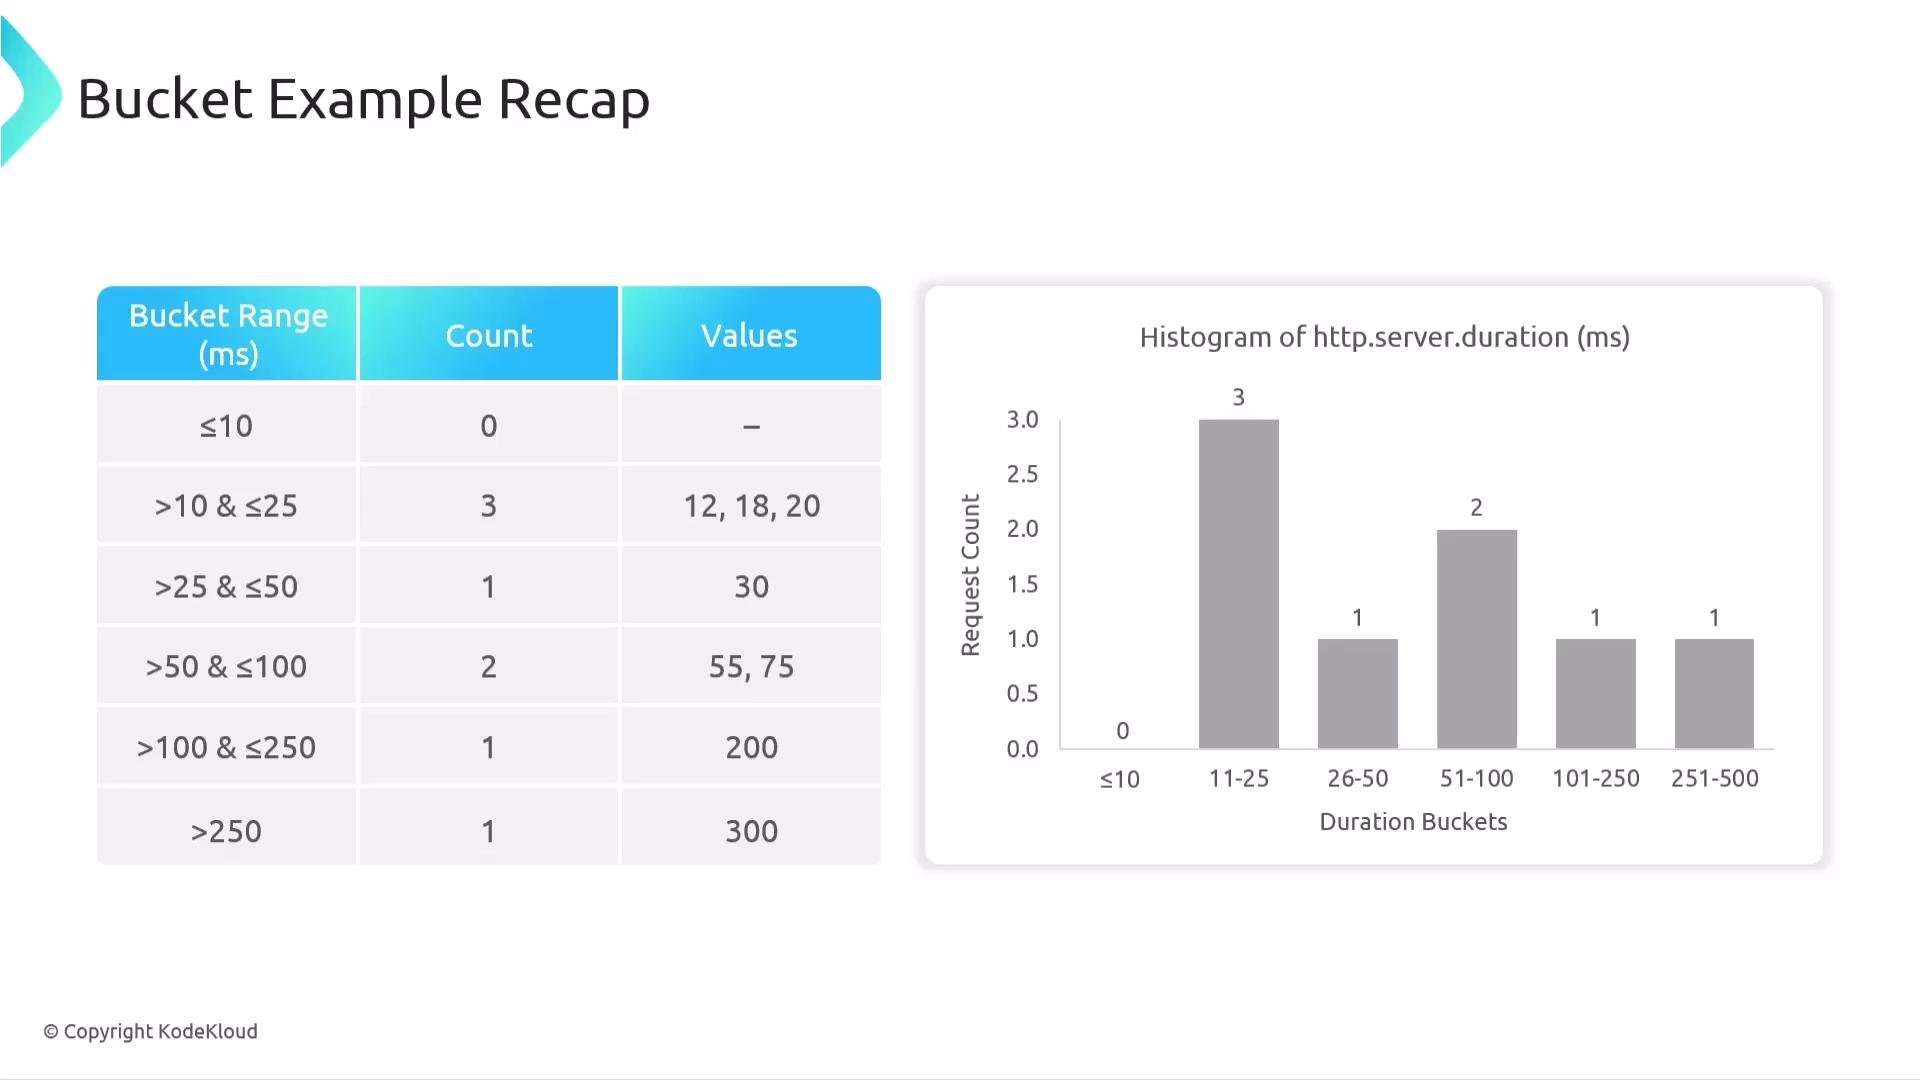
- Observed values: 12 ms, 18 ms, 20 ms, 30 ms, 75 ms, 200 ms, 300 ms
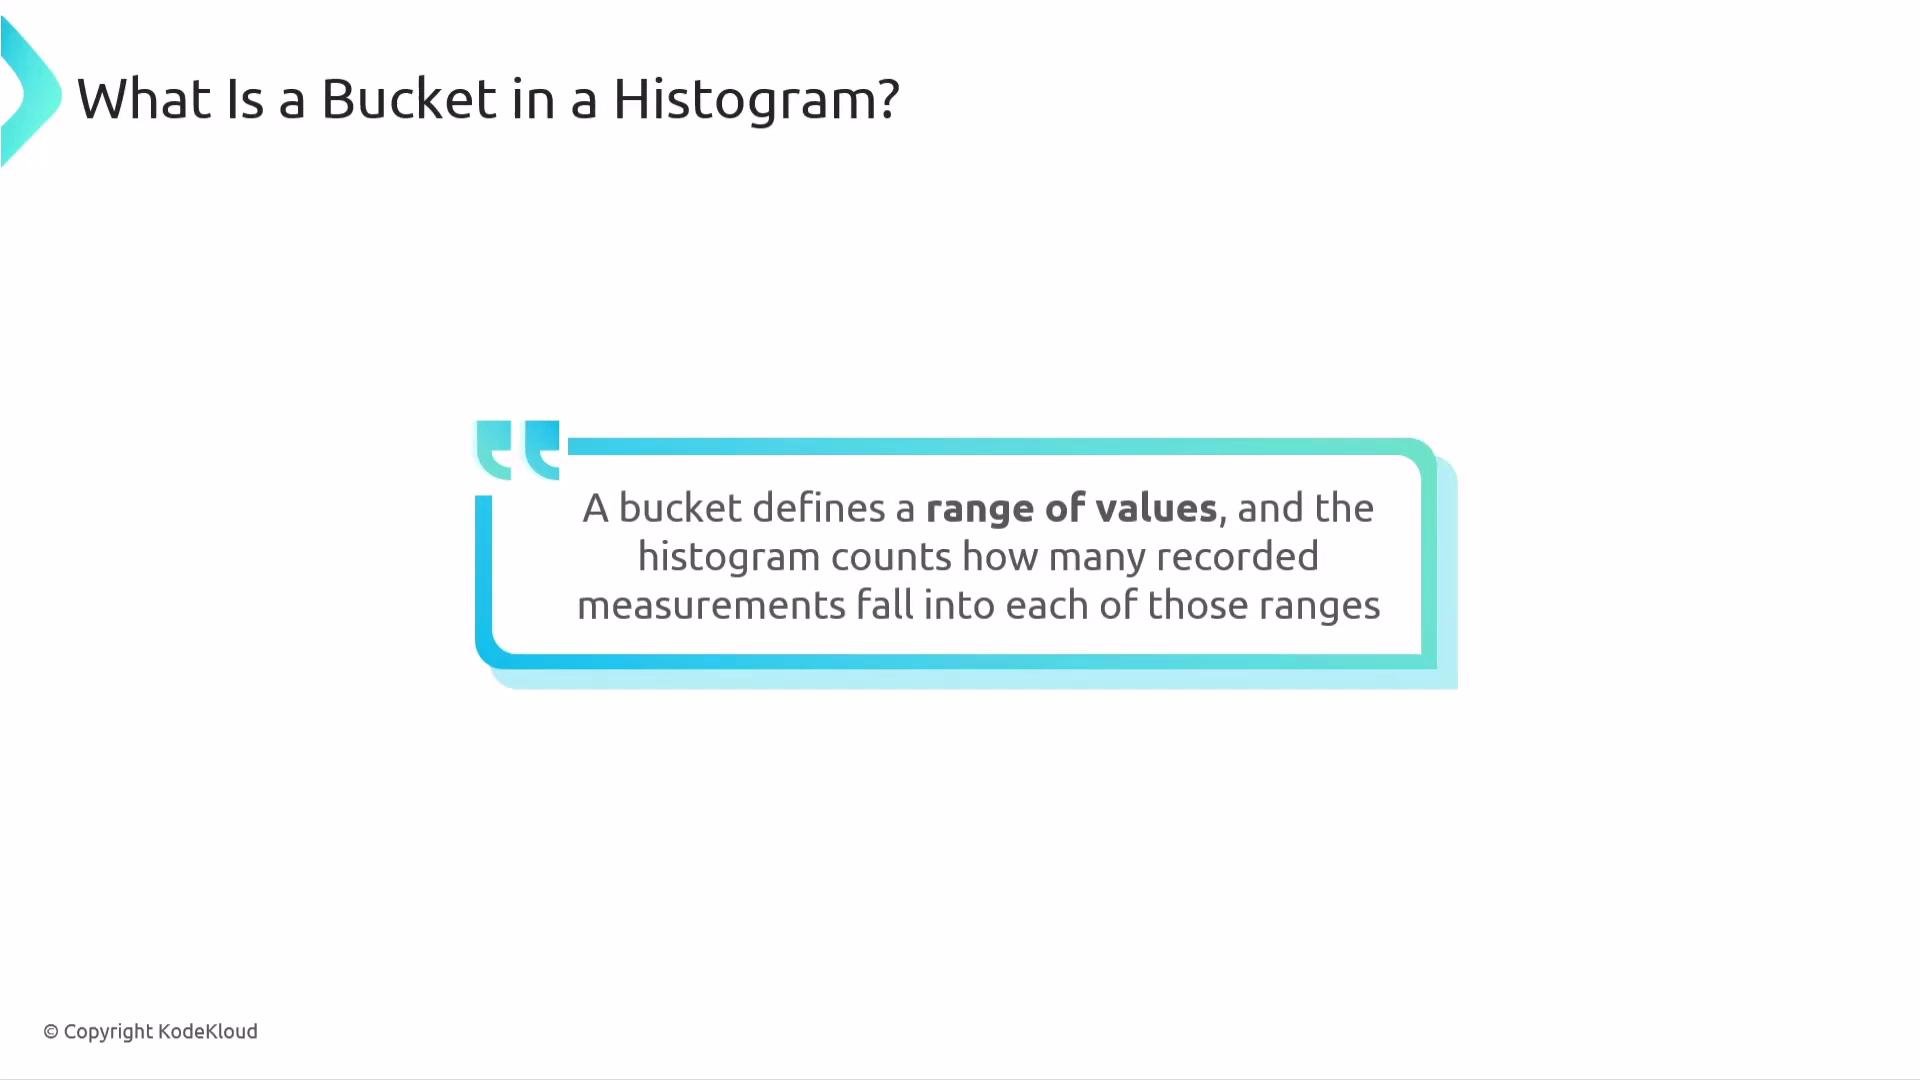
- Explicit buckets: you define threshold boundaries manually (e.g., 0–10 ms, 10–50 ms, 50–100 ms, …).
- Exponential buckets: boundaries grow exponentially and adapt better to wide-ranging values.
Percentiles from histograms
Percentiles summarize the distribution:- P50 (median) — half the requests are at or below this value. In the example above:
P50 ≈ 30 ms. - P90 — 90% of requests are at or below this value; useful to measure typical tail latency.
- P95 and P99 — isolate heavier tails and outliers to guide performance tuning and alerting.
Quick reference & resources
- OpenTelemetry Metrics overview: https://opentelemetry.io/docs/messaging/metrics/
- Histogram guidance and best practices: check your backend docs for supported histogram types (
explicitvsexponential) and percentile computation guarantees.
Histograms are essential when distribution matters. Percentiles and distribution summaries derived from histograms reveal performance characteristics that averages alone can hide.