

- Deploy an Instrumentation custom resource (CR) to configure auto-instrumentation.
- Annotate a Deployment to opt the pod into Python auto-instrumentation.
- Generate traffic and verify traces in Jaeger.
- A Kubernetes cluster (e.g., kind, GKE, EKS).
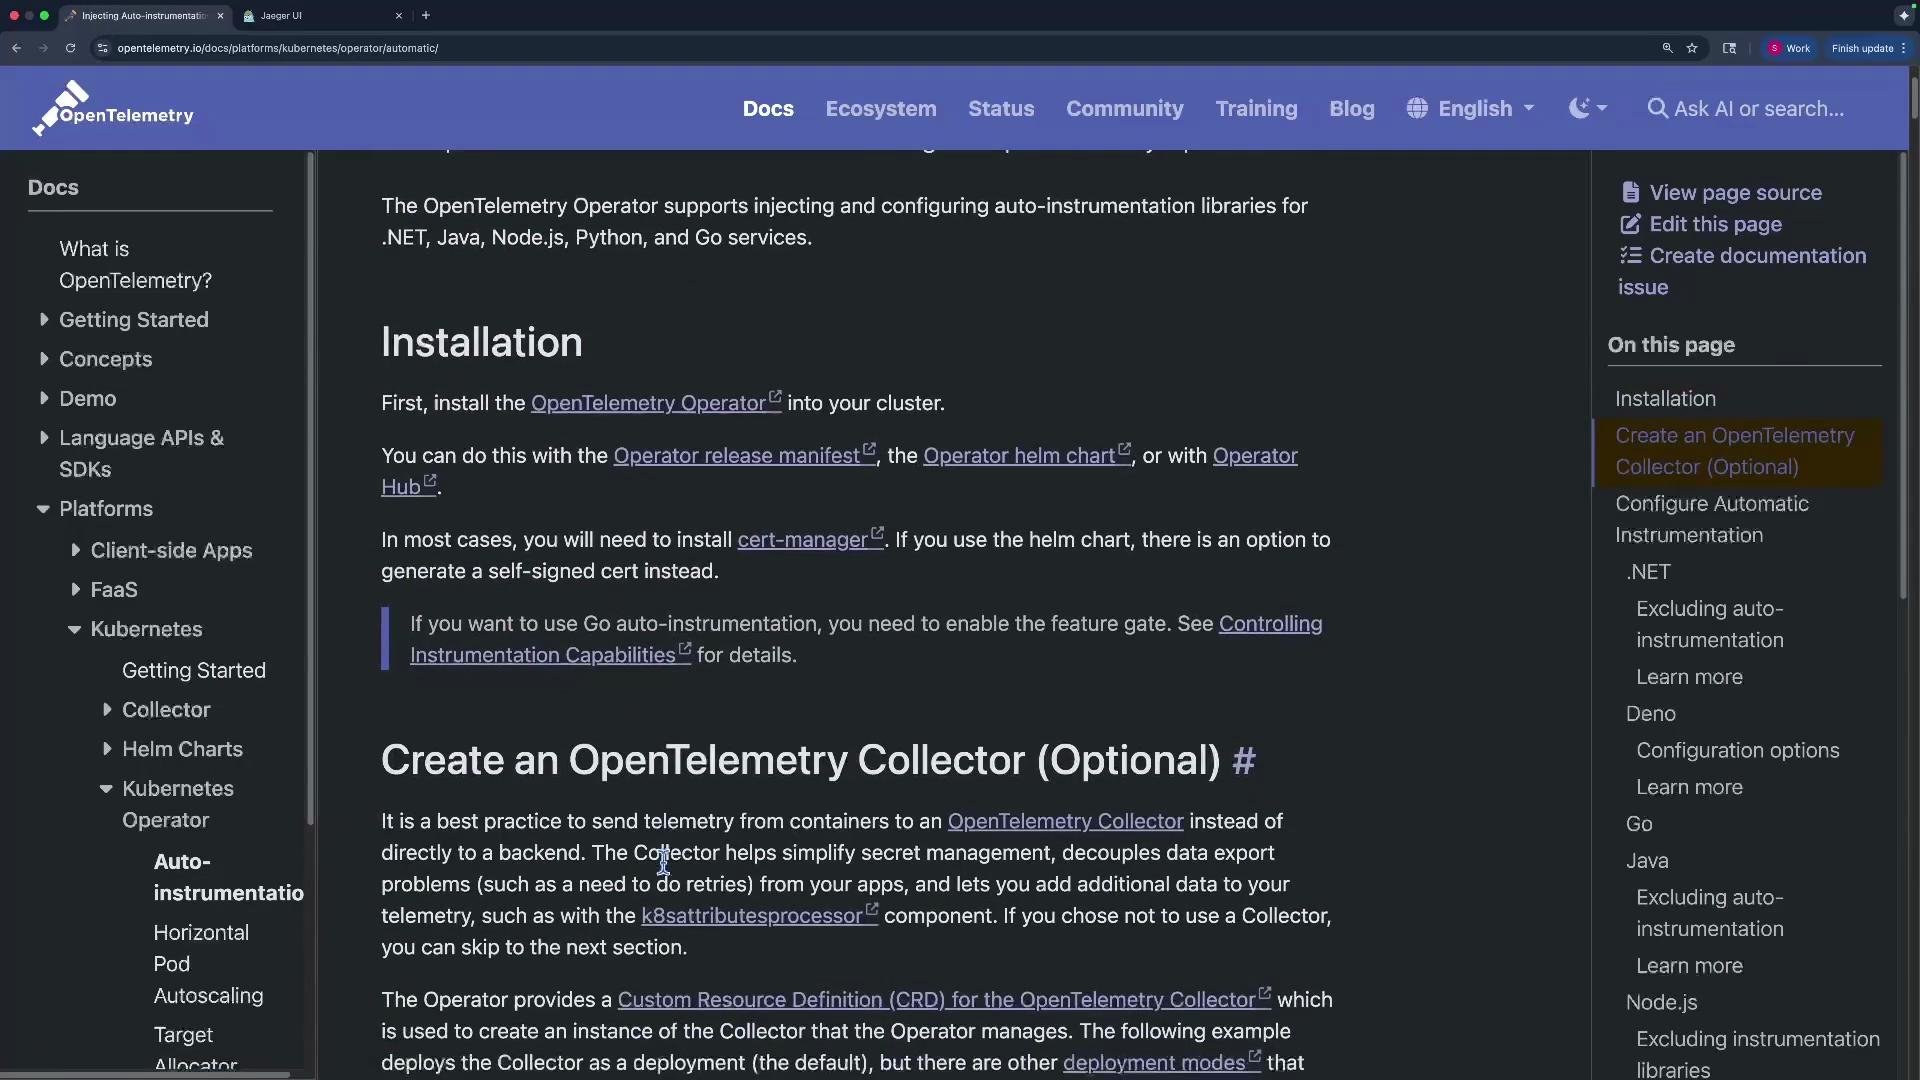
- OpenTelemetry Operator and an OpenTelemetry Collector deployed in the cluster.
- A tracing backend such as Jaeger.
Sample Flask application (no manual instrumentation)
Save this Flask app asapp.py (this example contains no OpenTelemetry code):
Verify cluster components
Confirm nodes and that the Collector pod and operator are running:Create the Instrumentation CR
Create an Instrumentation resource to tell the operator:- which exporter endpoint to use (Collector HTTP OTLP/4318),
- which context propagators to enable,
- the sampling strategy.
instrumentation.yaml:
Apply the Instrumentation CR:
Opt your Deployment into auto-instrumentation
To enable Python auto-instrumentation for a Deployment, add the annotationinstrumentation.opentelemetry.io/inject-python: "true" to the pod template. You can also reference a specific Instrumentation CR by name (e.g., "python-instrumentation") or use cross-namespace format ("other-namespace/my-instrumentation").
Add
instrumentation.opentelemetry.io/inject-python: "true" to your Deployment pod template to enable Python auto-instrumentation. You may also set the annotation value to the Instrumentation CR name to bind to a specific configuration.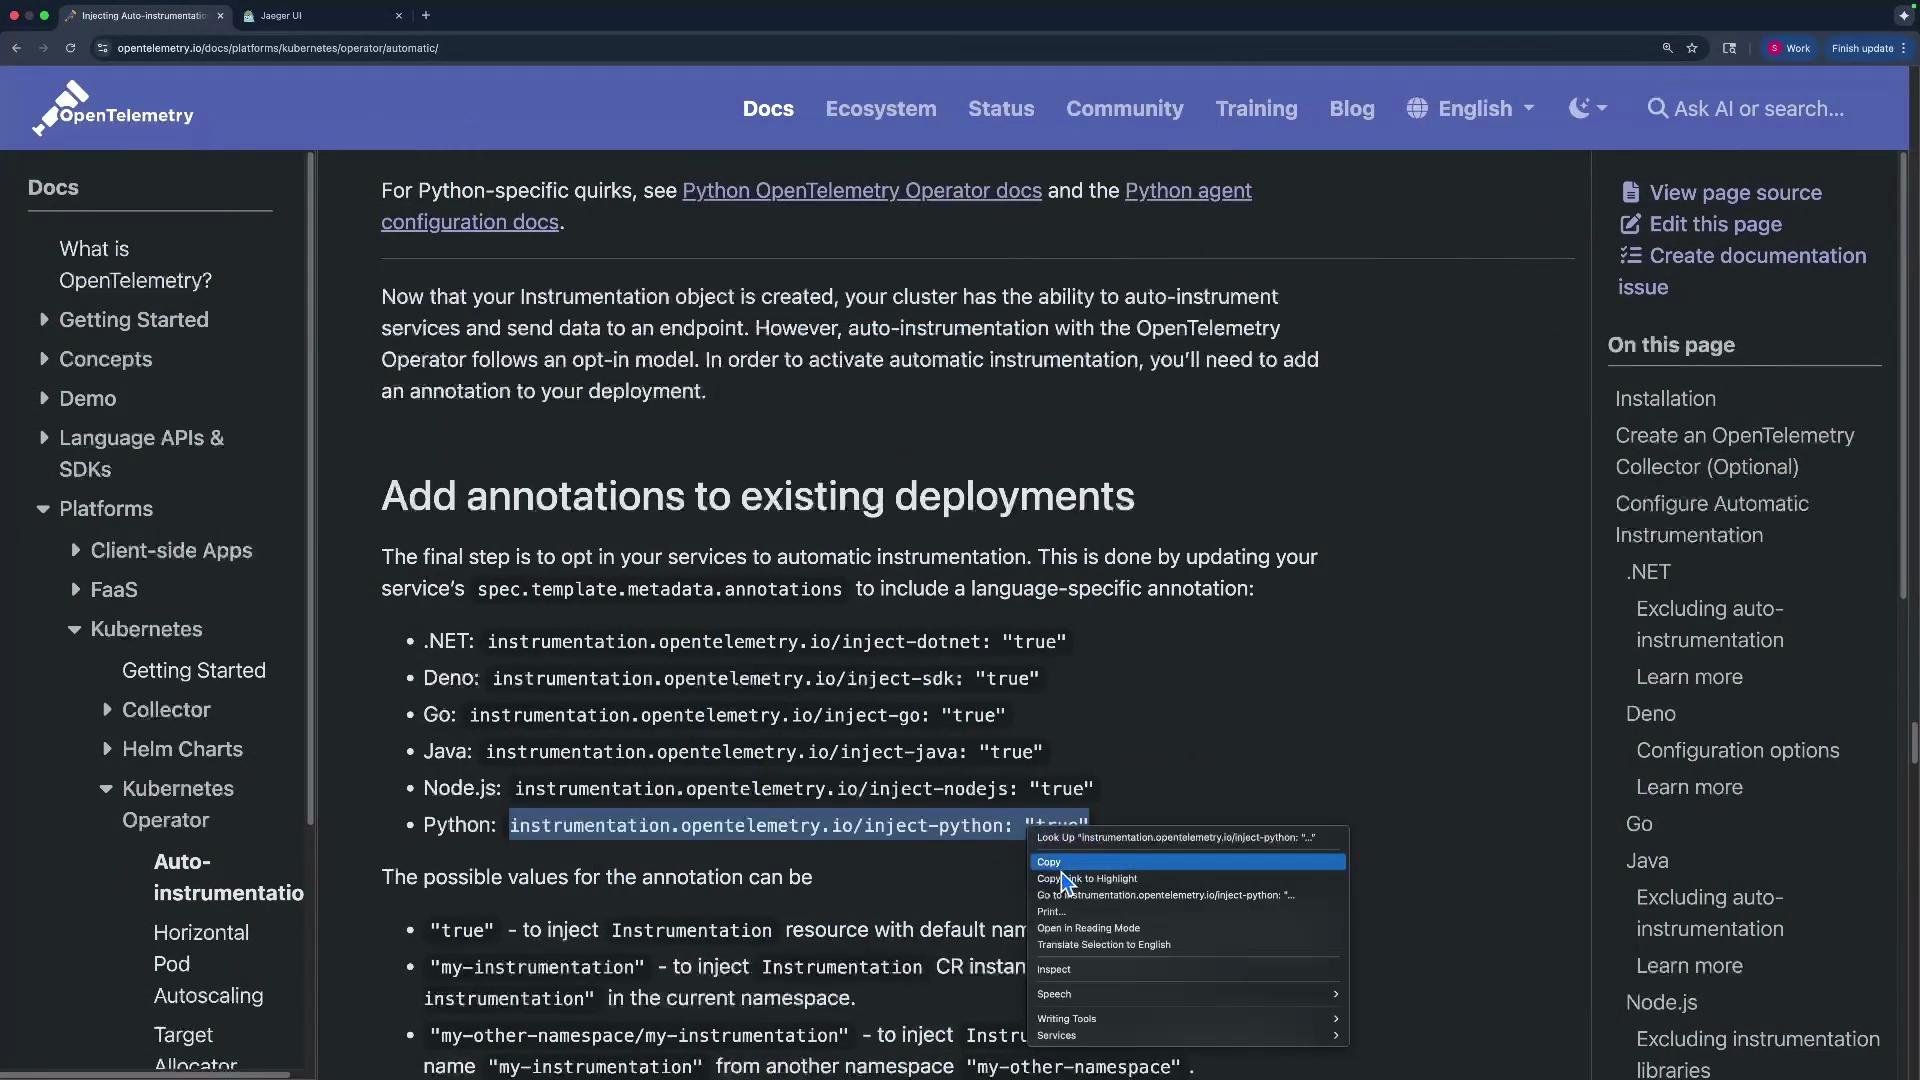
Deployment and Service (example)
Save this Deployment + Service asflask_deployment.yaml. It includes the Python injection annotation and exposes the app via a NodePort.
Generate traffic and verify traces
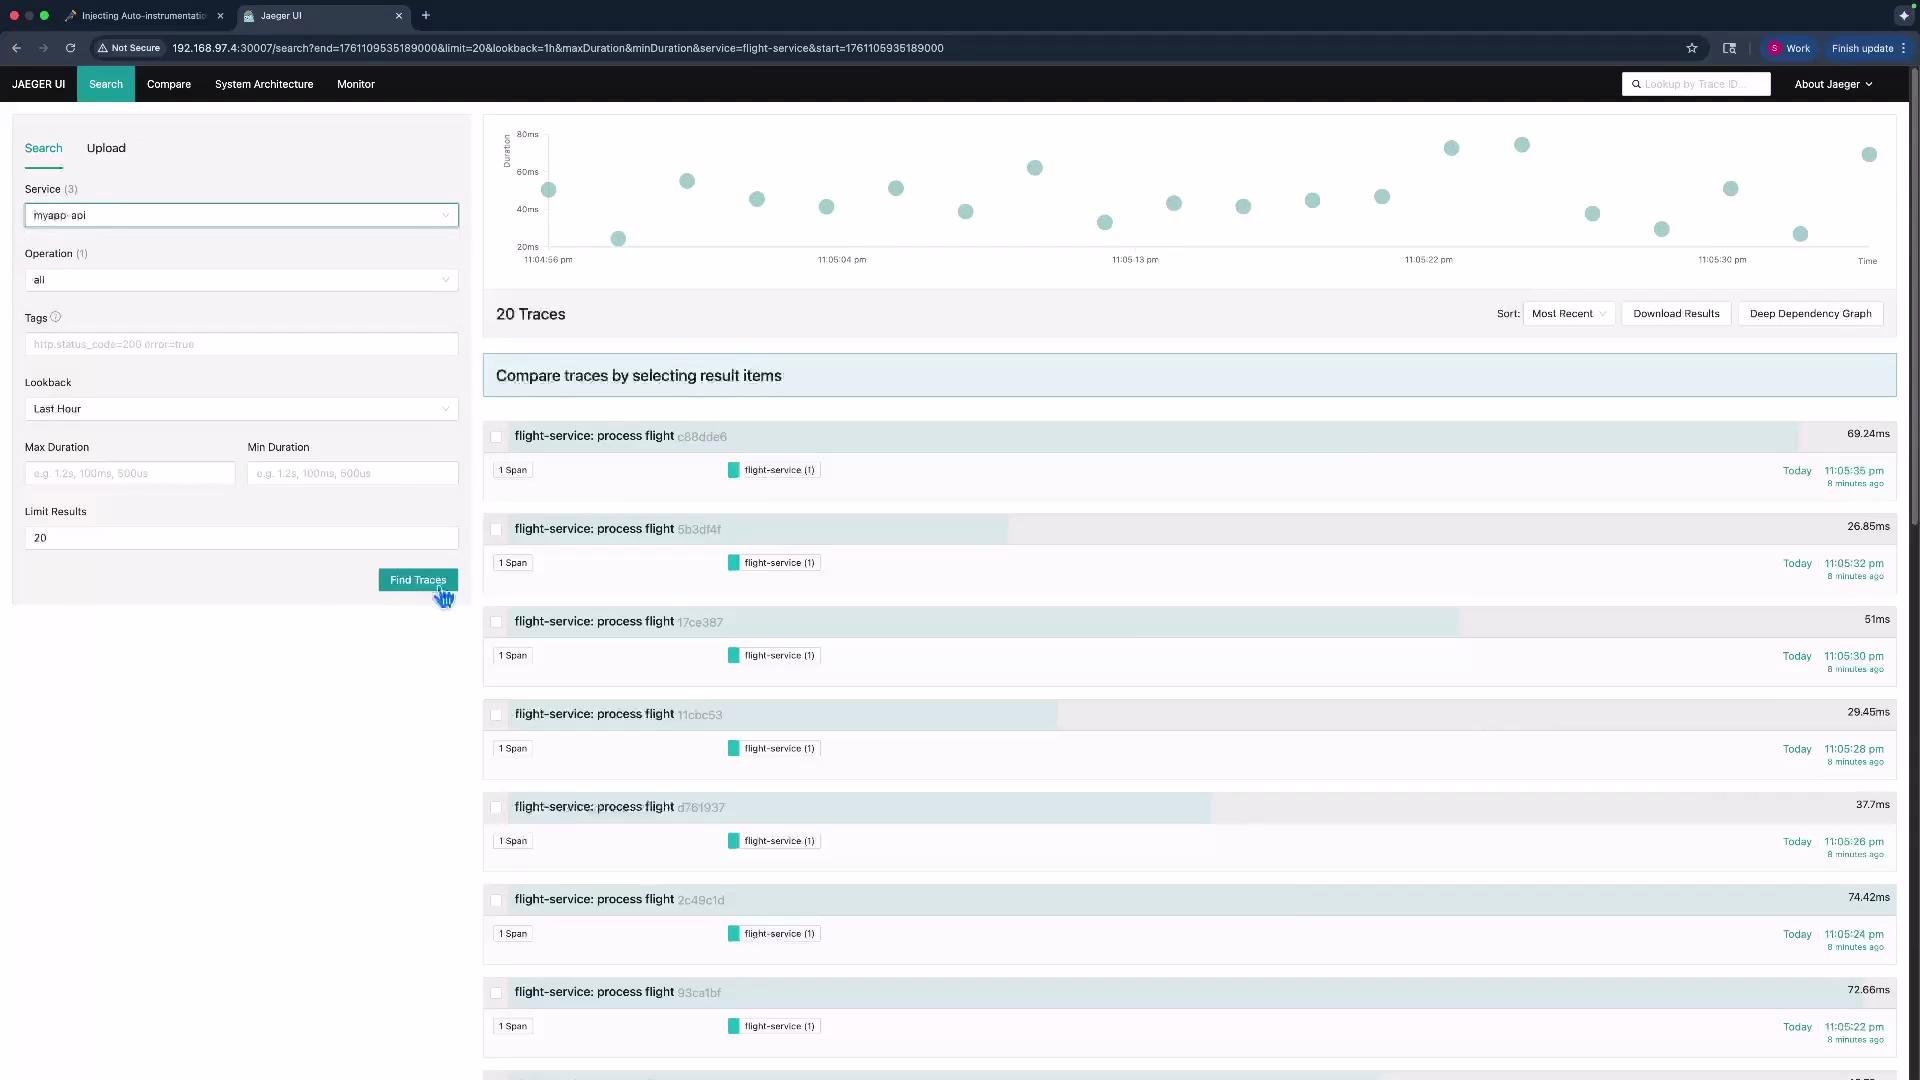
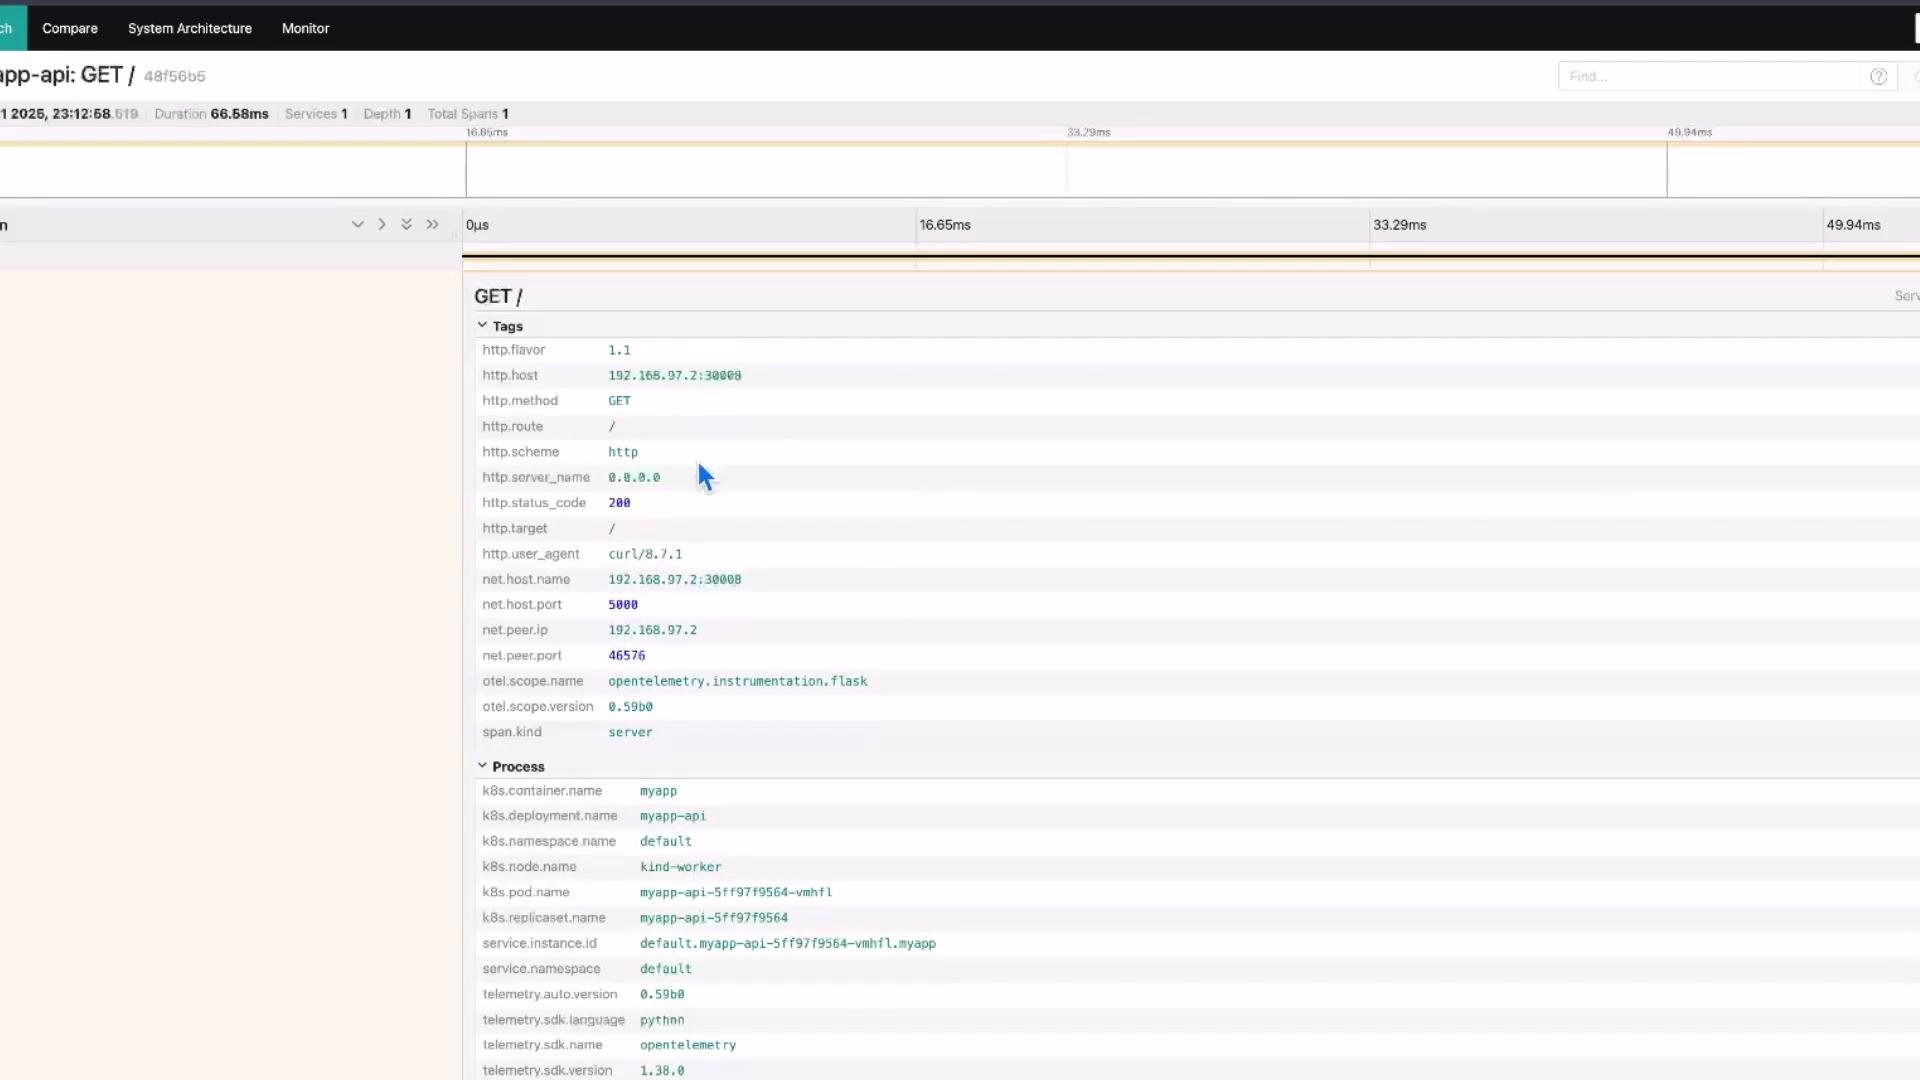
Send a request to the service using a node IP and the NodePort (replace with your node IP):myapp-api in Jaeger. Open the Jaeger UI and refresh the traces list to locate recent traces for the service.
Summary
Steps recap:- Deploy the OpenTelemetry Operator and a Collector.
- Create an Instrumentation CR that configures exporter, propagators, and sampler.
- Annotate your Deployment pod template to enable language-specific auto-instrumentation.
- Generate traffic and verify traces in your tracing backend (Jaeger/Zipkin).
Links and references
- OpenTelemetry Operator docs: https://opentelemetry.io/docs/operator/
- OpenTelemetry Python auto-instrumentation: https://opentelemetry.io/docs/instrumentation/python/
- Jaeger UI: https://www.jaegertracing.io/