

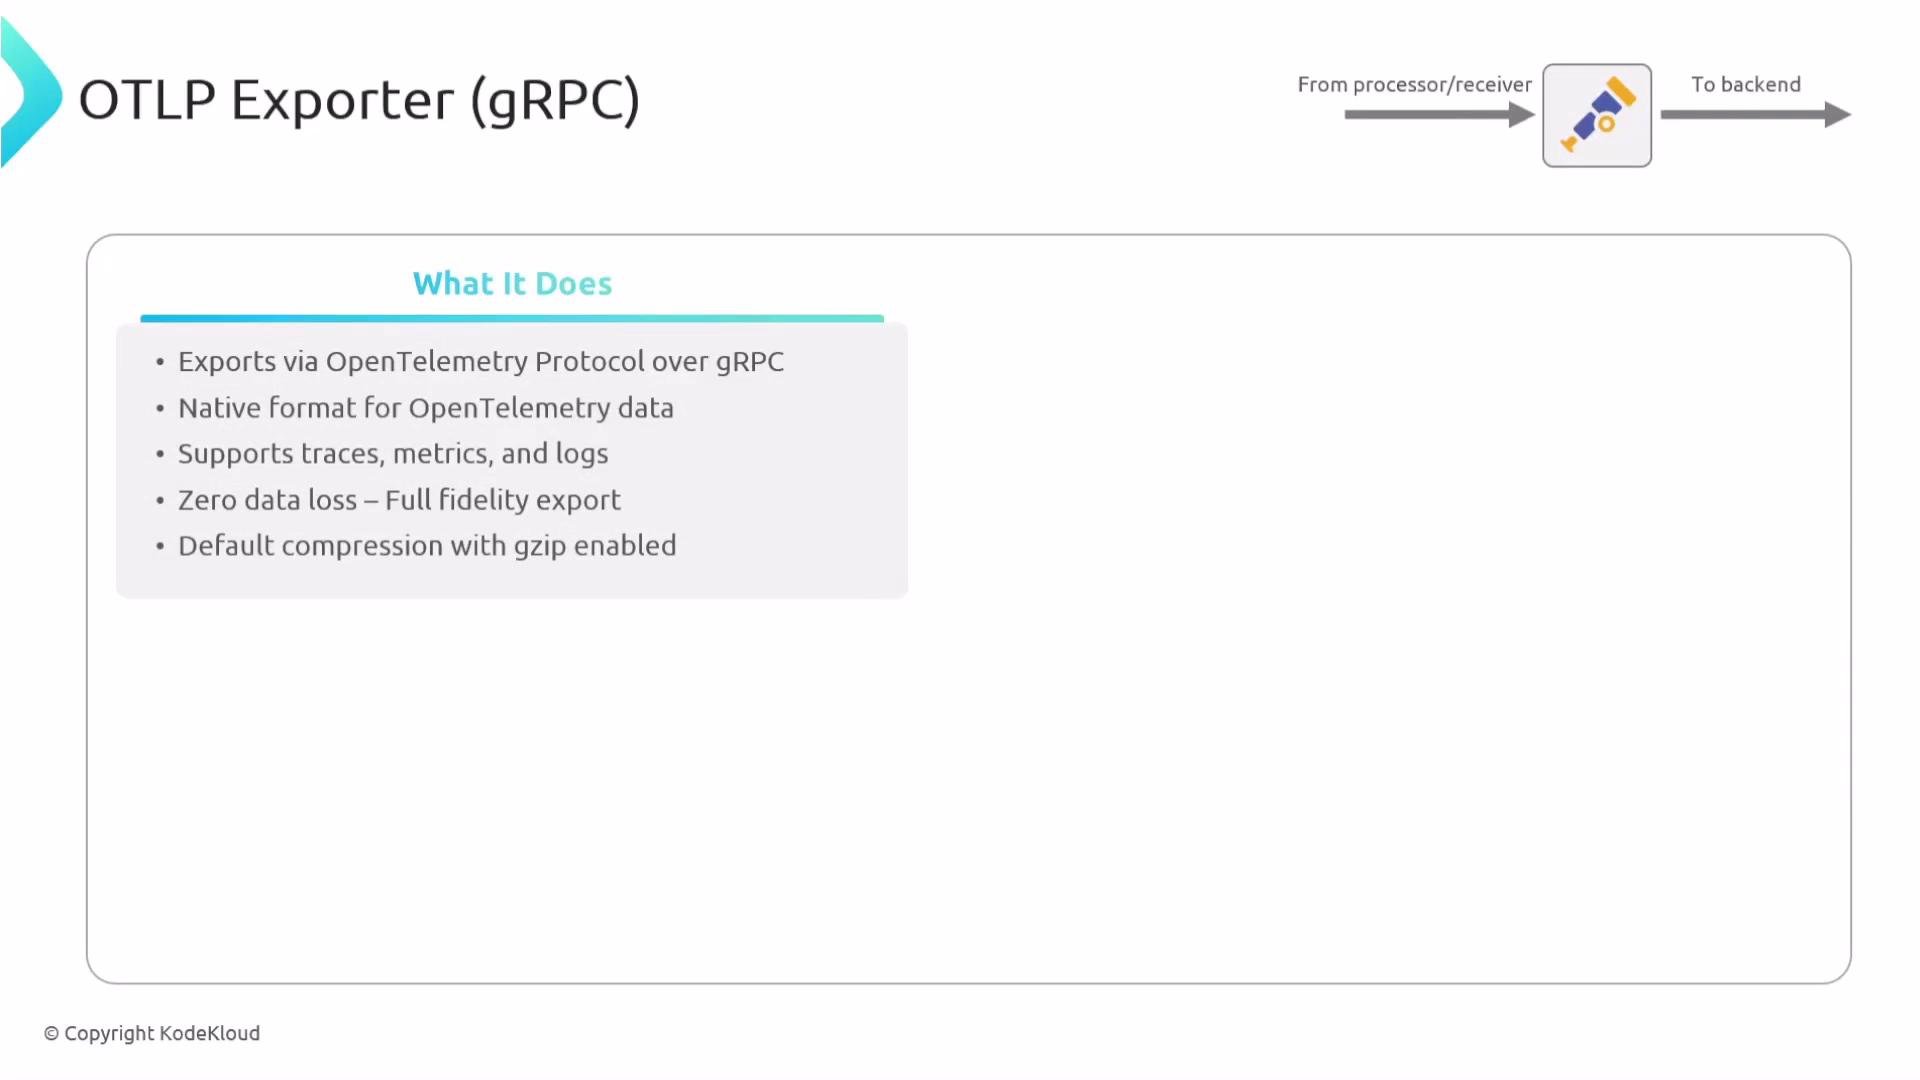
- Exports traces, metrics, and logs with full fidelity (best-effort delivery).
- Supports compression (gzip) to reduce bandwidth.
- Common use cases: forward data to another collector or to an OTLP-compatible backend.
- gRPC (OTLP/gRPC): typical choice for efficient binary transport and streaming RPCs.
- HTTP (OTLP/HTTP): use when gRPC is blocked by firewalls, proxies, or when backends only support HTTP. OTLP/HTTP supports both Protocol Buffers (
proto) and JSON encodings and also supports gzip if both client and server accept it.
endpoint: destination host:port or URL- TLS settings: TLS, mTLS, or
insecure(only for testing) headersor authenticator extension references for authentication- Resiliency/backpressure controls:
retry_on_failure,sending_queue, andtimeout
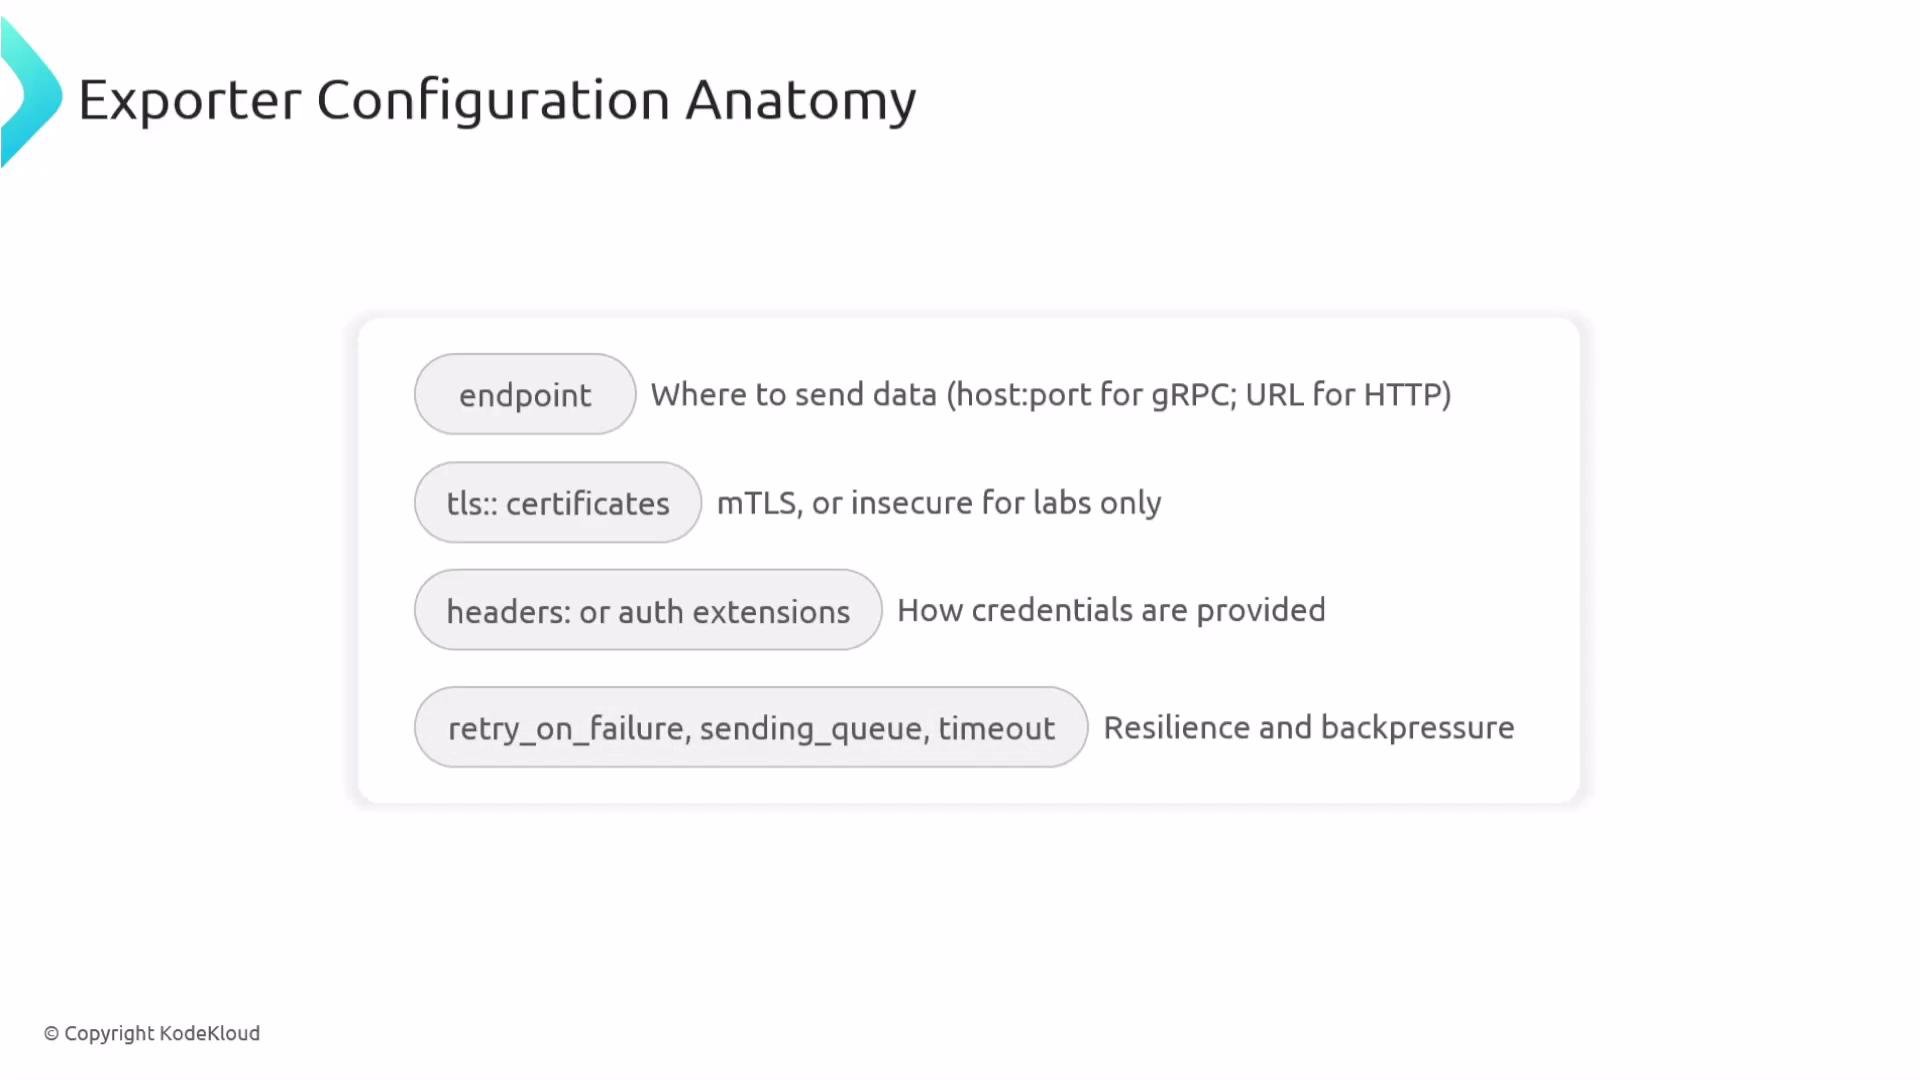
timeout: per-RPC timeout (here 10s) — how long each export attempt can take before being cancelled.retry_on_failure: enables exponential/backoff retries;max_elapsed_timecaps total retry duration (here 10 minutes).sending_queue.queue_size: number of telemetry items buffered while retrying or during backpressure.
Authentication and secrets
Exporters often require credentials or tokens. Common approaches:
- Static headers (quick tests; not recommended for production).
- Authenticator extensions (e.g., OAuth2/OIDC flows) the exporter can reference to retrieve tokens.
- Environment variables or secret stores (recommended) to avoid embedding secrets in config.
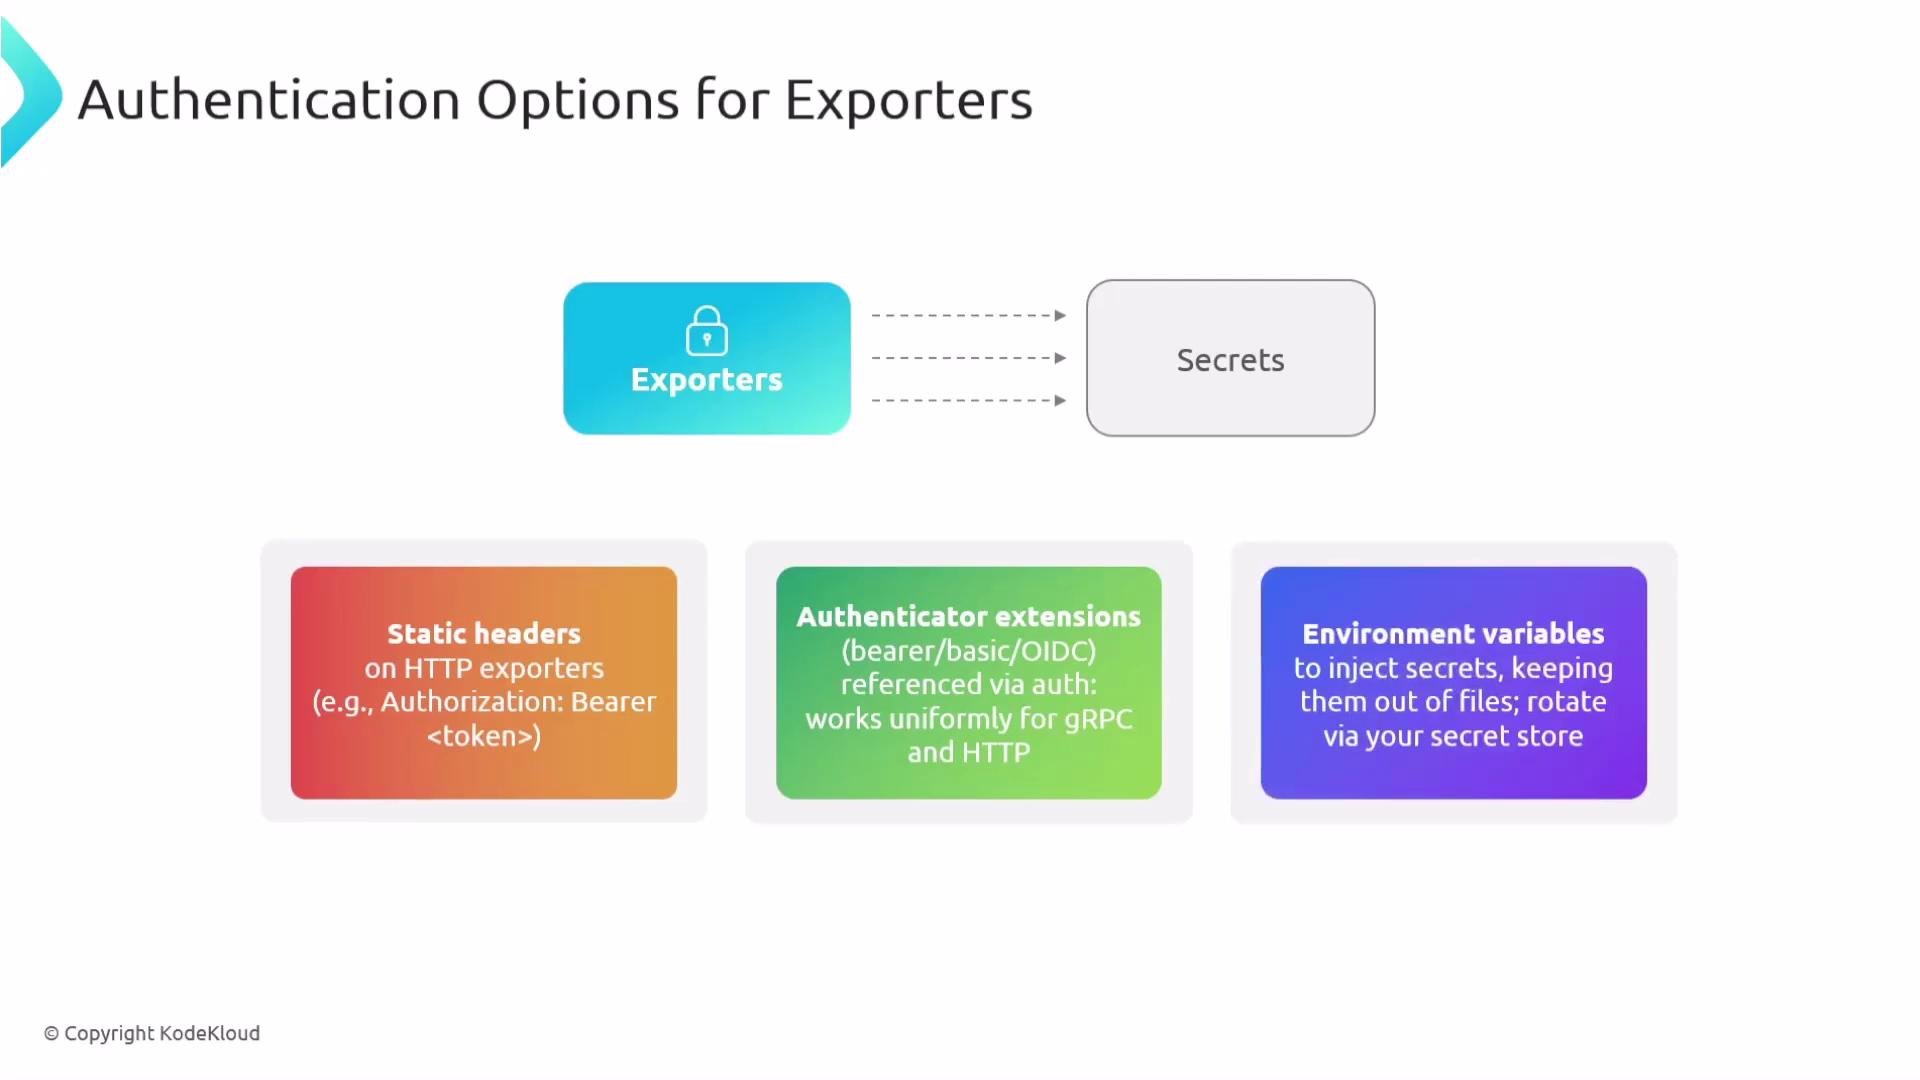
For production, avoid hard-coding secrets in config. Externalize tokens (for example, via a secrets manager or Vault) and reference them through an auth extension or environment variables so the exporter can attach bearer tokens without secrets in plaintext.
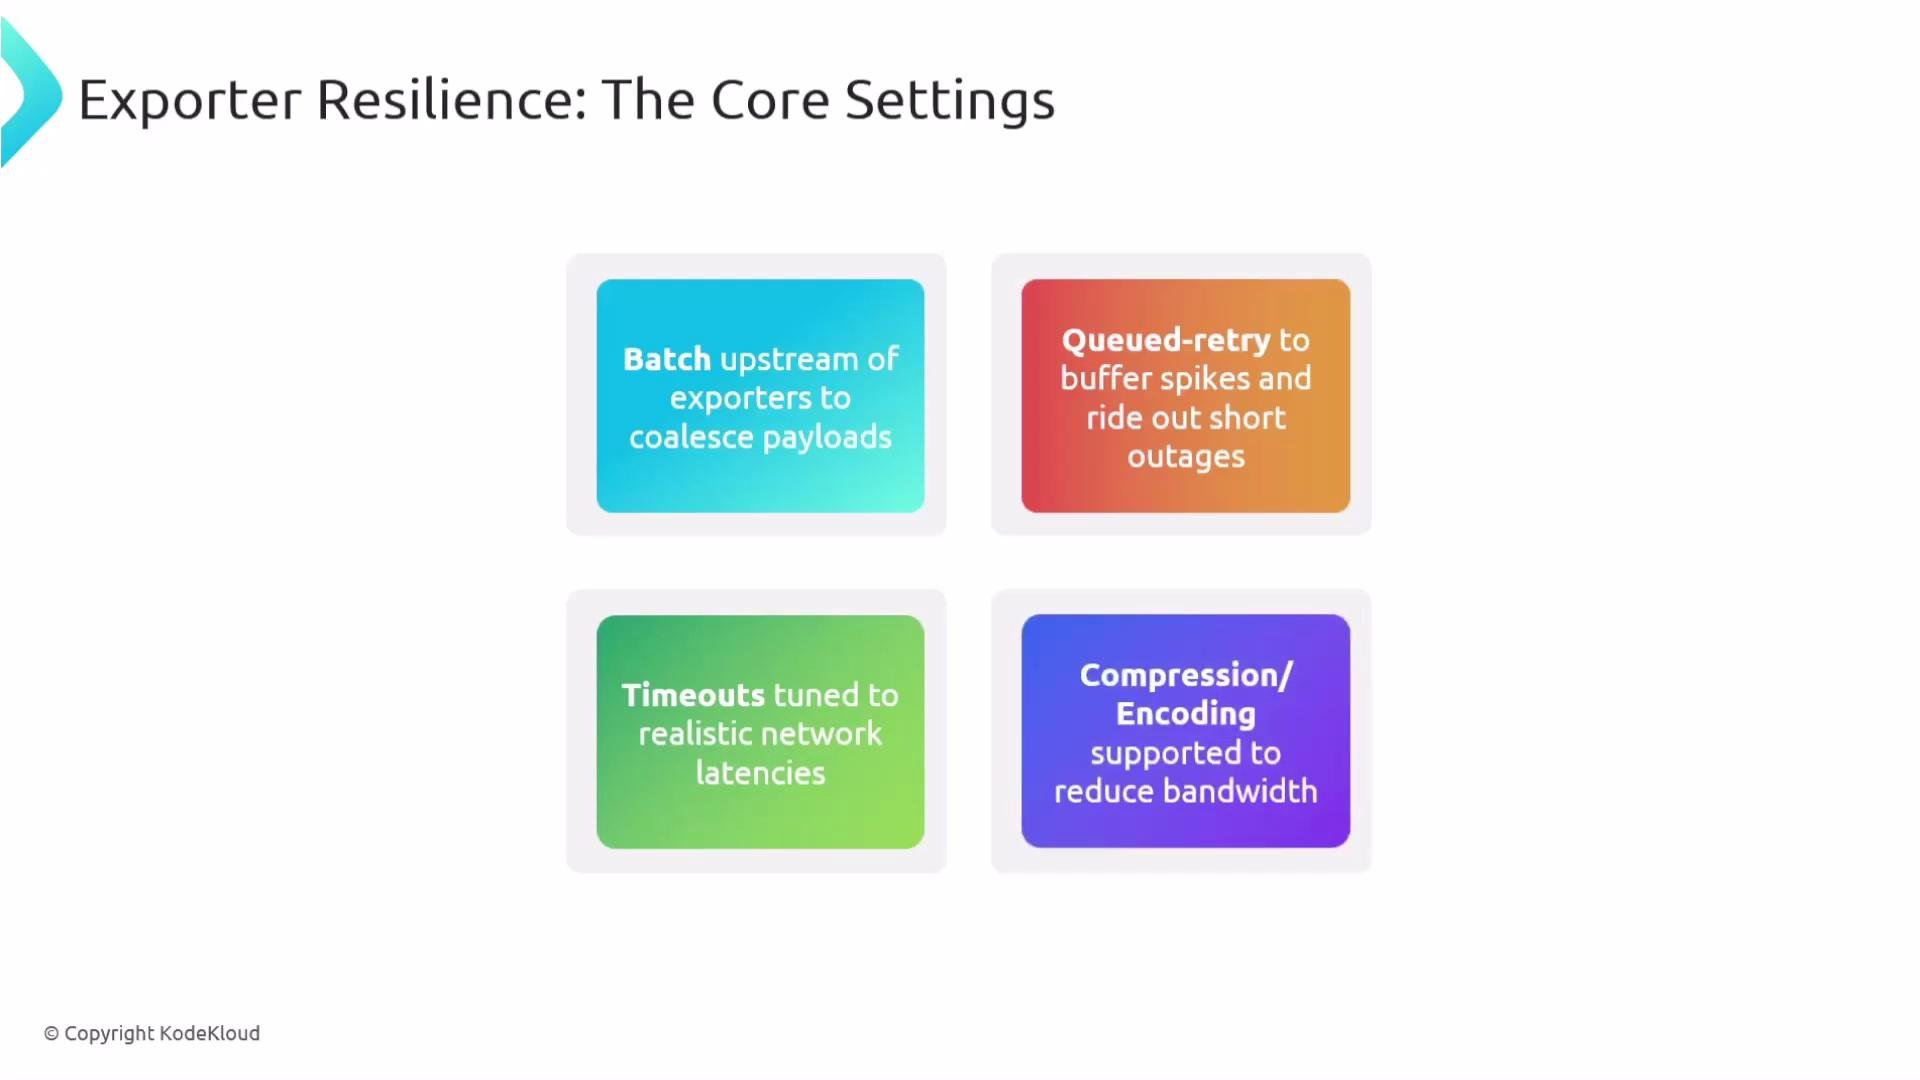
- Batch telemetry before exporting to reduce overhead and round trips.
- Use a queued retry (
sending_queue+retry_on_failure) to buffer spikes and survive brief outages. - Set realistic
timeoutvalues aligned with network latency and backend performance. - Enable compression (gzip) to reduce bandwidth usage.
- Increase
send_batch_sizeto send fewer, larger payloads while tuningtimeoutso batches flush regularly. - Batching reduces per-item overhead and lowers the number of outbound requests.
verbosity:basic,normal, ordetailedsampling_initial/sampling_thereafter: limit log volume on chatty exporters
- OpenTelemetry Protocol (OTLP) overview: https://github.com/open-telemetry/opentelemetry-specification
- OpenTelemetry Collector documentation: https://opentelemetry.io/docs/collector/
- OAuth2: https://oauth.net/2/
- OpenID Connect (OIDC): https://openid.net/connect/