

Quick Helm install
Add the Helm repo and install the operator quickly:Environment sanity checks
Confirm your Kubernetes nodes and clean up any prior resources you no longer need:Install with a customized values.yaml
For more control, fetch the chart defaults, edit them, then install with your editedvalues.yaml:
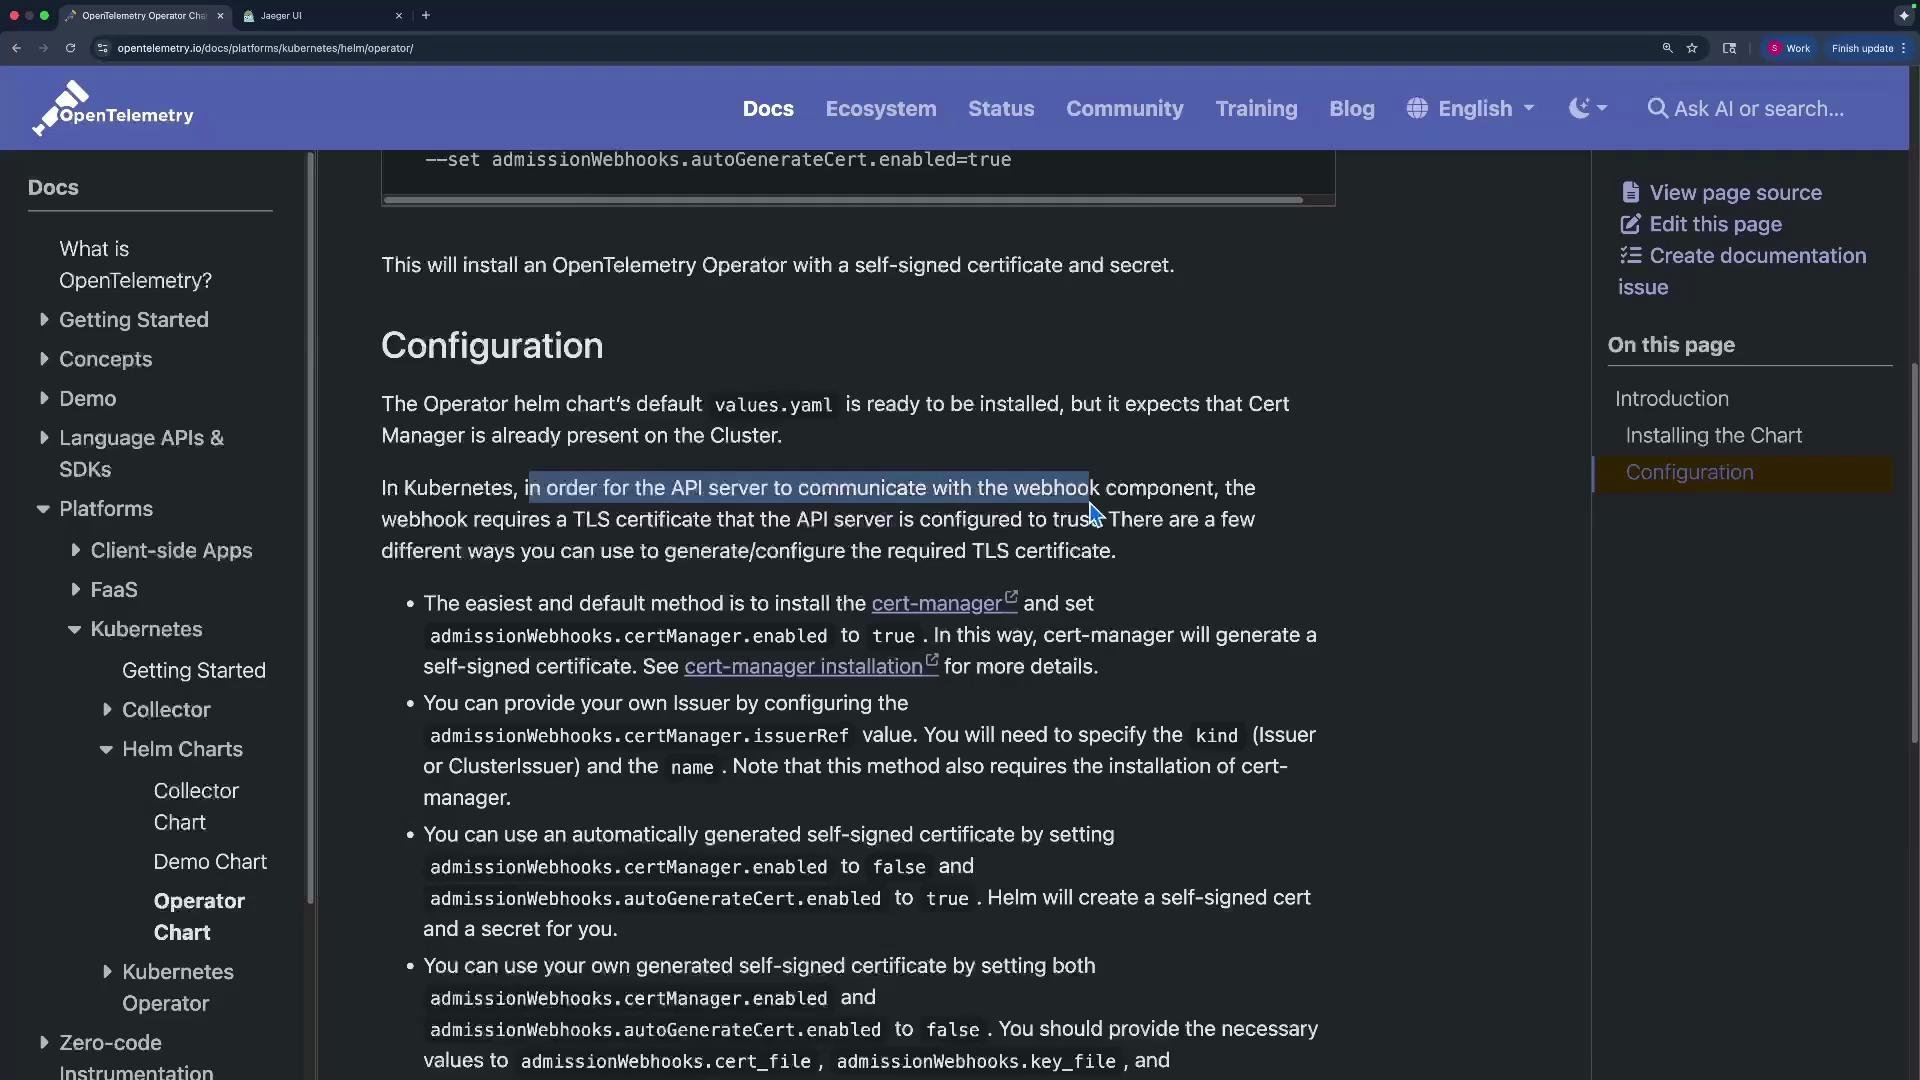
TLS / Admission webhook certificate options
The operator installs admission webhooks that require a TLS certificate trusted by the API server. You have three main options:If you don’t want to install
cert-manager, set admissionWebhooks.certManager.enabled to false and admissionWebhooks.autoGenerateCert.enabled to true so the operator auto-creates a self-signed webhook certificate suitable for demos and local testing.values.yaml snippet to enable the operator’s auto-generated certificate:
Configure operator and collector images
Set the manager and default collector image repositories and tags invalues.yaml as needed:
Verify the operator
Check deployments:OpenTelemetryCollector custom resources for you.
The OpenTelemetry Operator chart documentation describes the webhook/TLS details in depth: https://github.com/open-telemetry/opentelemetry-helm-charts/tree/main/charts/opentelemetry-operator
Creating a Collector via the Operator
Create a collector by applying anOpenTelemetryCollector CR. The CRD accepts the standard collector configuration (receivers, processors, exporters, service pipelines) and operator-specific fields such as mode (Deployment or DaemonSet) and upgrade settings.
Example collector.yaml — a deployment-mode collector named my-collector that accepts OTLP, logs debug output, and forwards traces to an in-cluster Jaeger service:
Services created by the operator
When the operator deploys a collector indeployment mode it creates ClusterIP Services so other pods can reach the collector by DNS (no need to use node IPs).
Example kubectl get svc output (collector services highlighted):
Deploy an application that sends traces
Point your app at the collector service DNS (e.g.my-collector-collector) instead of a node IP. Example Deployment snippet:
kubectl logs output from the sample app:
Viewing traces in Jaeger
Open the Jaeger UI (NodePort, port-forward, or external URL) and search for your service. The UI should display traces forwarded from your application via the operator-managed collector.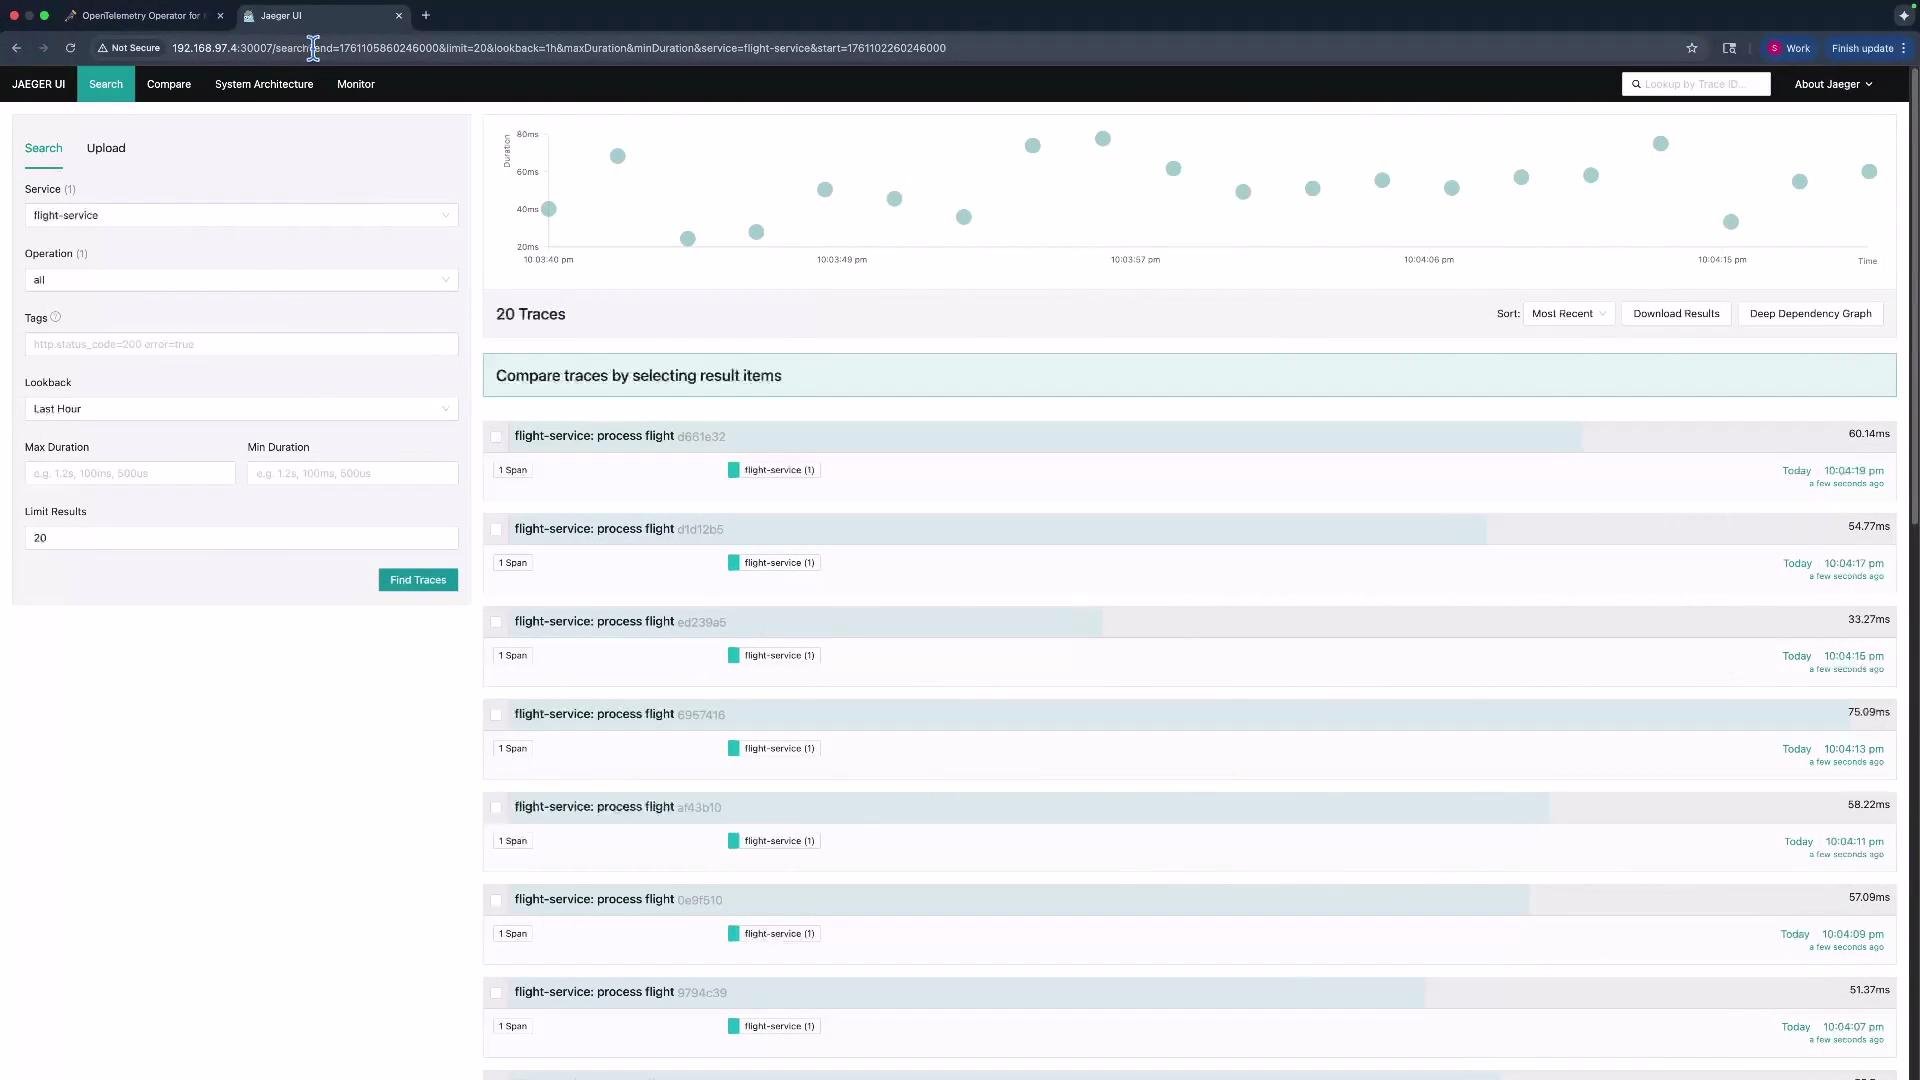
Conclusion
Using the OpenTelemetry Operator makes collectors Kubernetes-first: define anOpenTelemetryCollector CR with normal collector configuration, choose deployment mode (DaemonSet or Deployment), and let the operator manage lifecycle, upgrades, and reconciliations. This is especially helpful for cluster-wide auto-instrumentation and centralized collector management.
Links and references
- OpenTelemetry Operator Helm Chart: https://github.com/open-telemetry/opentelemetry-helm-charts/tree/main/charts/opentelemetry-operator
- cert-manager documentation: https://cert-manager.io/docs/
- OpenTelemetry Collector releases: https://github.com/open-telemetry/opentelemetry-collector-releases
- Jaeger project: https://www.jaegertracing.io/
- Kubernetes documentation: https://kubernetes.io/docs/