

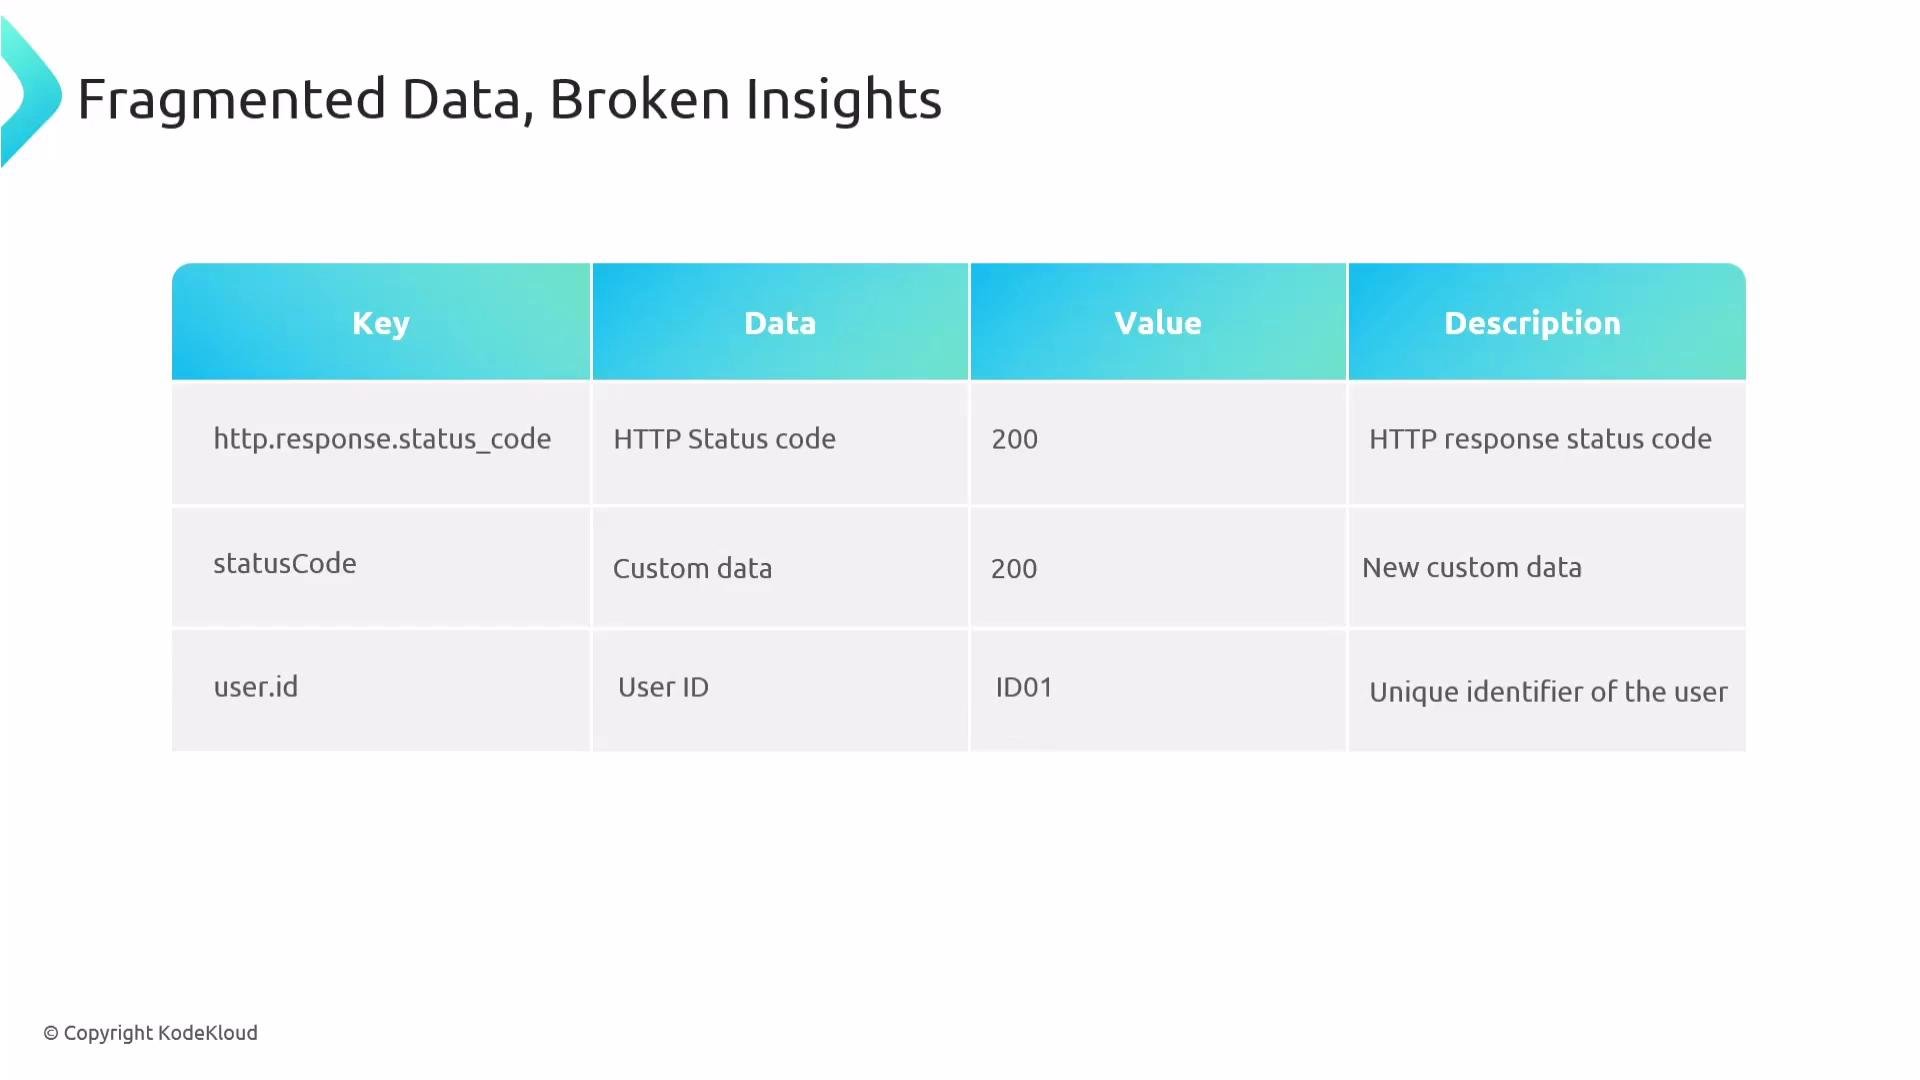
http.status_code with value 200 and user.id with value ID-01. Another team emits the same concepts but with different keys: status_code (no http. prefix) and userId (camelCase).
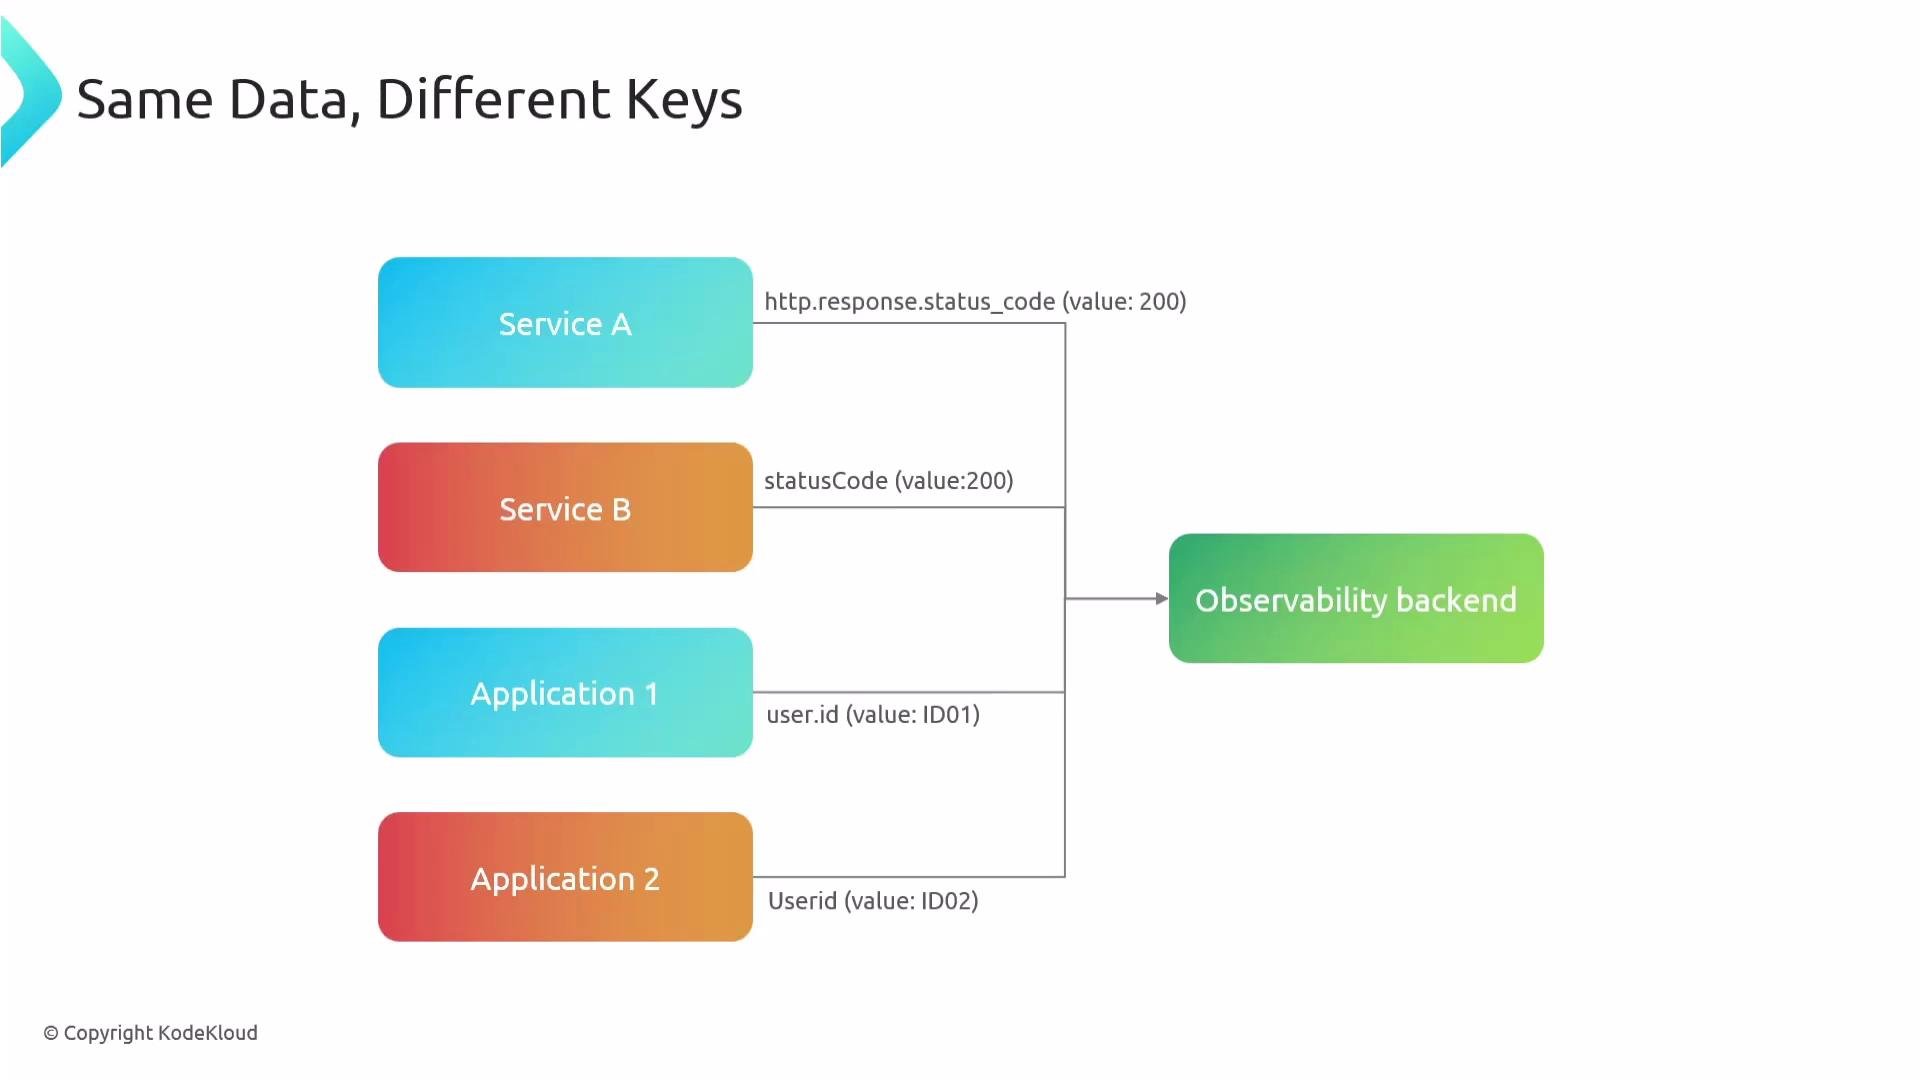
http.status_code as an HTTP status (because it follows a known convention), while status_code becomes a custom key and is treated differently. Likewise, user.id might be recognized, but userId or userid may be treated as arbitrary fields.
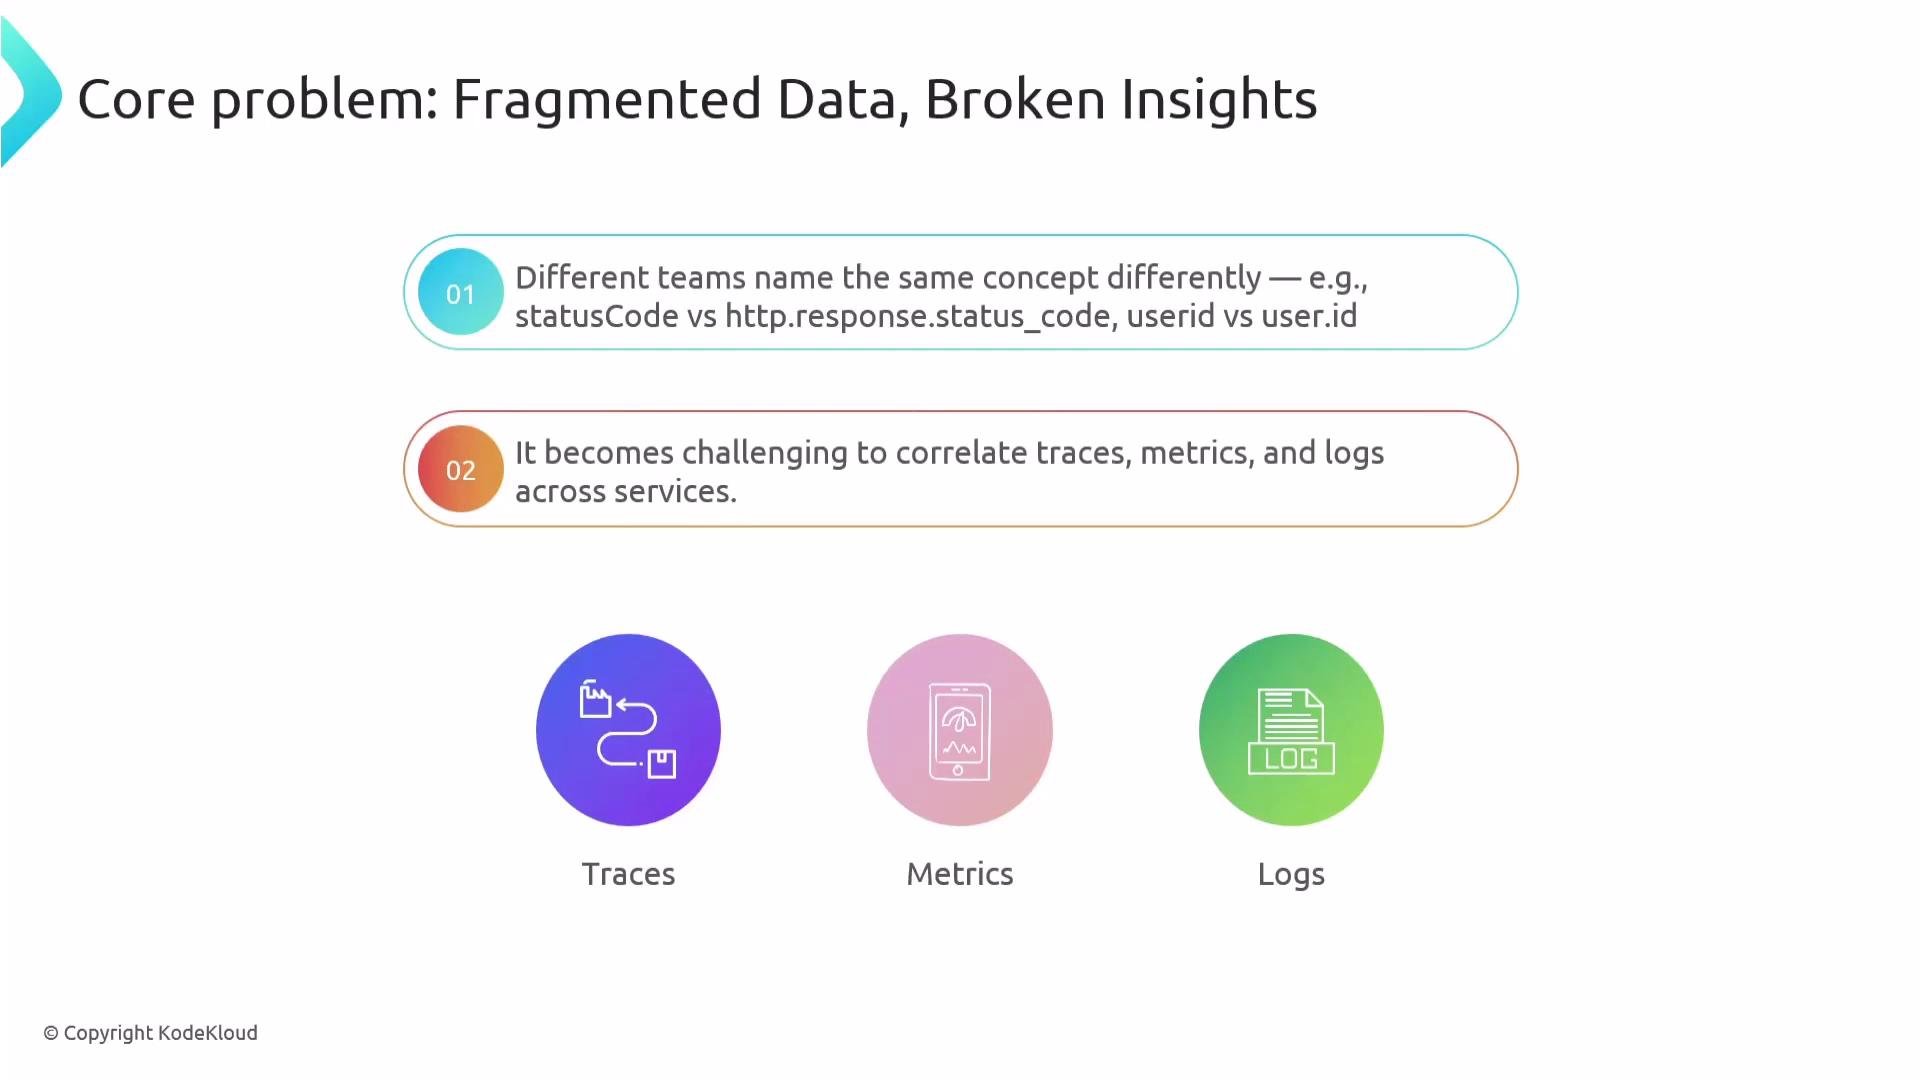
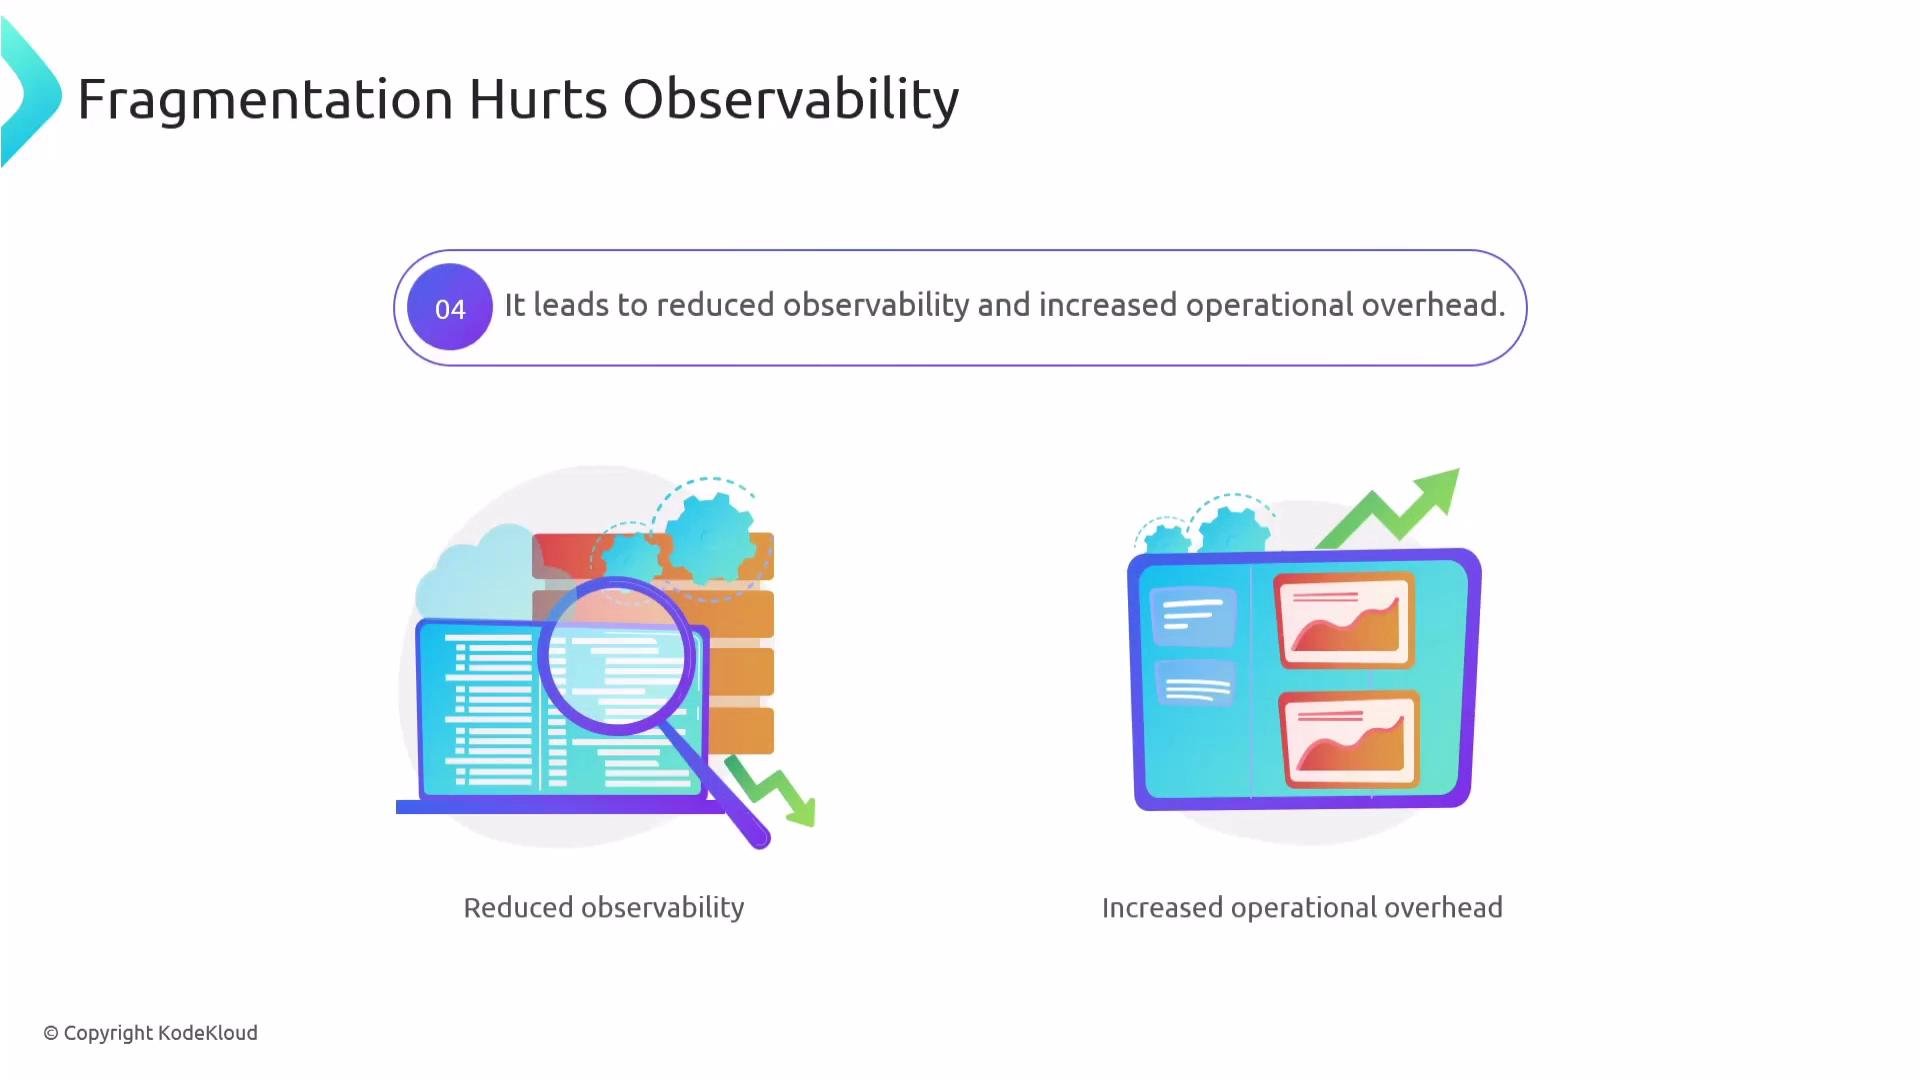
This fragmentation—different names for the same concept—makes it difficult to correlate traces, metrics, and logs, and complicates dashboarding, alerting, and automated analysis.
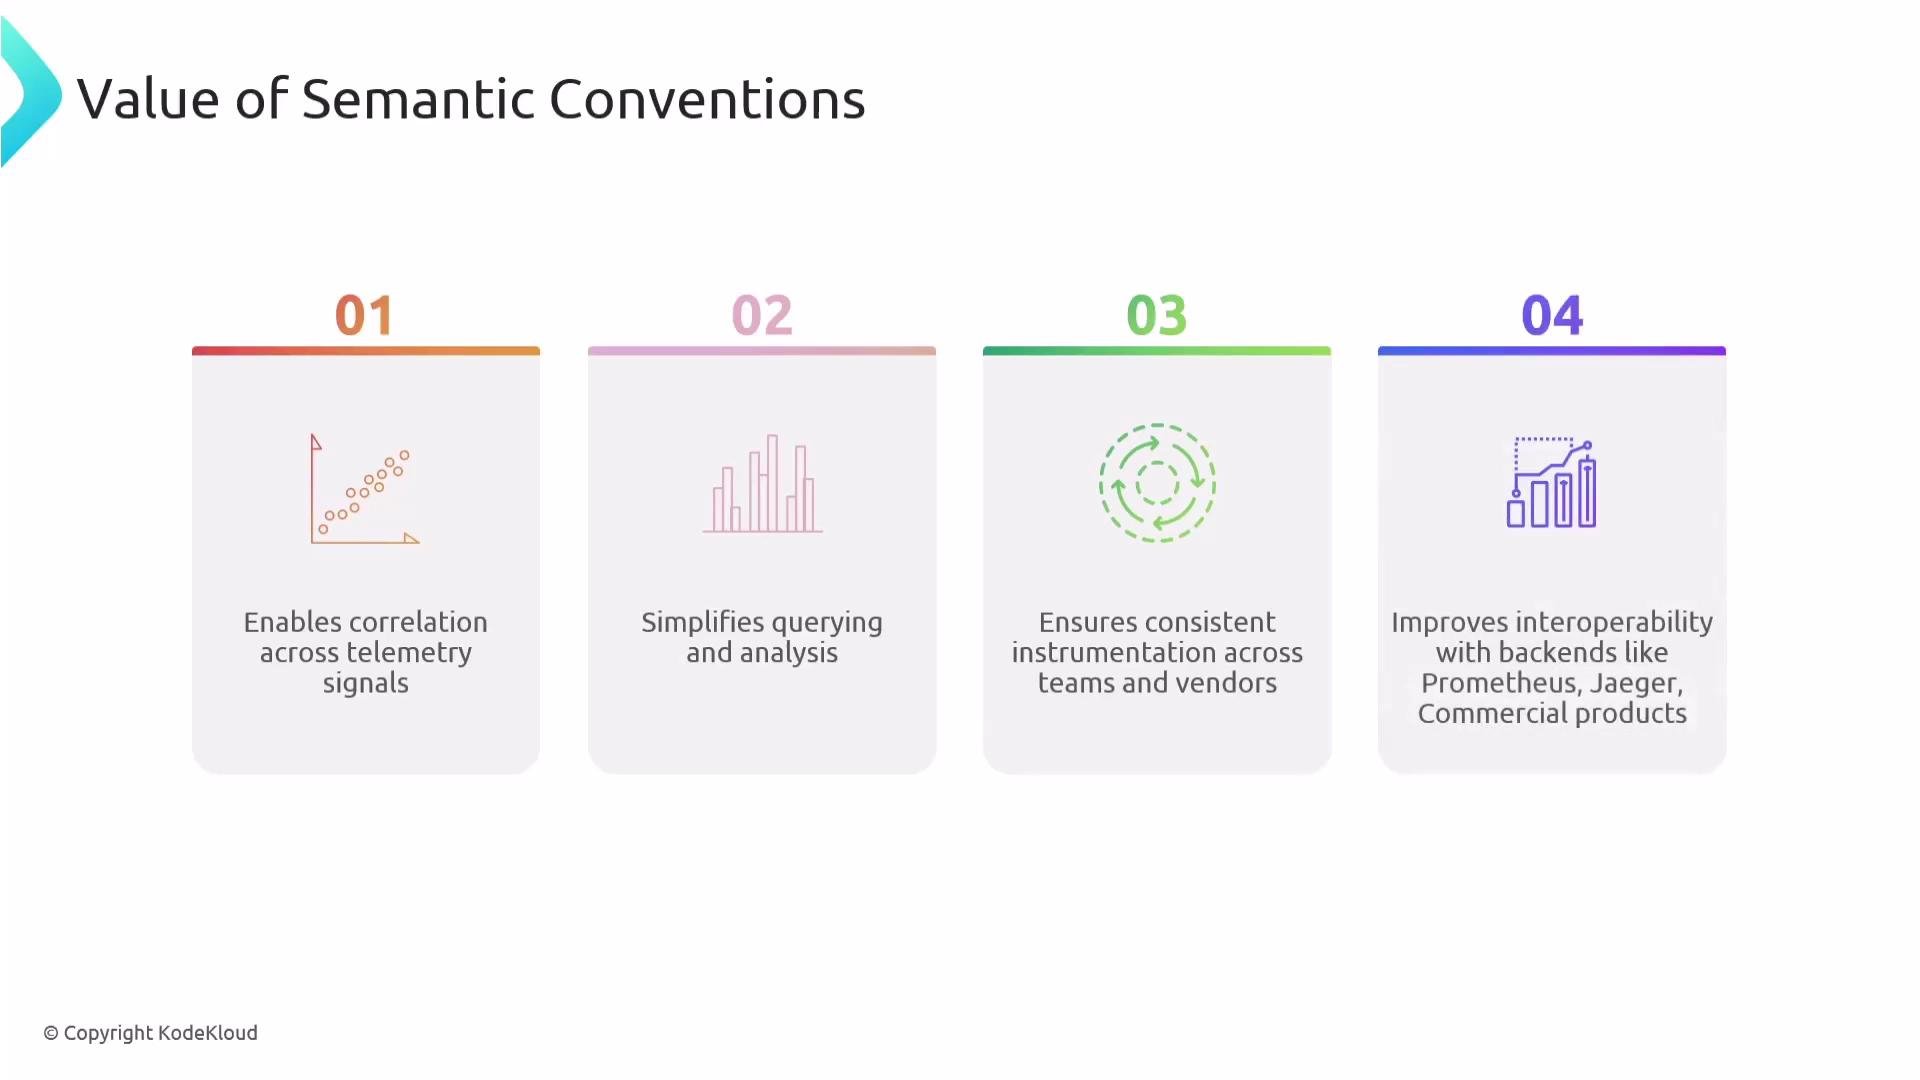
- Enable correlation across telemetry signals (traces, metrics, logs).
- Simplify querying and analysis.
- Ensure consistent instrumentation across teams and vendors.
- Improve interoperability with backends like Prometheus, Jaeger, and commercial observability platforms.
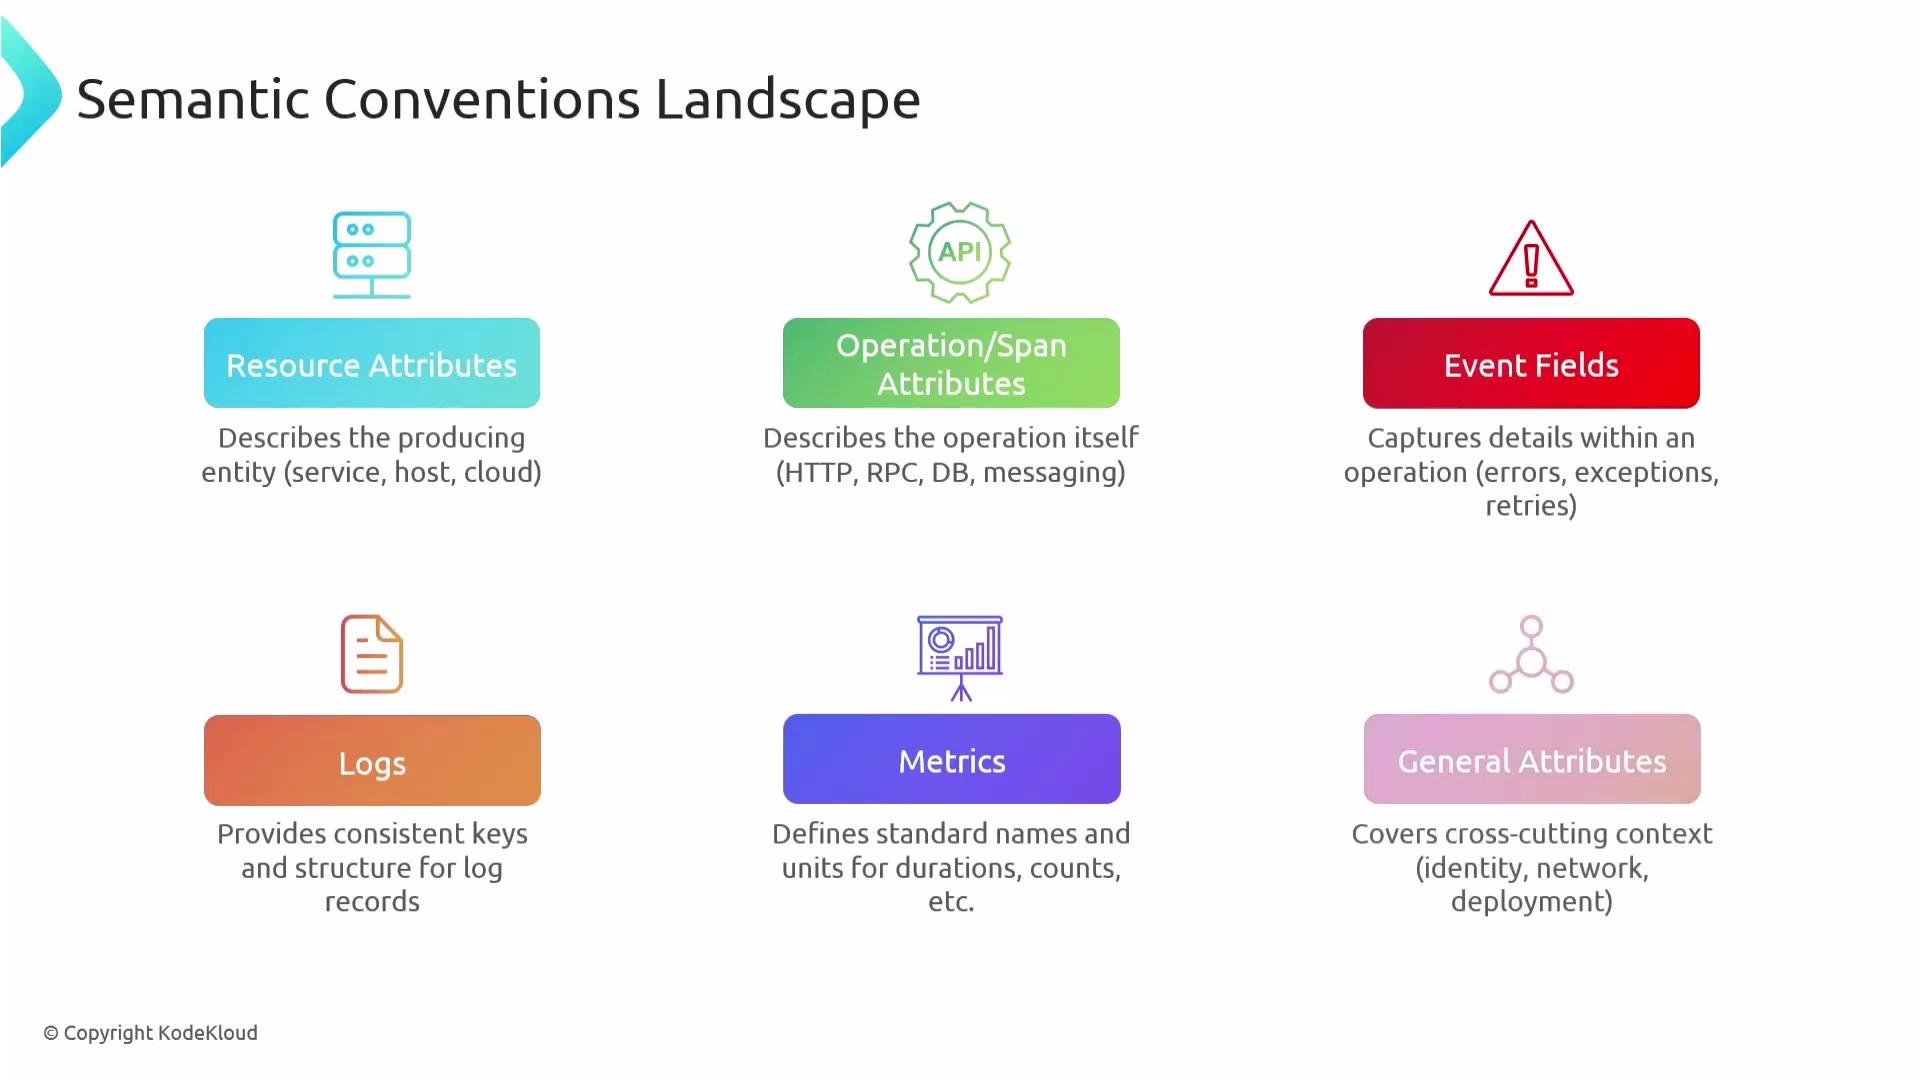
- Resource attributes: describe the entity producing telemetry (hosts, containers, cloud provider, service name).
- Operation/span attributes: HTTP requests/responses, RPCs, database calls, messaging operations.
- Event fields: metadata attached to span events (exceptions, retries, state changes).
- Logs: standardized log fields such as
log.message. - Metrics: recommended metric names and units.
- General attributes: cross-cutting identifiers like trace IDs and span IDs.
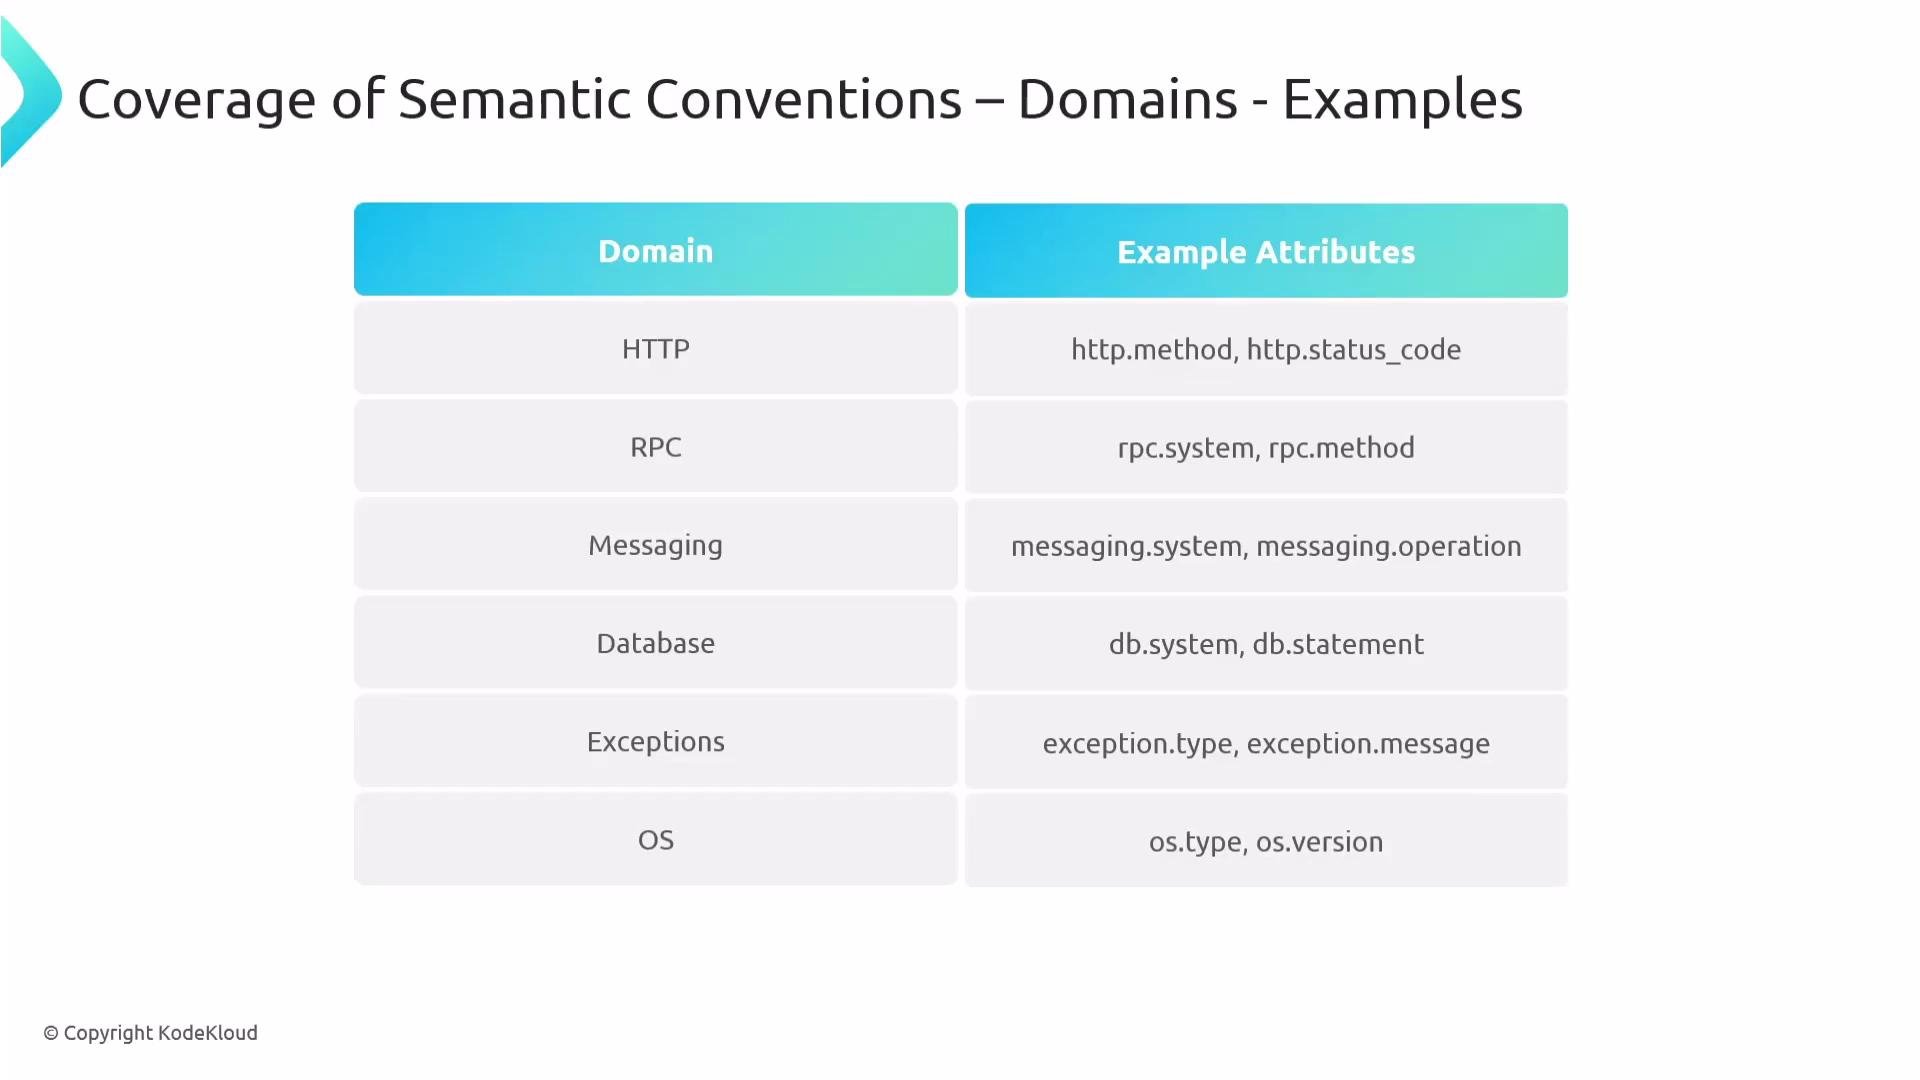
Common domain examples (canonical attribute names)
- HTTP:
http.method,http.status_code - RPC:
rpc.system,rpc.method - Messaging:
messaging.system,messaging.operation - Database:
db.system,db.statement - Exceptions/events:
exception.type,exception.message - Operating system:
os.type,os.version - Cloud:
cloud.provider,cloud.region
enduser.* attributes (for example enduser.id) rather than ad-hoc names like userId.
- OpenTelemetry semantic conventions docs: https://opentelemetry.io/docs/reference/specification/semantic_conventions/
- GitHub repository (semantic_conventions folder): https://github.com/open-telemetry/opentelemetry-specification/tree/main/semantic_conventions
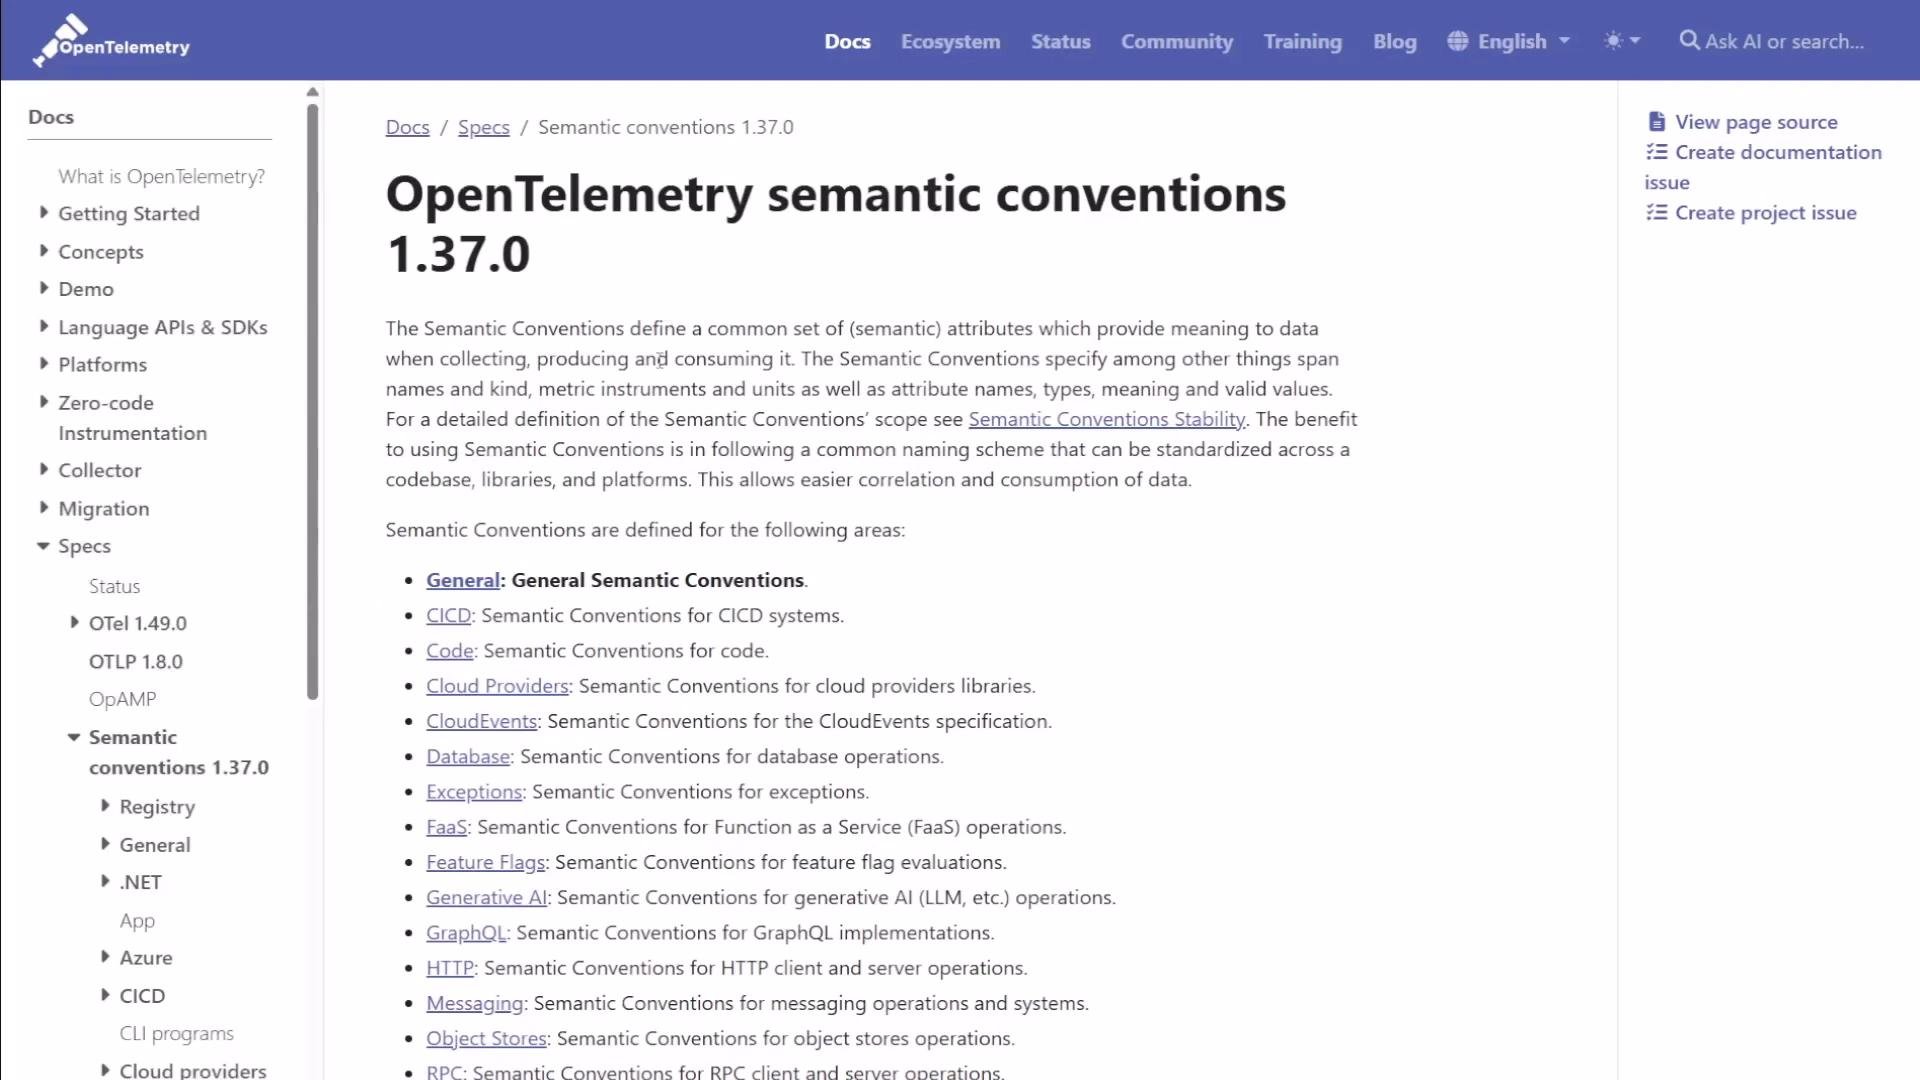
You don’t need to memorize every semantic attribute. Use the official OpenTelemetry instrumentation libraries and consult the semantic conventions documentation when defining custom attributes or manual instrumentation.
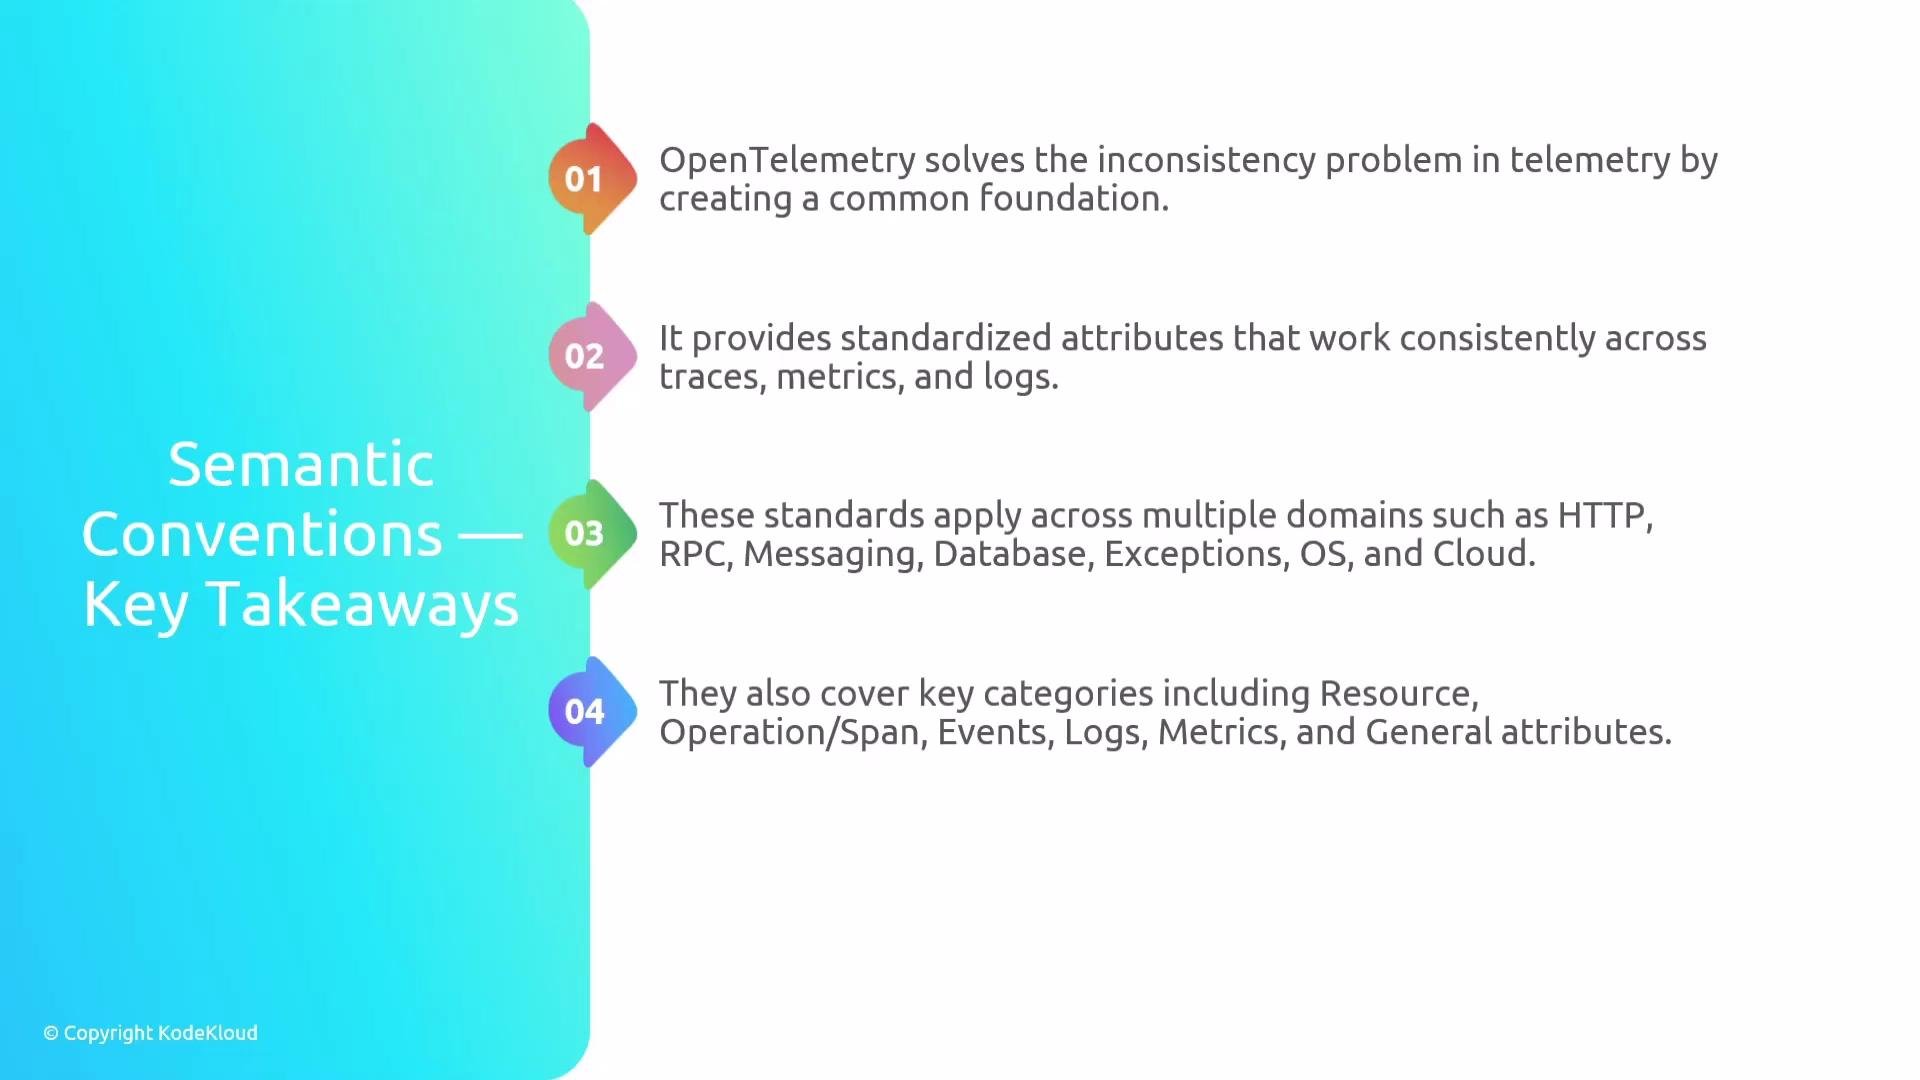
- OpenTelemetry uses semantic conventions to address inconsistent telemetry naming across teams and vendors.
- Semantic conventions standardize attributes across signals (traces, metrics, logs) and domains (HTTP, RPC, messaging, DB, exceptions, cloud, etc.).
- Following these conventions makes correlation reliable, queries simpler, and observability vendor-neutral and easier to maintain.
- OpenTelemetry specification — semantic conventions: https://opentelemetry.io/docs/reference/specification/semantic_conventions/
- OpenTelemetry instrumentation: https://opentelemetry.io/docs/instrumentation/
- OpenTelemetry GitHub — semantic_conventions folder: https://github.com/open-telemetry/opentelemetry-specification/tree/main/semantic_conventions