

UNSET until your application or instrumentation sets it explicitly. When an application crash occurs, instrumentation often marks the span as ERROR automatically. For normal request flows you should explicitly set status to OK for success and ERROR for handled failures.
Spans default to
UNSET. To represent success or failure in traces, explicitly set the span status to OK or ERROR and record relevant attributes like http.status_code.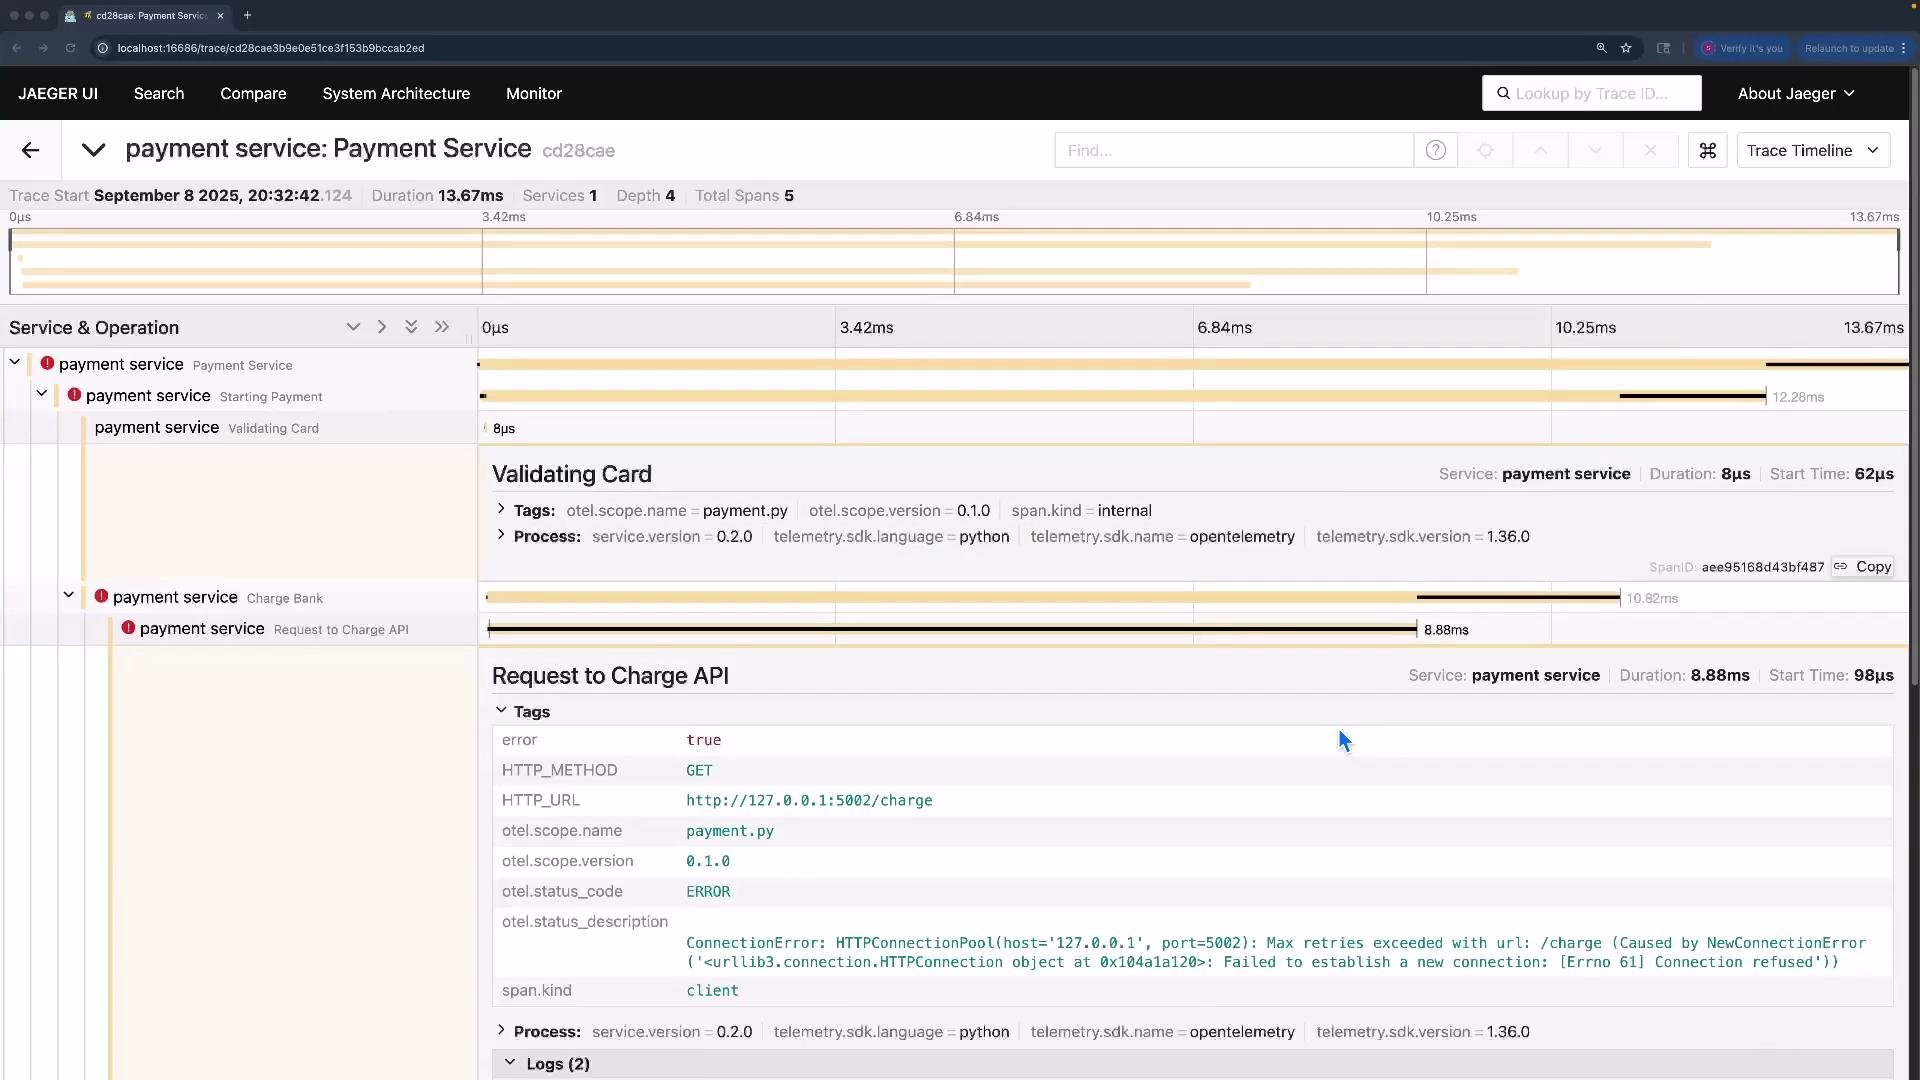
- Communicates high-level outcome of an operation to downstream analysis tools.
- Helps filtering and alerting in tracing backends (errors vs. successful traces).
- Augments other attributes (like
http.status_code) for richer context.
- Add semantic attributes to the span: HTTP method, URL.
- Propagate context (inject headers) before making the request.
- Record events for request lifecycle (sending, sent, received).
- Set
http.status_codeas a span attribute using the HTTP response. - Explicitly set span status to
OKorERRORdepending on the outcome.
- First, configure tracing (tracer provider, resource, and exporter):
- Then use the tracer when making HTTP calls, set attributes, record events, and set status:
Do not rely solely on span status for debugging. Always record attributes like
http.status_code, add meaningful events, and call span.record_exception() when catching exceptions to preserve stack/exception details.- Import and use
StatusandStatusCodefromopentelemetry.traceand callspan.set_status(Status(StatusCode.OK))orspan.set_status(Status(StatusCode.ERROR)). - Recording
http.status_codeas an attribute helps trace UIs and analysis tools provide richer context and filters. - Define your application’s notion of “success”—for example, some APIs return 404 or 409 in normal flows; you may decide to mark those as
OKin specific contexts. - Always propagate context (
inject) for distributed traces so downstream services are linked.
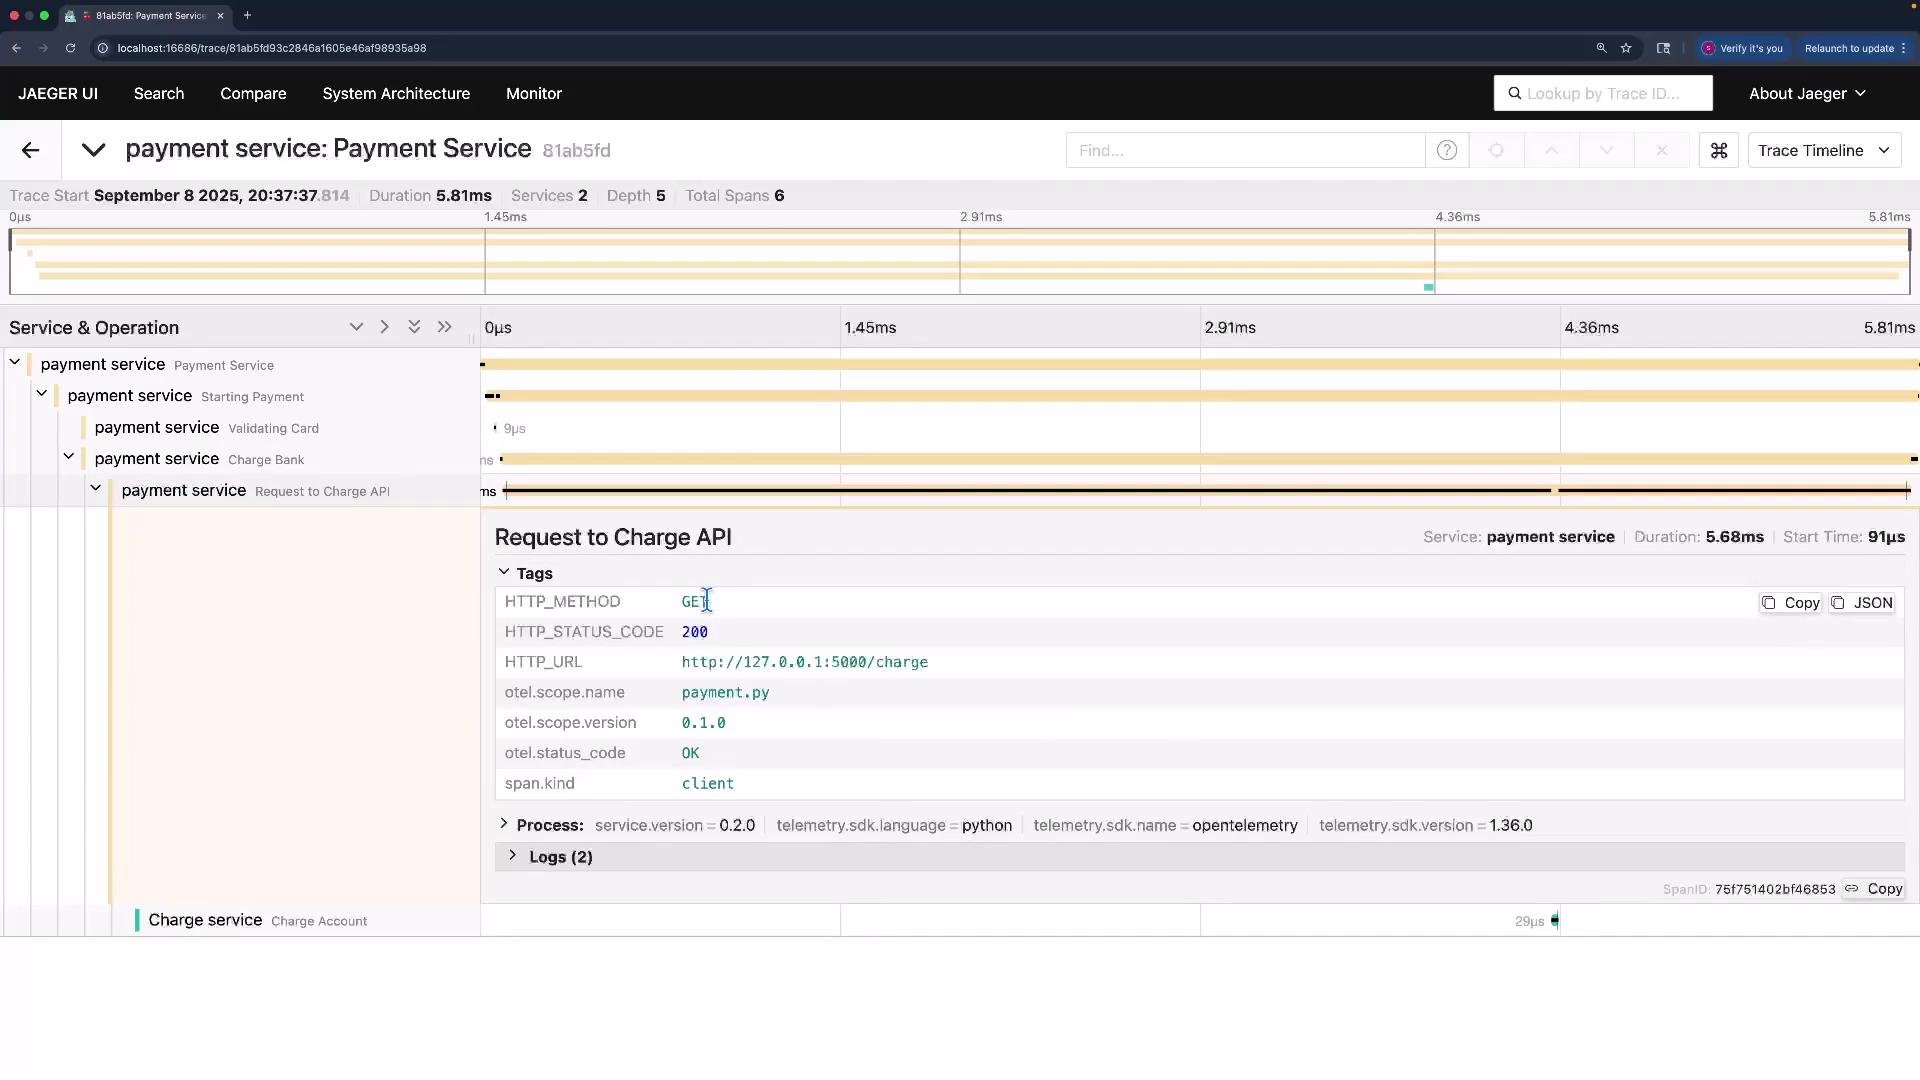
OK. The Jaeger UI for that trace is shown below (image preserved from original content):
- OpenTelemetry: https://opentelemetry.io/
- Jaeger Tracing: https://www.jaegertracing.io/
- OpenTelemetry semantic conventions (HTTP): https://opentelemetry.io/docs/reference/specification/trace/semantic_conventions/http/