

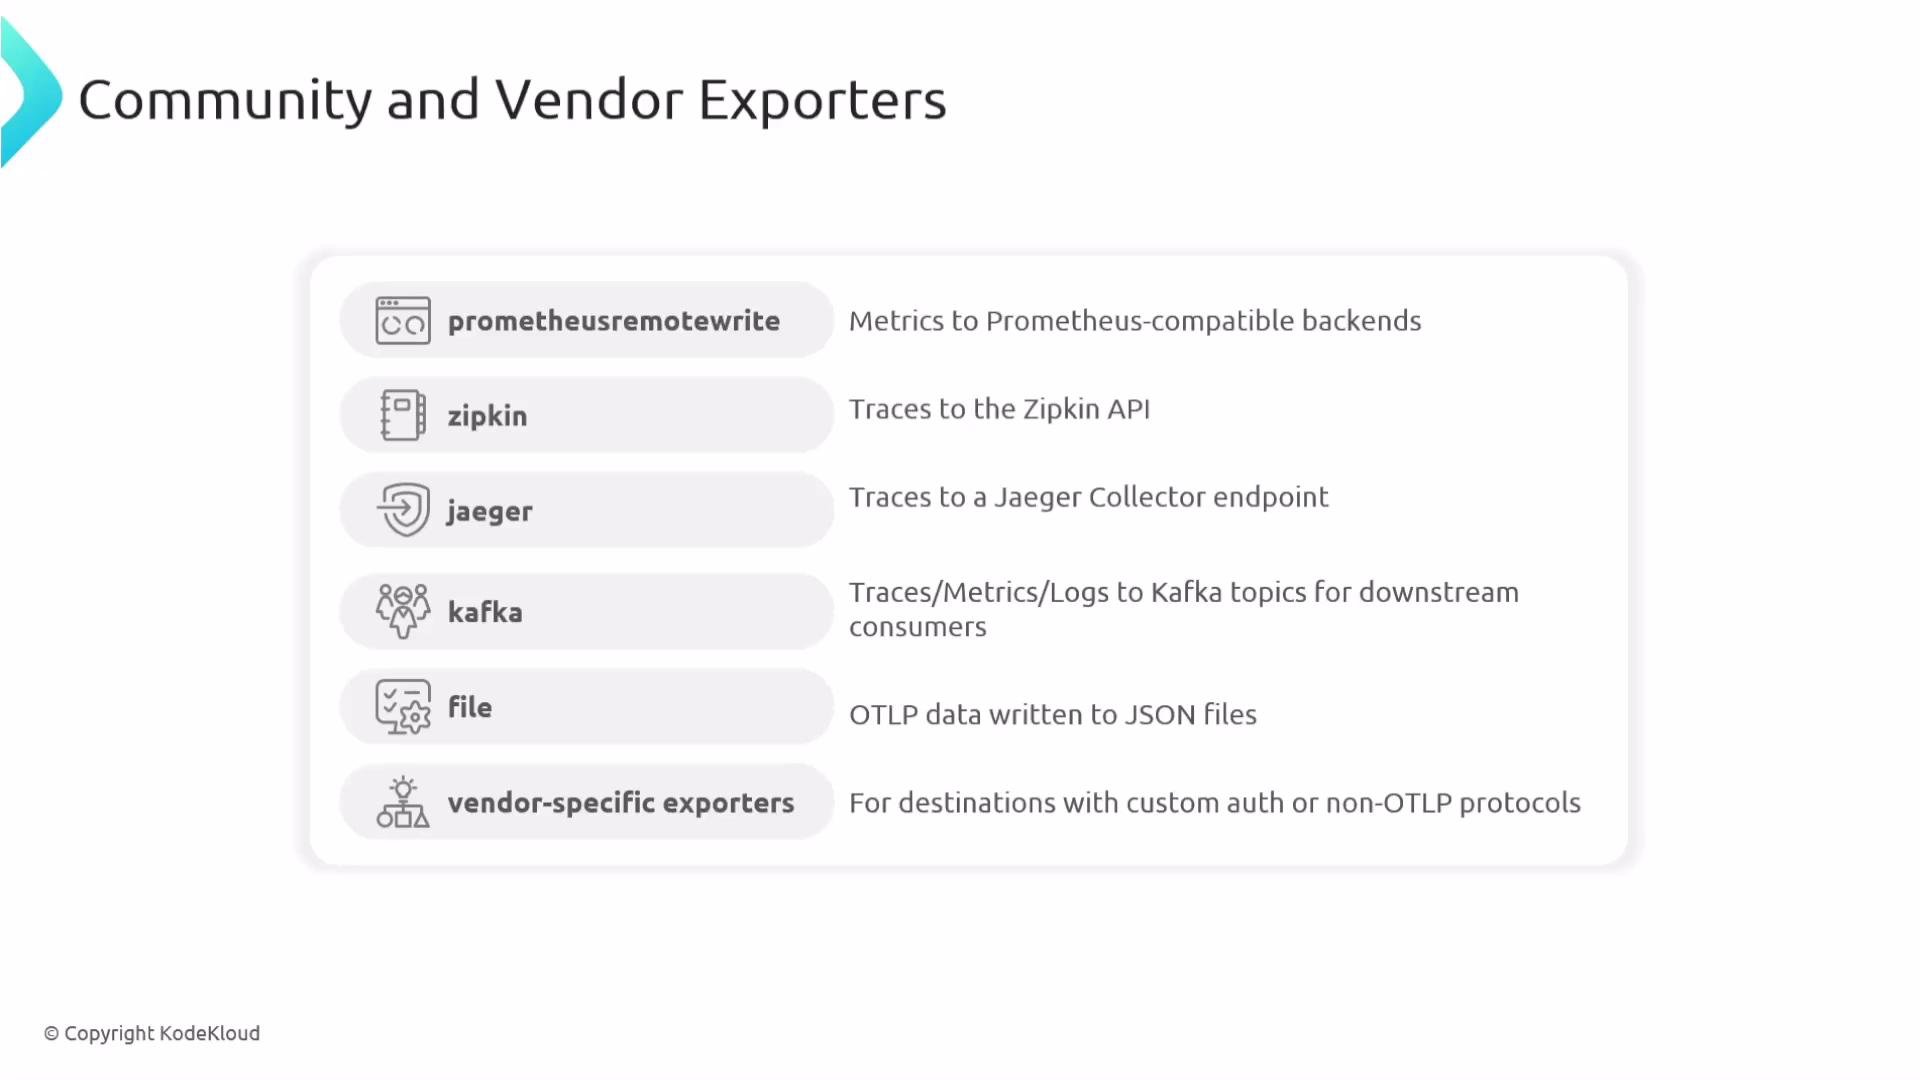
Check the OpenTelemetry Collector contrib repository for a complete list of exporters and examples: https://github.com/open-telemetry/opentelemetry-collector-contrib. There are many vendor and community exporters beyond the ones shown here.
Prometheus exporter
The Prometheus exporter exposes an HTTP endpoint from the Collector so a Prometheus server can scrape metrics directly. Configure listening endpoint, metric namespace, and constant labels to integrate seamlessly with an existing Prometheus stack. When to use:- You run Prometheus as the primary metrics scraper.
- You want Prometheus/Grafana to scrape metrics directly from the Collector rather than using a push model.
Prometheus Remote Write exporter
The Prometheus Remote Write exporter converts OTLP metrics into Prometheus Remote Write format and pushes them to a remote backend (for example, Cortex or Thanos). Use this when you need centralized, long-term metrics storage or to offload historical metrics to a remote store. When to use:- Centralized storage and long-term retention are required.
- You want to run PromQL over a remote store.
rate(http_requests_total[5m])) and visualize with Grafana or use alerting rules as usual.
Jaeger exporter
The Jaeger exporter converts OTLP spans to Jaeger’s native format and sends them to a Jaeger collector (gRPC or HTTP). This is helpful for organizations that already use Jaeger for trace visualization or are migrating to OTLP. Example configuration:Zipkin exporter
The Zipkin exporter sends spans to a Zipkin backend over HTTP and supports JSON or Protobuf encodings to maintain compatibility with different Zipkin receivers and versions. Example configuration:Using multiple trace exporters
The Collector can deliver the same traces to multiple exporters in parallel. This is useful for gradual migrations, duplicating traces to different backends, or mixing SaaS and self-hosted observability. Example — send traces to both Zipkin and Jaeger:Kafka exporter
The Kafka exporter forwards telemetry to Kafka topics and supports per-signal topics (traces, metrics, logs), encoding options, partitioning, and authentication/TLS settings. Kafka is a good fit for large-scale, decoupled pipelines where multiple downstream consumers process raw OTLP payloads. When to use:- You need durable, scalable streaming of telemetry.
- Downstream consumers expect telemetry on Kafka topics (e.g., for enrichment, storage, or reprocessing).
Do not hard-code secrets (for example,
KAFKA_PASSWORD) directly in Collector YAML. Use environment variables, secret mounts, or your orchestration platform’s secret management to protect sensitive credentials.File exporter
The file exporter writes telemetry to local files (commonly OTLP JSON). This exporter is useful for debugging, snapshots, or offline analysis when no remote backend is available. File rotation parameters help manage disk usage. Example configuration:Vendor-specific exporters
Many observability vendors provide custom exporters that implement proprietary protocols, required authentication, or additional features (for example, API keys, custom headers, or non-OTLP encodings). Use vendor exporters when integrating with a managed backend to ensure compatibility and to leverage vendor-specific optimizations. When to use:- A vendor-managed backend requires a specific protocol or authentication method.
- You want to use vendor-supported features like enhanced metadata enrichment, sampling controls, or billing-aware routing.
Closing notes
- Choose exporters that match your backend and operational model (scrape vs push, long-term storage, streaming).
- Use
batchandretryprocessors to improve reliability and reduce network overhead. - Keep secrets out of config files — use environment variables or secret mounts.
- For examples and a comprehensive list of exporters, consult the OpenTelemetry Collector contrib repository: https://github.com/open-telemetry/opentelemetry-collector-contrib
- OpenTelemetry Collector contrib repository: https://github.com/open-telemetry/opentelemetry-collector-contrib
- Prometheus: https://prometheus.io/
- PromQL basics: https://prometheus.io/docs/prometheus/latest/querying/basics/
- Cortex: https://cortexmetrics.io/
- Thanos: https://thanos.io/
- Kafka: https://kafka.apache.org/