Hello, curious tracers. This lesson focuses on one of observability’s most powerful tools: distributed tracing. You’ll learn the core concepts required to instrument and reason about distributed systems—traces, spans, context propagation, and baggage—and how they combine to reveal a request’s journey across services. By the end of this lesson you will be able to:
  • Define traces and spans and how they relate.
  • Read a waterfall trace to identify latency and errors.
  • Understand root spans, parent/child relationships, and context propagation.
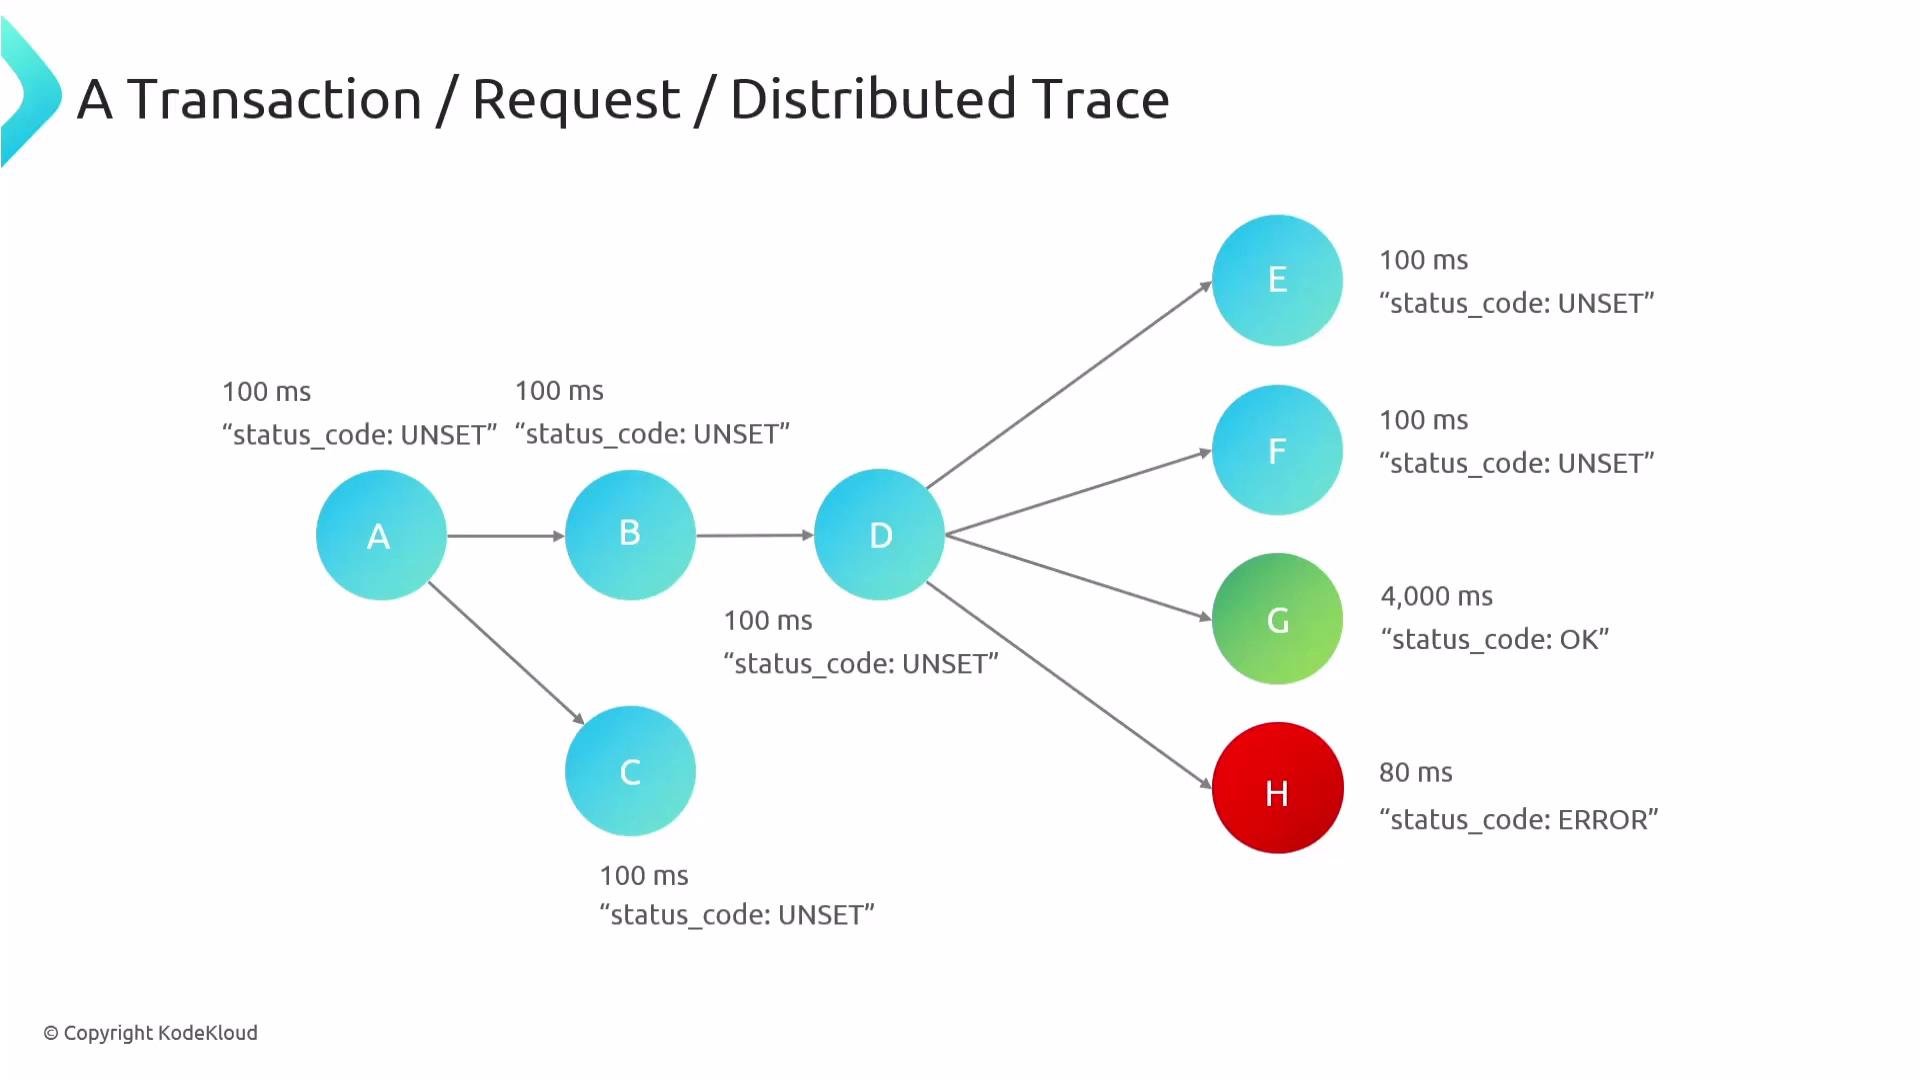
What is a distributed trace? Modern applications are built from many collaborating services. A single user request frequently traverses multiple services before completion. Distributed tracing (often simply “tracing”) captures that end-to-end flow by linking units of work (spans) across process and network boundaries so you can observe the full path and timing of a transaction. This diagram shows a multi-service distributed system and the path a request takes through nodes A–H. It highlights where time was spent and where an error occurred.
The image is a diagram illustrating a distributed trace of a transaction or request, showing a sequence of nodes labeled A to H with various status codes and response times. Node H is marked with an error status, while other nodes have unset or OK status codes.
How to read that diagram
  • Each box corresponds to a span, a single unit of work performed by a service.
  • Some spans include explicit statuses like OK or Error; many remain Unset (meaning no explicit status recorded).
  • An Error status pinpoints where failures happened during the transaction.
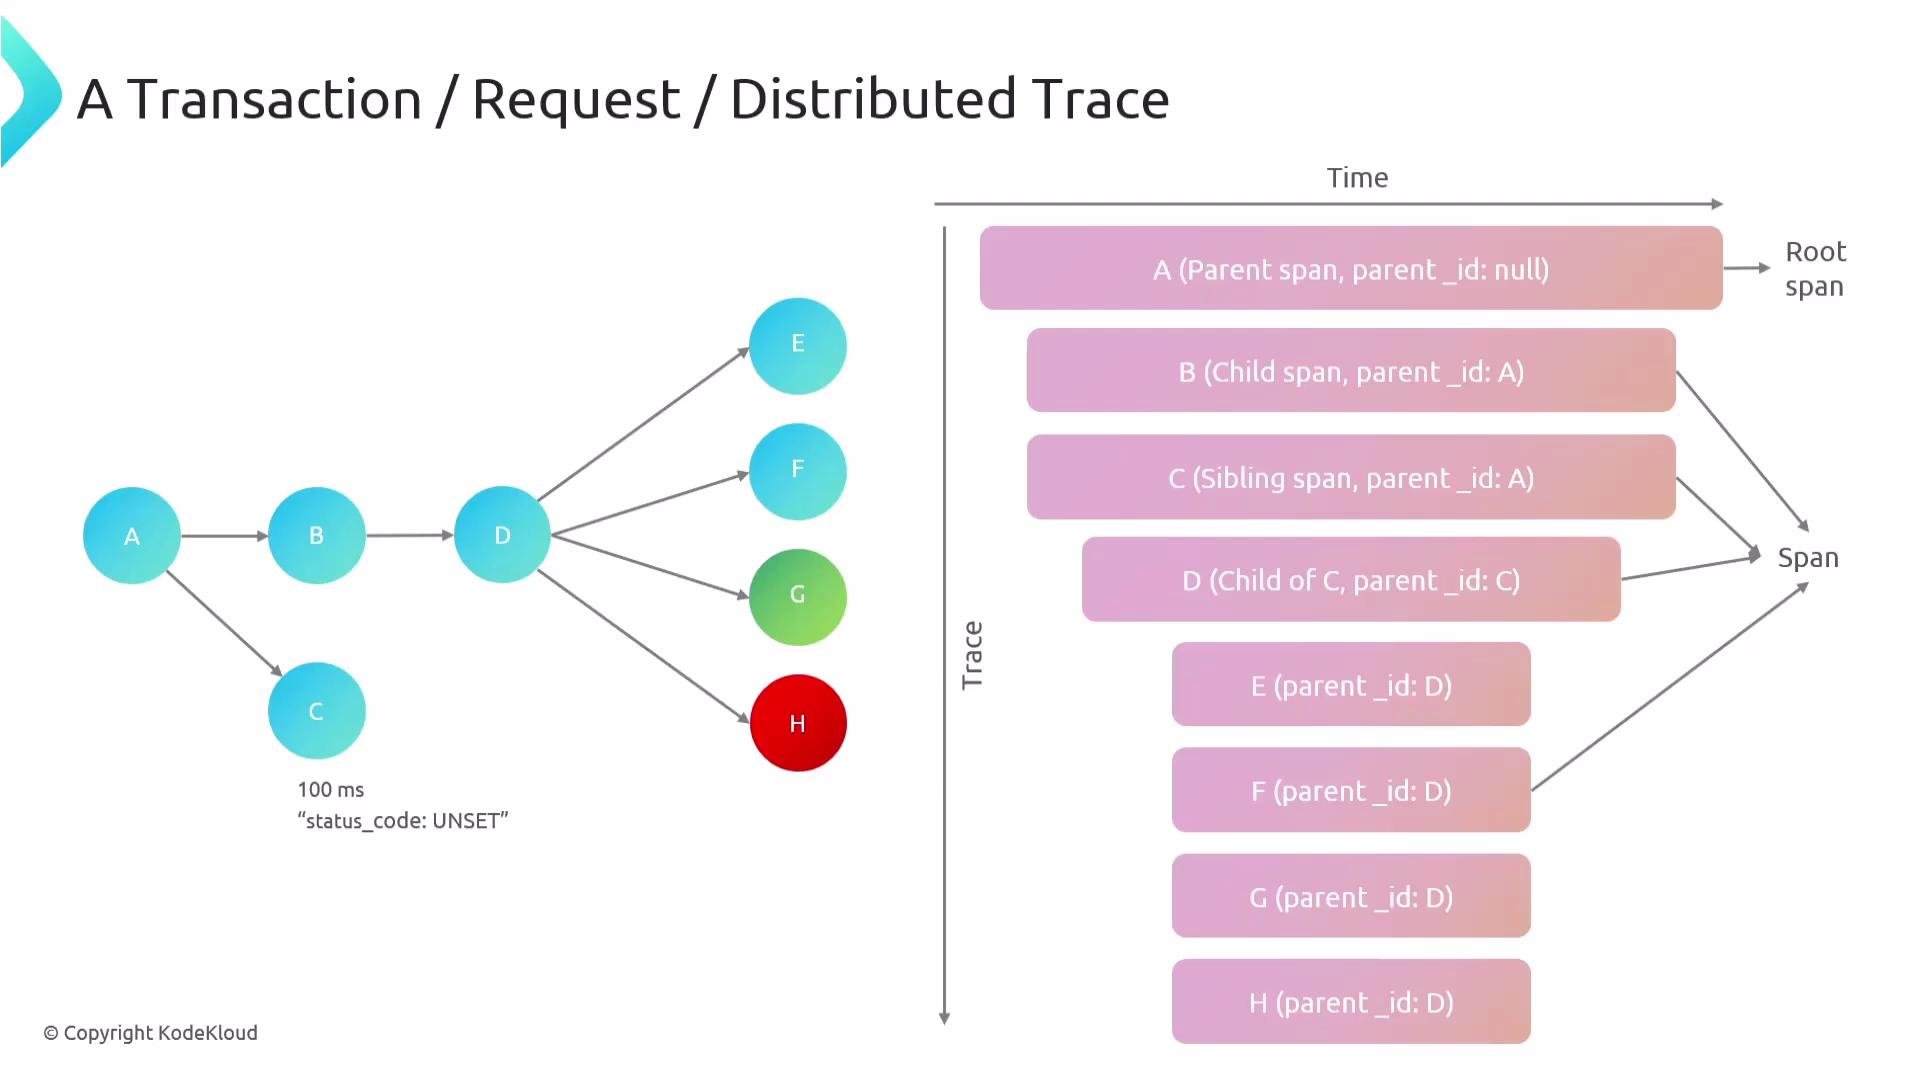
Zooming into a single request flow A trace is the collection of spans created while processing a single request. Consider a typical e-commerce flow: the frontend receives a customer action, calls the product catalog, which triggers the checkout service; checkout then invokes payment and shipping. The trace stitches together all spans so you can view the path and timing for each operation. On the right side of the next diagram the same request is shown as a waterfall timeline: the x-axis represents elapsed time and the y-axis shows the hierarchical relationships of spans (parent → child → sibling).
The image illustrates a distributed trace of a transaction or request, showing a visual diagram of spans and a timeline, detailing the relationships and hierarchies between various components labeled A to H.
Key observations from the waterfall view:
  • The root span has no parent (parent ID = null).
  • Each downstream call creates a child span; sibling spans share the same parent.
  • Bar length represents duration; nesting shows sequence and dependency.
What is a span? A span is the fundamental unit of work in tracing. It typically represents a single operation such as:
  • handling an inbound HTTP request,
  • executing a database query,
  • or calling another service.
A span records:
  • start time and end time (so you can measure duration),
  • a status (e.g., Unset, Ok, Error as defined by OpenTelemetry),
  • attributes/metadata (for example, HTTP status code, method, URL, database statement).
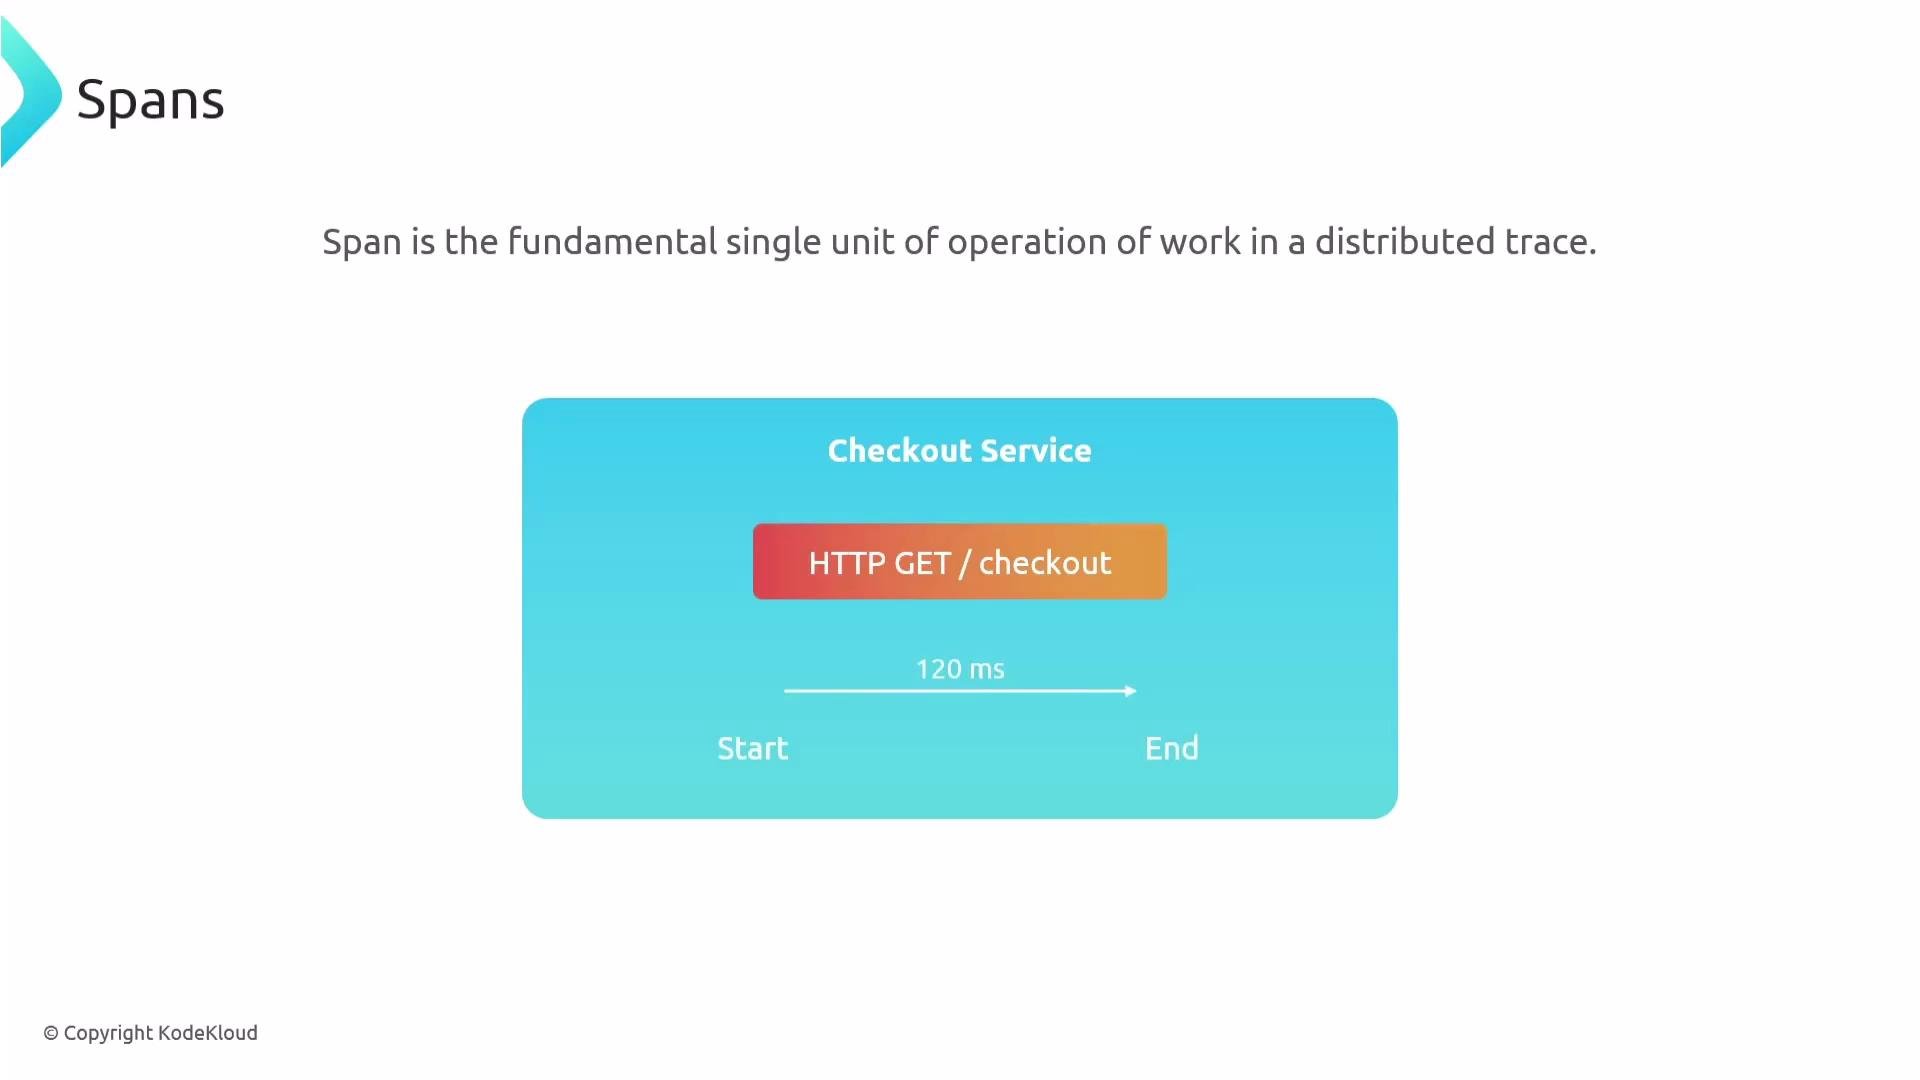
The image illustrates the concept of a "span," showing it as the fundamental unit of operation in a distributed trace, with an example of a checkout service HTTP GET request lasting 120 milliseconds.
Practical example: an e-commerce checkout trace Mapping spans to a typical checkout flow:
  • The frontend span is the root span that starts when the customer action occurs.
  • The frontend creates a child span for the checkout service.
  • The checkout service creates additional child spans for payment, shipping, preparing order items, and querying the cart.
  • Each span logs start/end times and status, making it straightforward to identify which service caused latency or errors.
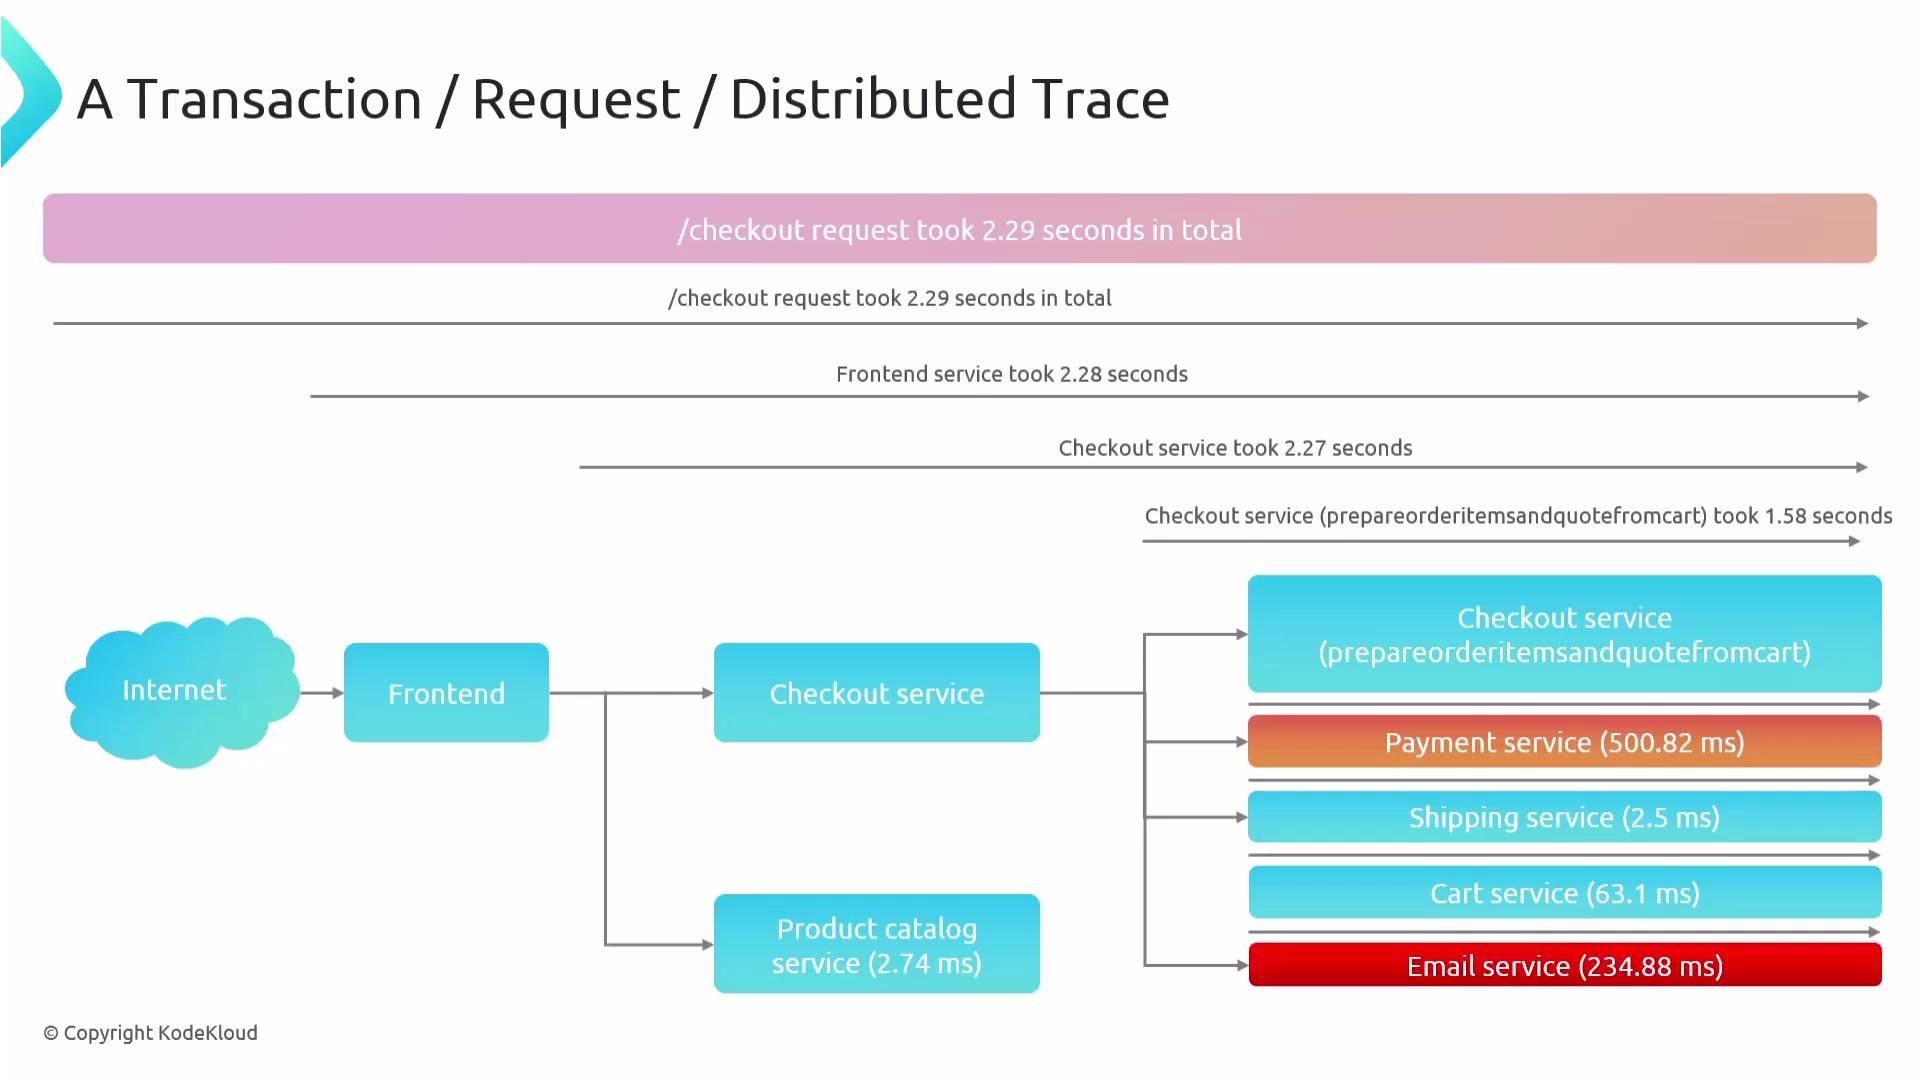
The waterfall below visualizes the checkout transaction and per-service durations, allowing quick identification of bottlenecks and failures.
The image shows a transaction trace for a checkout request, detailing the sequence and duration of operations across different services like frontend, checkout, payment, shipping, cart, and email. The total time for the request is 2.29 seconds, with individual service times also indicated.
What this example reveals
  • Total checkout latency: ~2.29 seconds.
  • The checkout service accounts for most of the latency (~2.27 seconds).
  • The email service reports an error—this flags where to investigate for remediation.
Note about parent IDs and root spans:
A span with a null parent ID is the trace’s root span. Context propagation (trace and span IDs passed across network calls) ties child spans back to their parents so the full distributed trace can be reconstructed across services.
Glossary and quick reference
TermMeaningExample fields
TraceA complete end-to-end recording of a request across systemstrace_id, spans[]
SpanSingle unit of work within a tracespan_id, parent_id, start_time, end_time, status, attributes
Root spanThe top-level span with no parentparent_id = null
Context propagationMechanism to carry trace/span IDs across process/network boundariesHTTP headers like traceparent
BaggageSmall pieces of user-defined context propagated with the tracebaggage: { "user-plan": "gold" }
Why tracing matters (summary)
  • Distributed traces reveal the full journey of a request across services, hosts, and processes.
  • Traces connect spans to show where time is spent and where failures occur.
  • Spans include timing, status, and attributes that make performance and error analysis actionable.
  • Hierarchical span structure (root → children → siblings) models causal relationships.
  • Status values help distinguish success (Ok), failure (Error), and unknown (Unset).
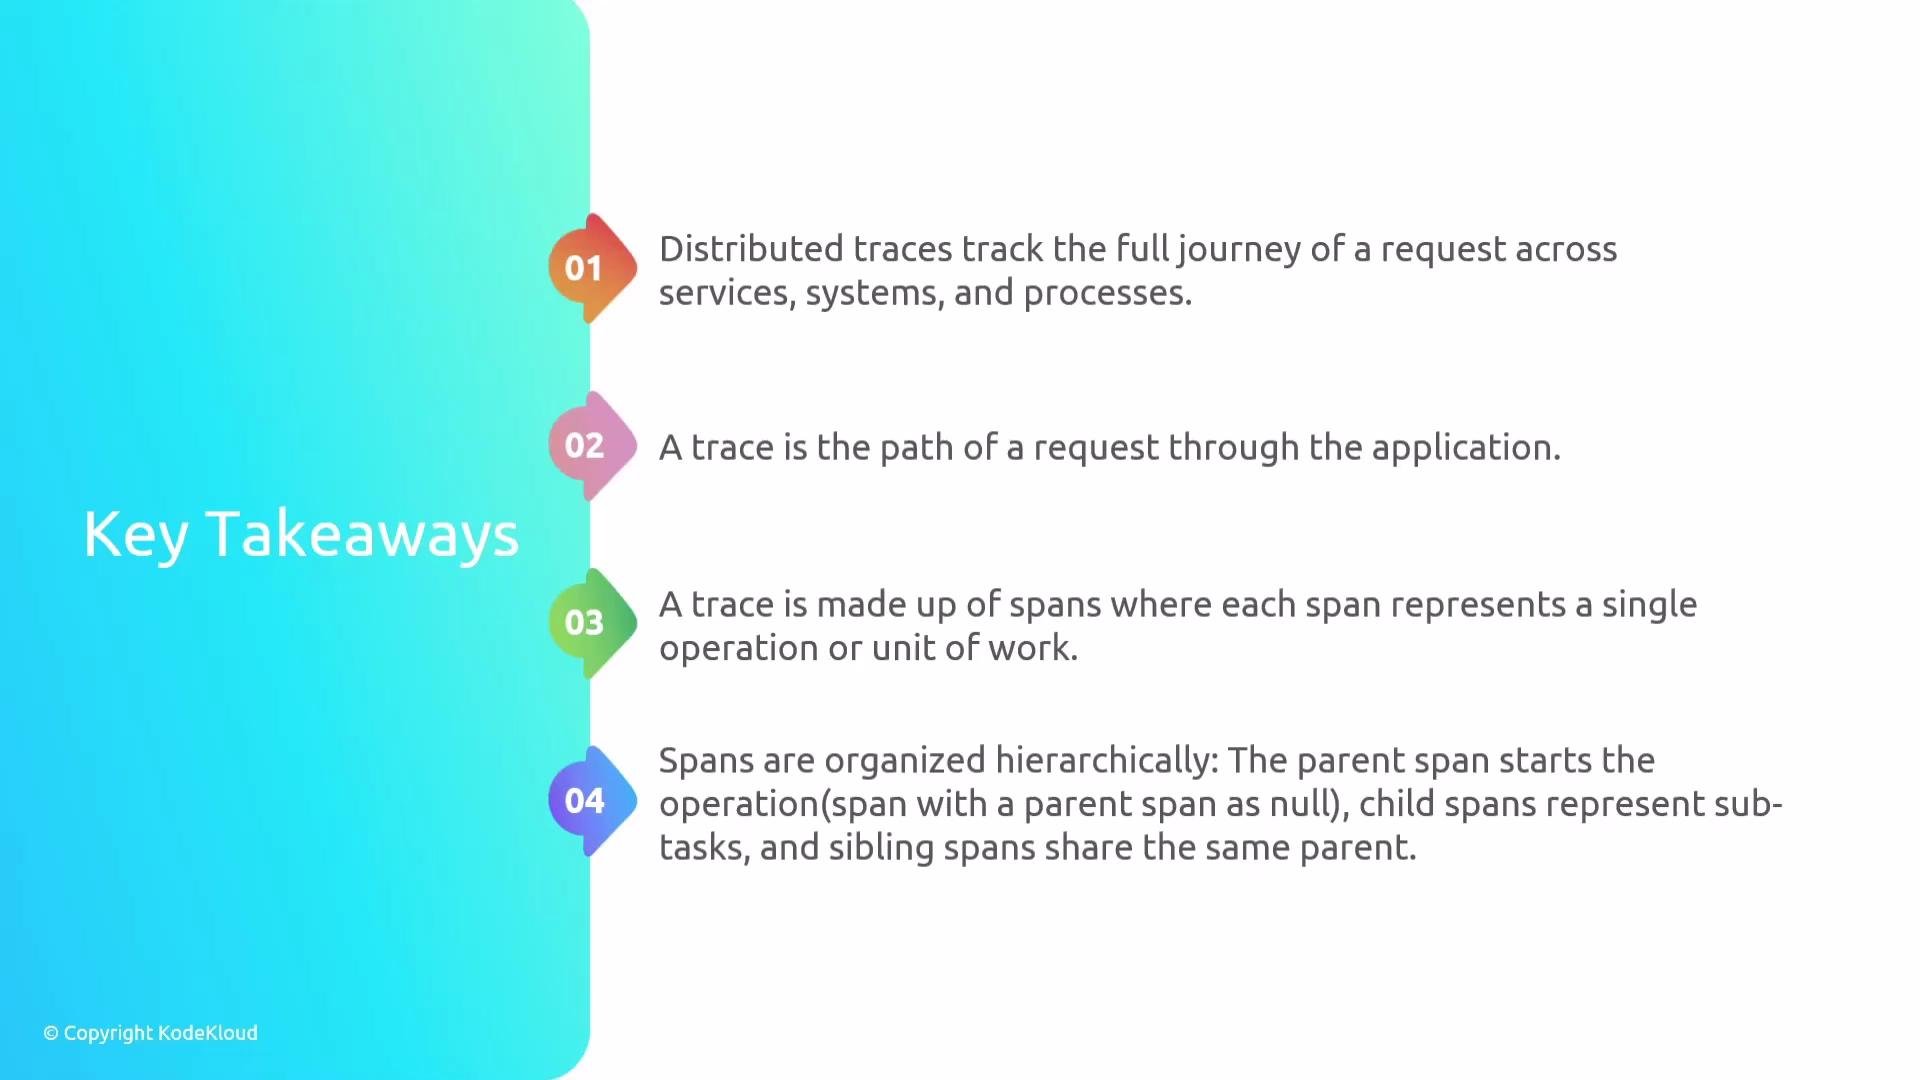
The image is an infographic titled "Key Takeaways," outlining four points about distributed traces, traces, spans, and their hierarchical organization in applications. It includes colorful numbered labels for each point.
The image shows a presentation slide titled "Key Takeaways" with points on span status indicating success or failure and tracing providing visibility into system issues.
Further reading and references

Watch Video