A concise guide for developers and architects explaining why OpenTelemetry (OTel) clients are structured the way they are. This article focuses on the design intent behind language-specific OTel libraries (the “client” you install in your application), how the API/SDK separation works, and how clients fit into an observability ecosystem.

What we mean by “client”

When we say “client” we mean the language-specific OpenTelemetry library embedded in your application (for example, the Python, Java, or JavaScript OTel packages). The client is responsible for enabling your code to generate telemetry (traces, metrics, logs) and typically exposes a stable API while delegating runtime behavior to a pluggable SDK. Quick example (Python):
This article explains why clients are designed this way so you can use them safely and extend them when needed.

Core design goals

OpenTelemetry clients are designed around three high-level principles:
  • Easy to use — minimal effort required to add telemetry to applications.
  • Uniform — consistent APIs across languages to reduce cognitive load for adopters.
  • Flexible — support a variety of runtime use cases and backends.
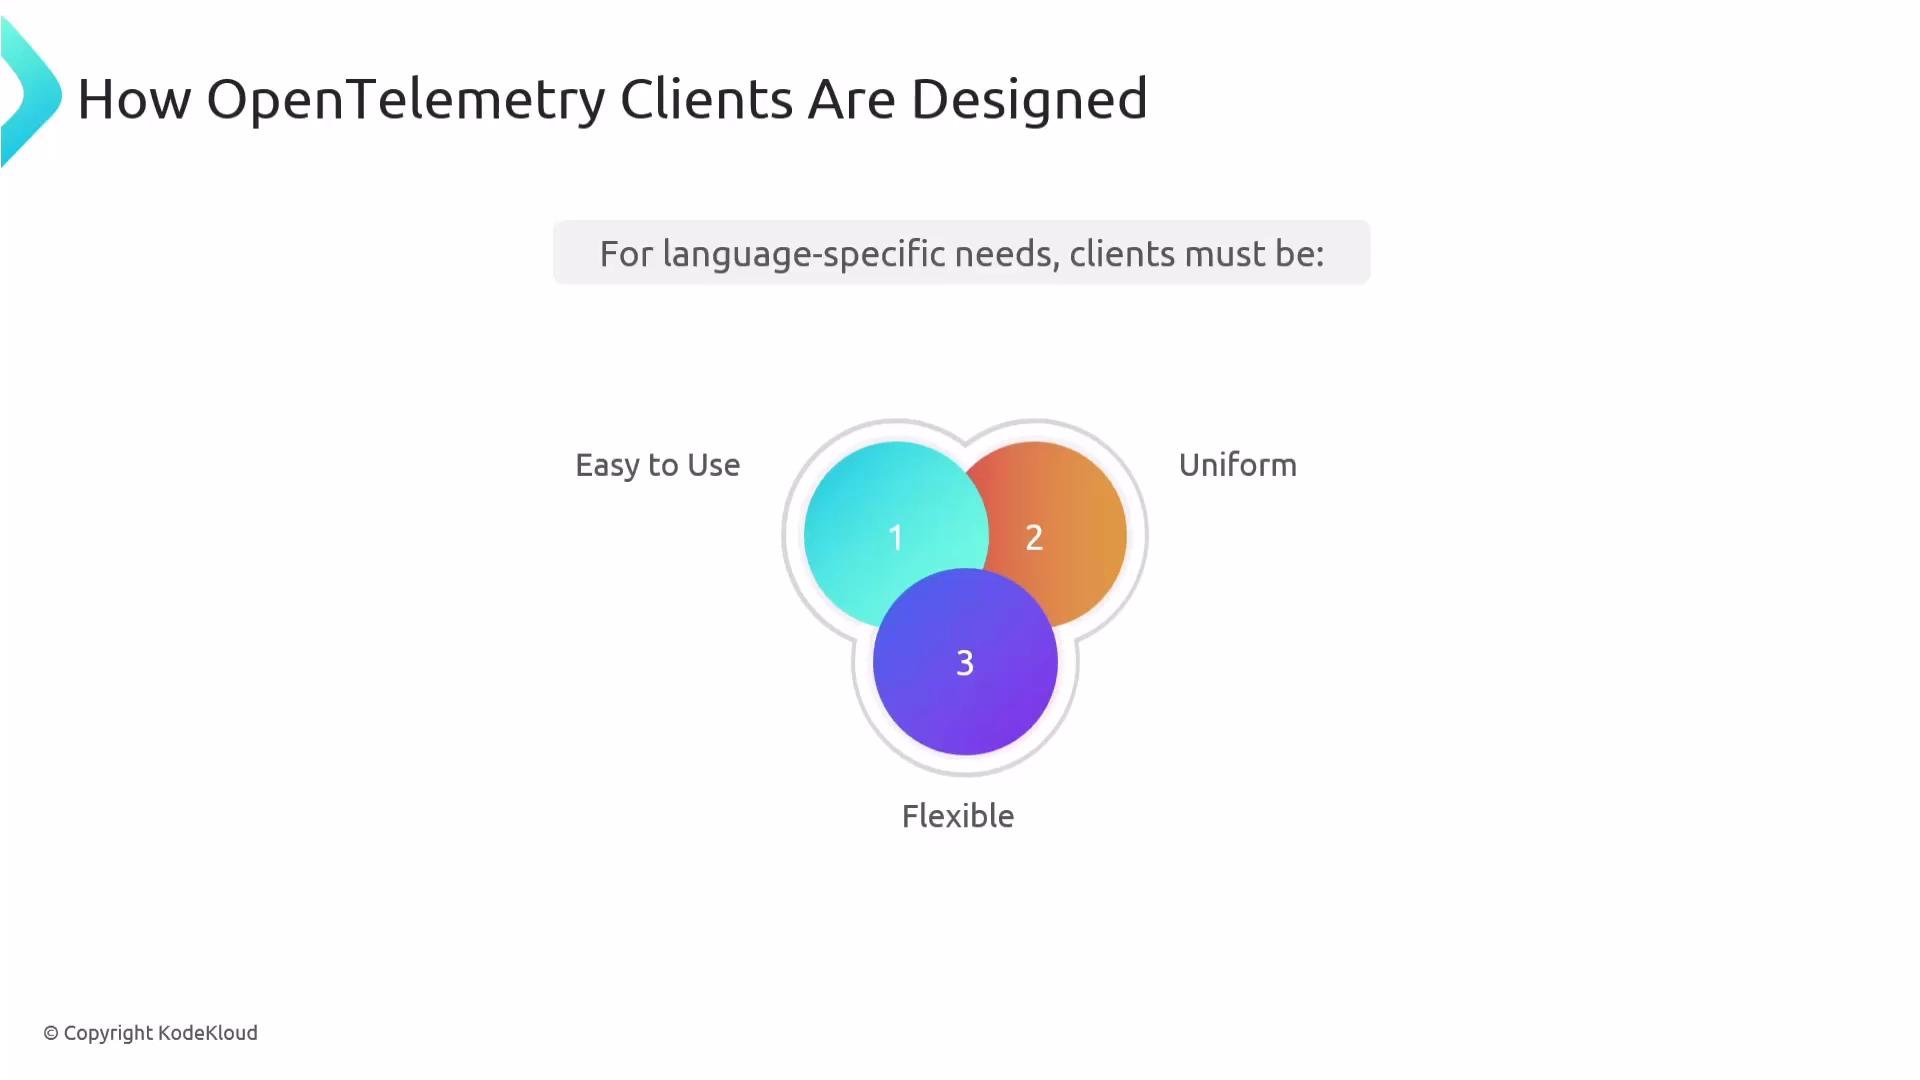
The image illustrates the design principles for OpenTelemetry clients, highlighting that they must be easy to use, uniform, and flexible, represented in a Venn diagram.
Clients aim to deliver two practical capabilities:
  • Full features out of the box — basic telemetry generation, batching, and export should work without custom implementation.
  • Extensibility — you can customize exporters, sampling, processors, and experiment safely without touching core behavior.
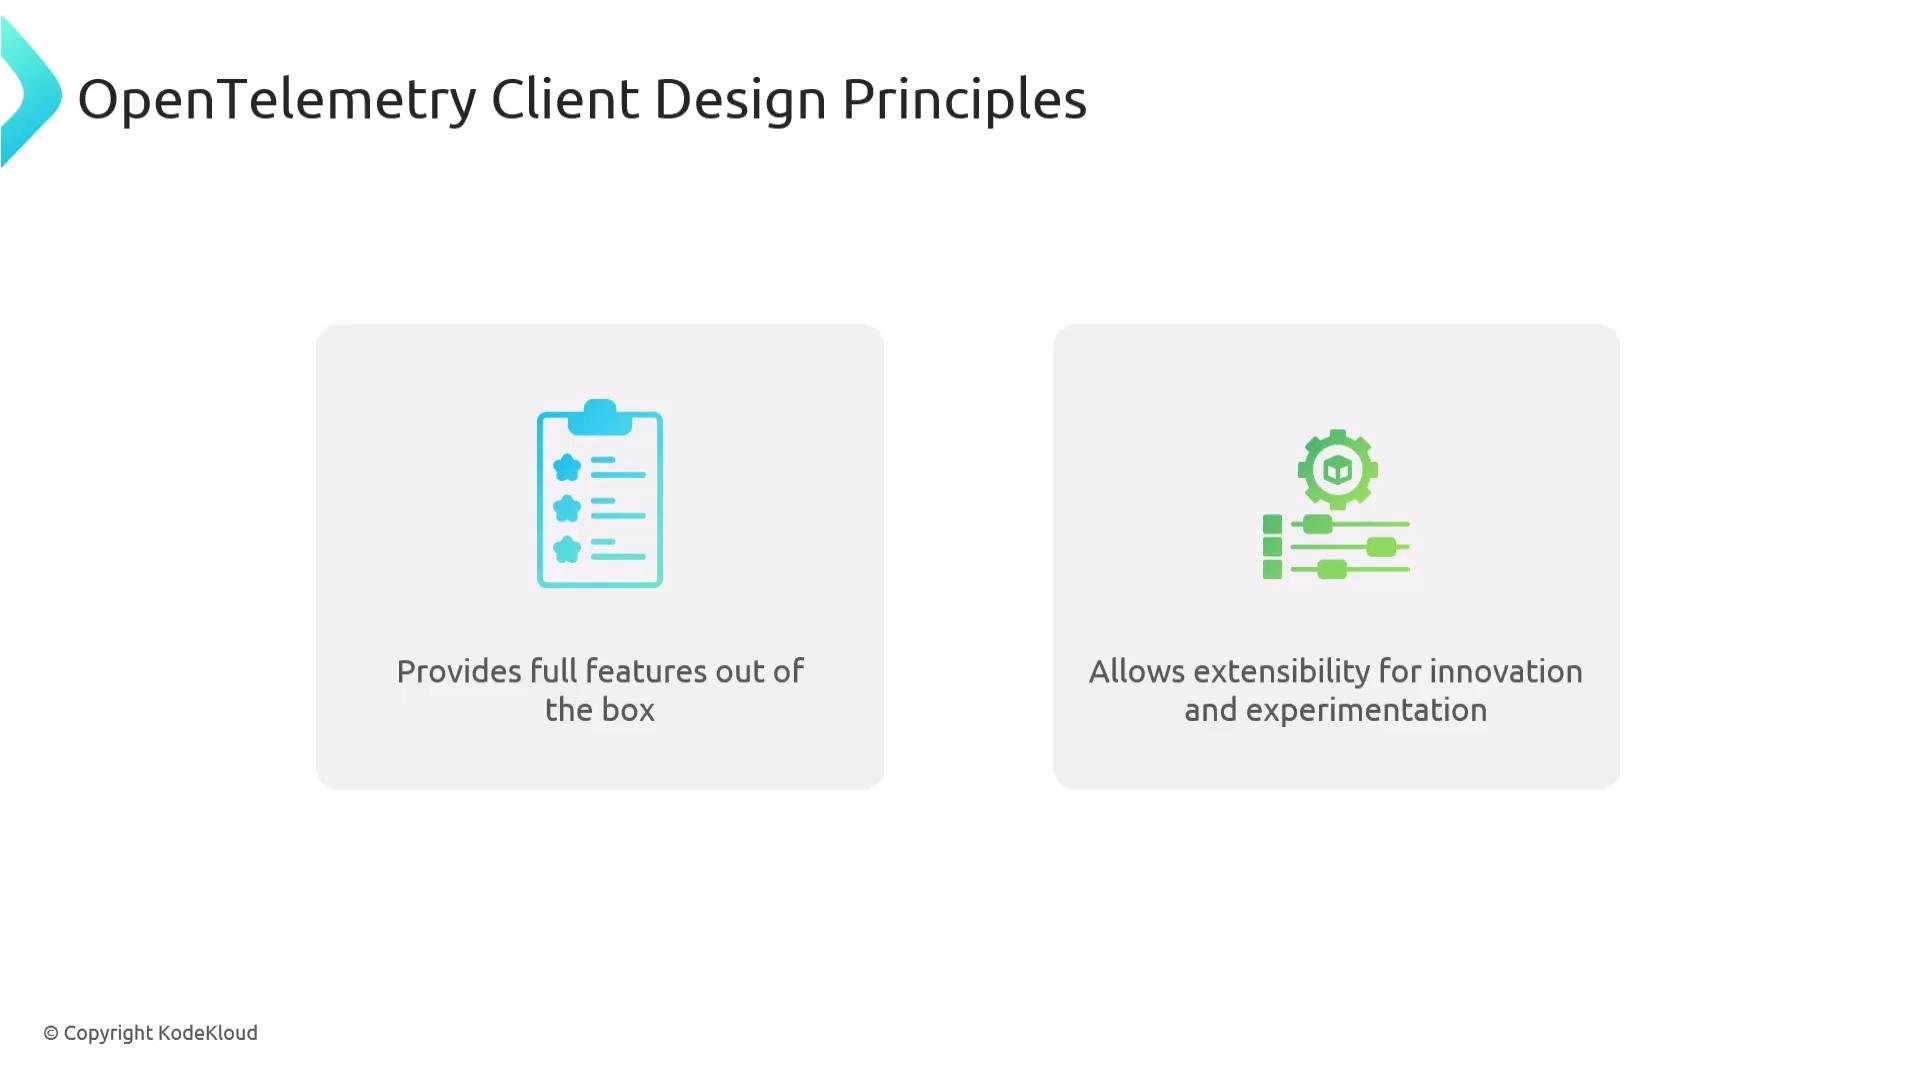
The image outlines OpenTelemetry Client Design Principles, highlighting full features availability and support for extensibility to foster innovation and experimentation.

API vs SDK — the fundamental separation

The OpenTelemetry specification enforces a clear separation of concerns:
  • API: stable, language-level interfaces used by instrumentations and application code to generate telemetry.
  • SDK: the pluggable runtime that implements sampling, processing, batching, and exporting.
Key requirements driven by this separation:
  • Third-party libraries should depend only on the API, not on any specific SDK.
  • Final application owners choose whether to include an SDK or which SDK/distribution to use.
  • Instrumented libraries must behave correctly even if no SDK is present — relying solely on API behavior keeps them resilient.
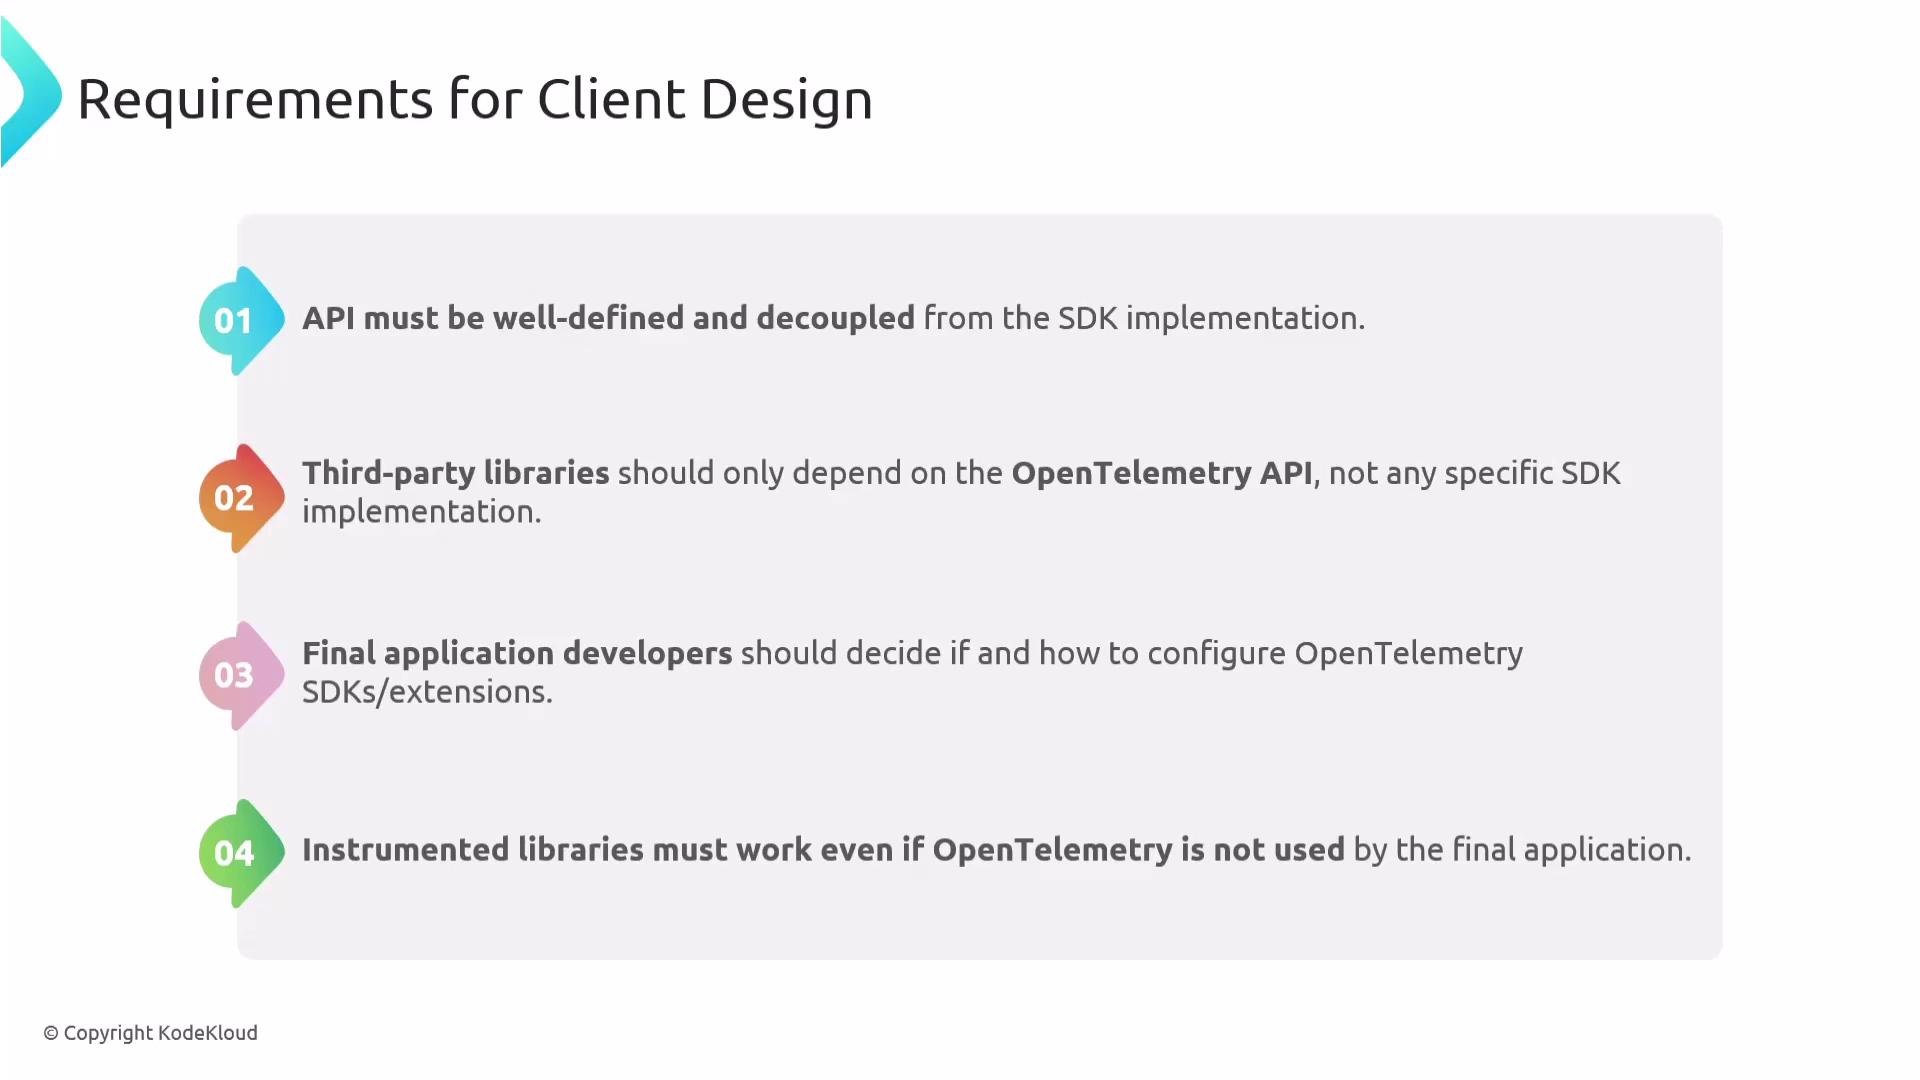
The image outlines four requirements for client design in the context of OpenTelemetry, focusing on API definition, third-party library dependencies, application developer choices, and functionality of instrumented libraries.
Keep instrumentation dependent only on the API. This enables swapping SDKs or running with no SDK without breaking instrumented libraries.

SDK responsibilities and exporters

SDKs implement protocol-independent runtime behaviors such as batching, queuing, retry logic, and sampling. Exporters are protocol- or backend-specific components that send telemetry to external systems. Common exporters and uses:
  • OTLP: a common protocol to communicate with collectors and backends (see the OpenTelemetry proto definitions).
  • Jaeger, Zipkin: tracing backends with their specific formats.
  • Prometheus: metrics scraping and exposition.
  • Console exporters: quick debugging or development.
  • In-memory/mock exporters: unit and integration tests.
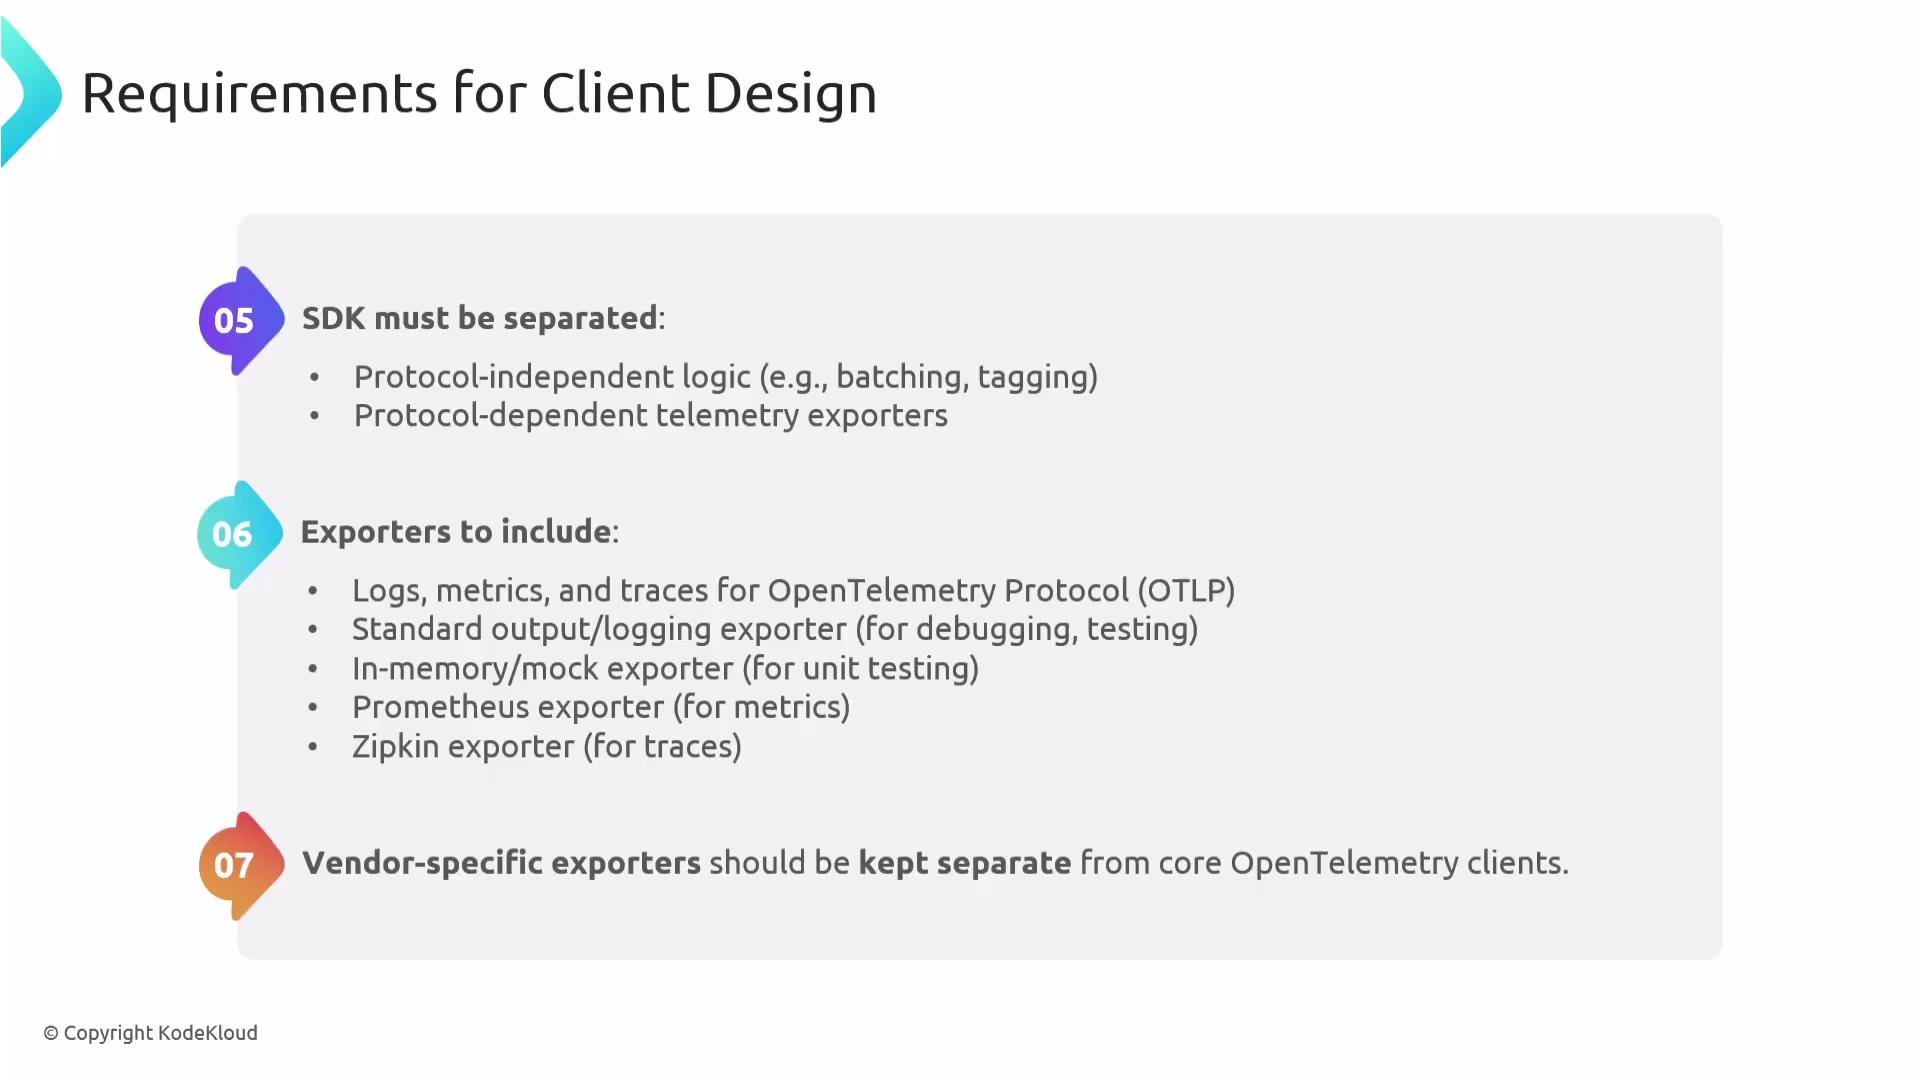
Vendor-specific exporters should be kept separate from the core clients (provided in vendor distributions or contrib packages).
The image lists requirements for client design, focusing on SDK separation, included exporters, and keeping vendor-specific exporters separate in the context of OpenTelemetry.

Modular client layout

OTel clients are typically modularized per signal (traces, metrics, logs). Each signal usually exposes four packages/modules:
  • API — public interfaces, types, and constants used by instrumentation.
  • SDK — the runtime implementation offering configuration and pluggable components.
  • Semantic Conventions — a catalog of recommended attribute names and conventions.
  • Contrib — community-maintained integrations and auto-instrumentation plugins.
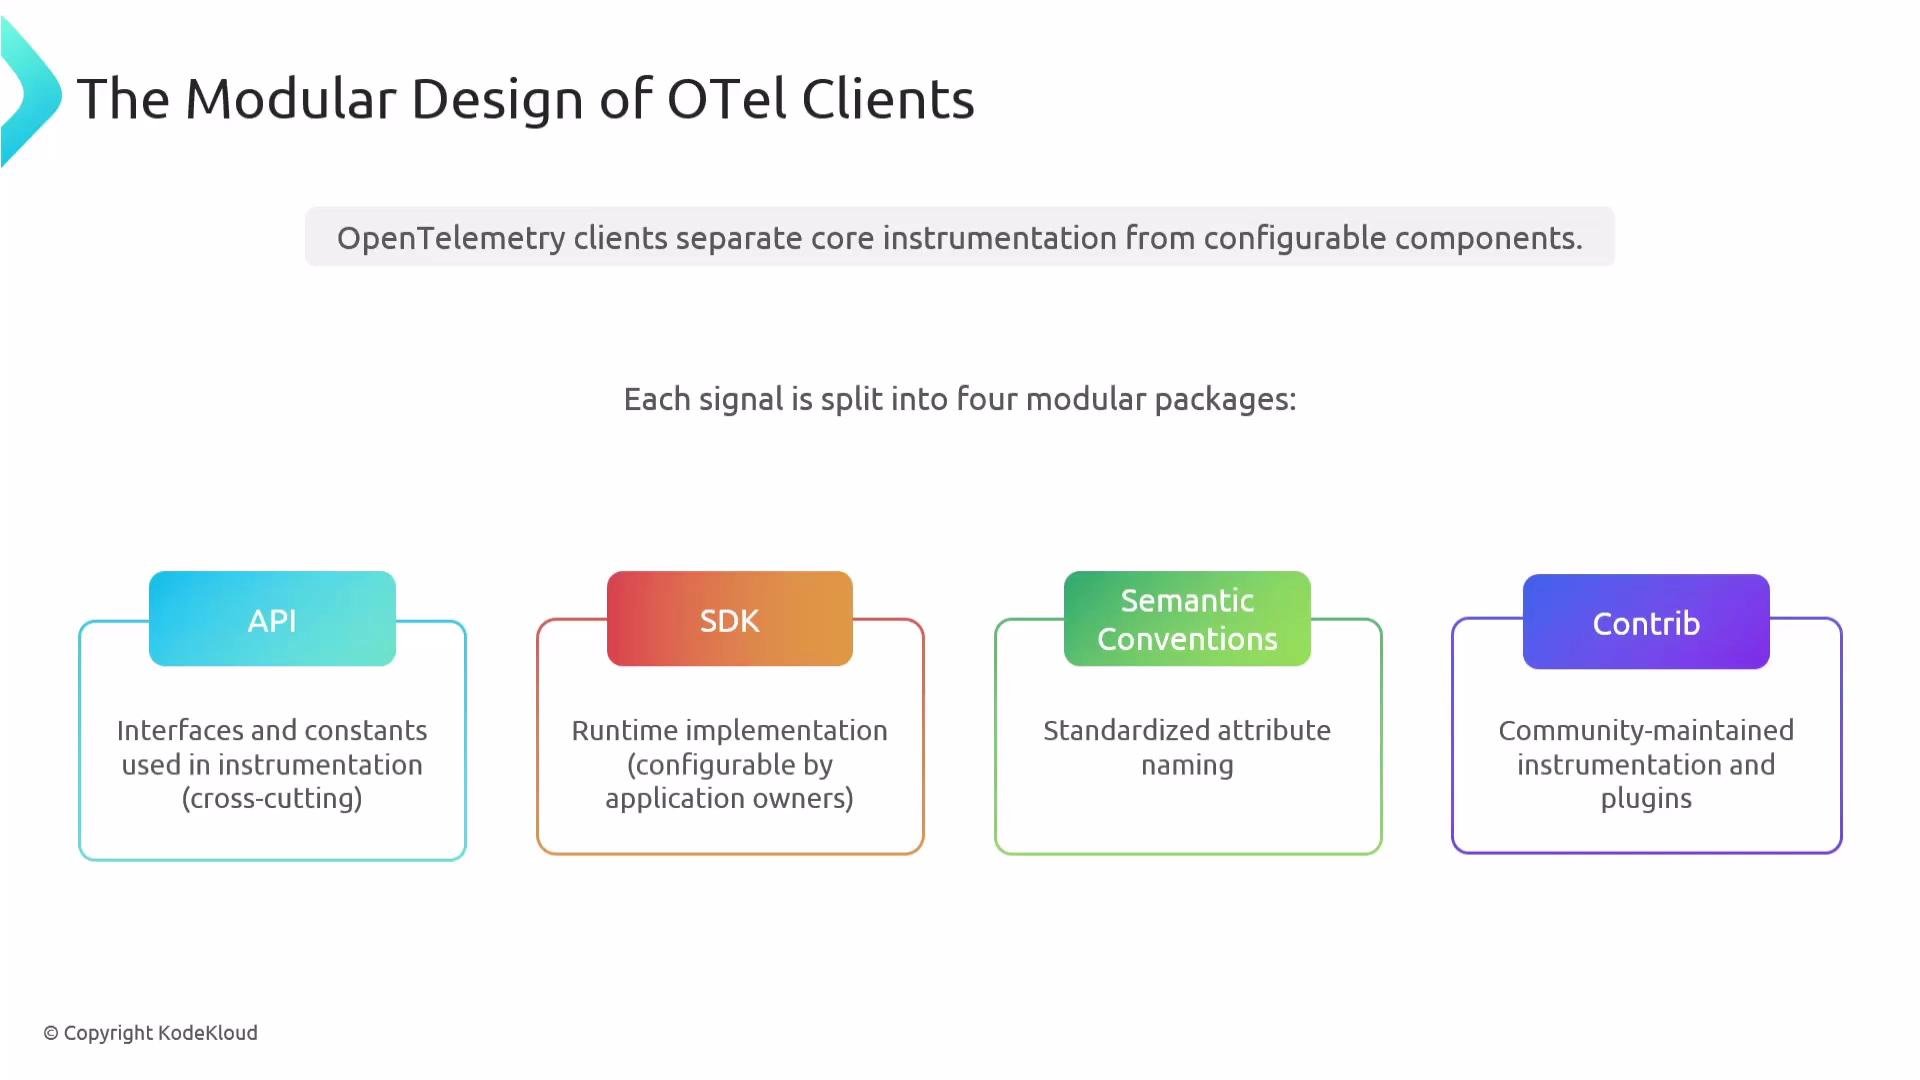
The image explains the modular design of OpenTelemetry clients, showing how each signal is divided into four packages: API, SDK, Semantic Conventions, and Contrib.
Contrib packages are where community-driven instrumentation and integrations live (for example, Flask instrumentation for Python). They simplify adoption by providing ready-made instrumentations for popular frameworks.

How clients fit into an observability architecture (example: Kubernetes)

Typical data flow and responsibilities:
  • Application code uses the API to create telemetry.
  • SDKs handle sampling, processing, and exporting inside the application or service.
  • The OpenTelemetry Collector receives telemetry from one or more sources, transforms it, and forwards it to external backends.
  • In Kubernetes, the OTel Operator automates deployment and scaling of Collectors.
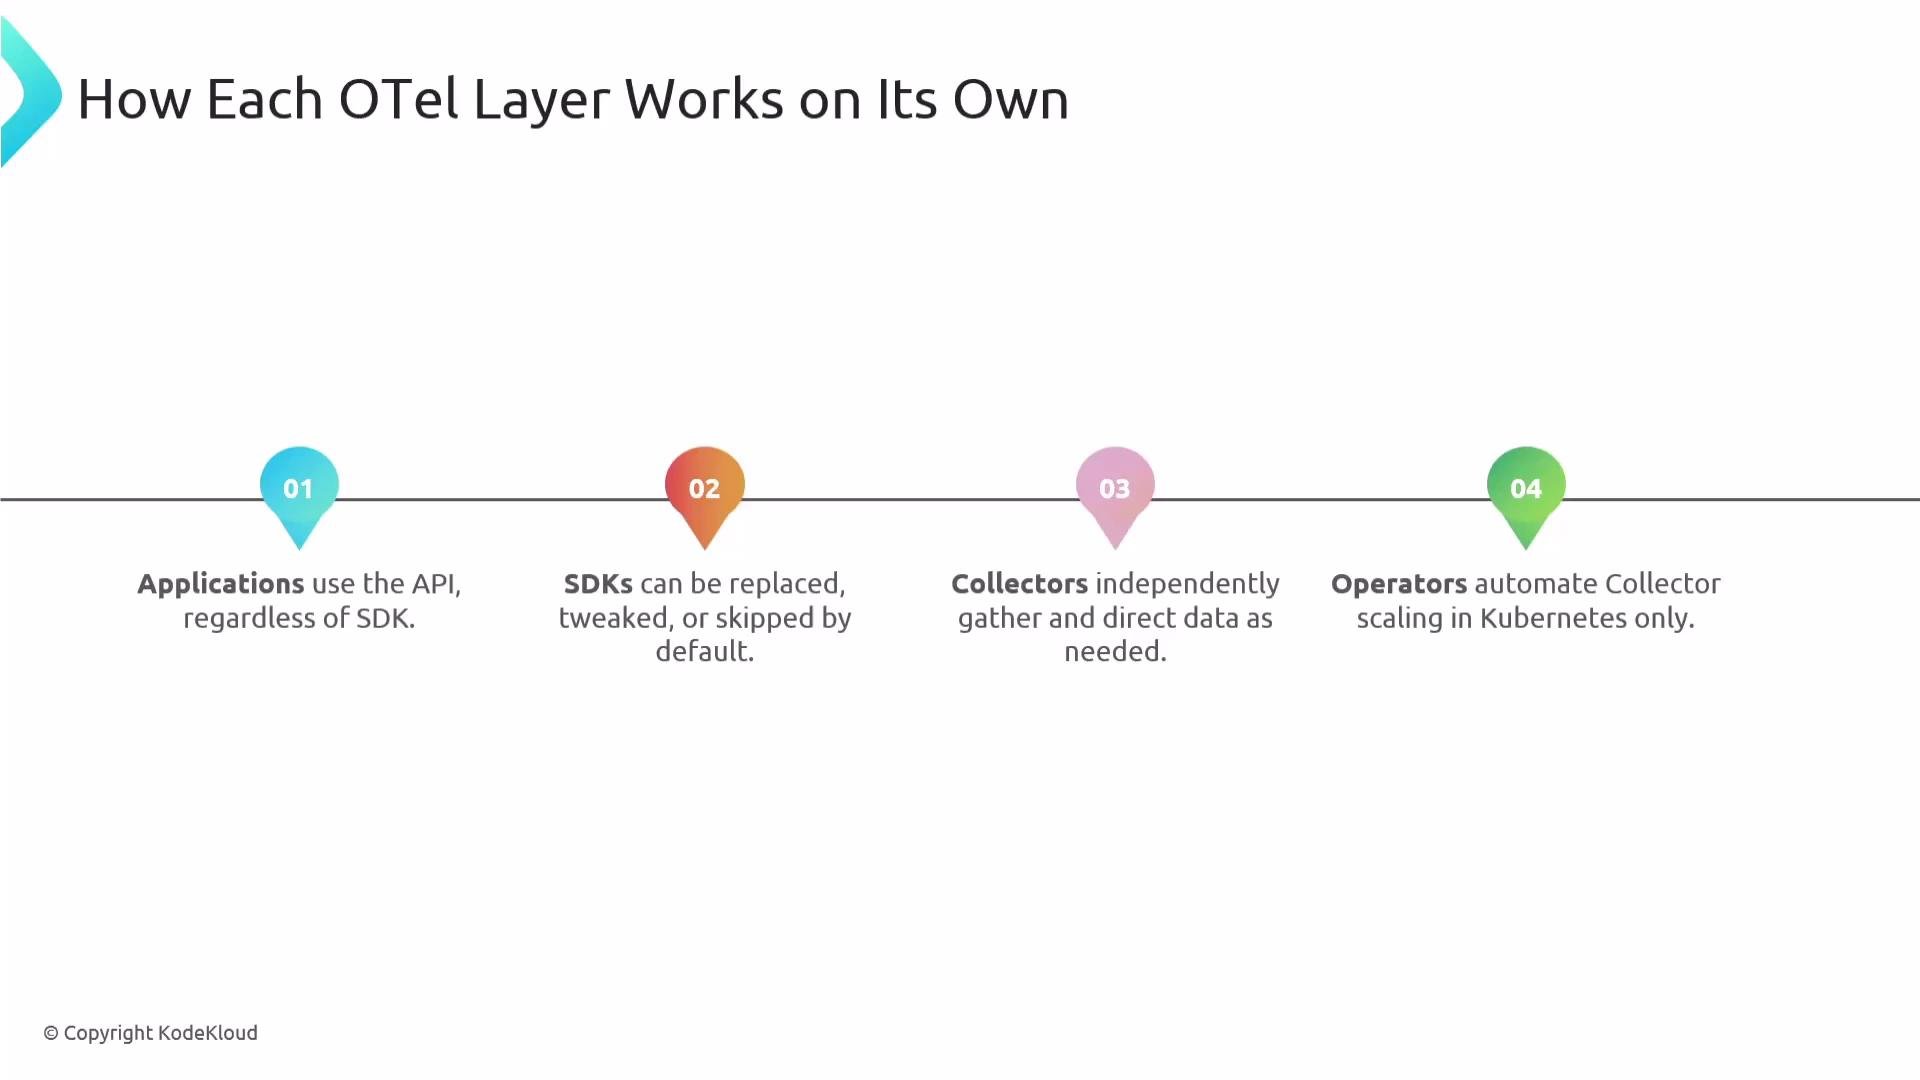
This layered separation enables independent evolution and replacement of any layer.
The image is a diagram showing how each layer of the OpenTelemetry (OTel) system works independently, highlighting the roles of applications, SDKs, collectors, and operators.
In practice, most deployments combine API + SDK + Collector; Kubernetes users commonly add the Operator to manage Collector lifecycle.

Quick recap: components and what they do

  • API — how telemetry is generated and instrumented in your code.
  • SDK — runtime logic: sampling strategy, batching, processing, exporting.
  • Instrumentation libraries — automatic instrumentation for frameworks (e.g., Flask, Spring).
  • Distributions — vendor-provided packaging and opinionated defaults for upstream OTel components (not forks).
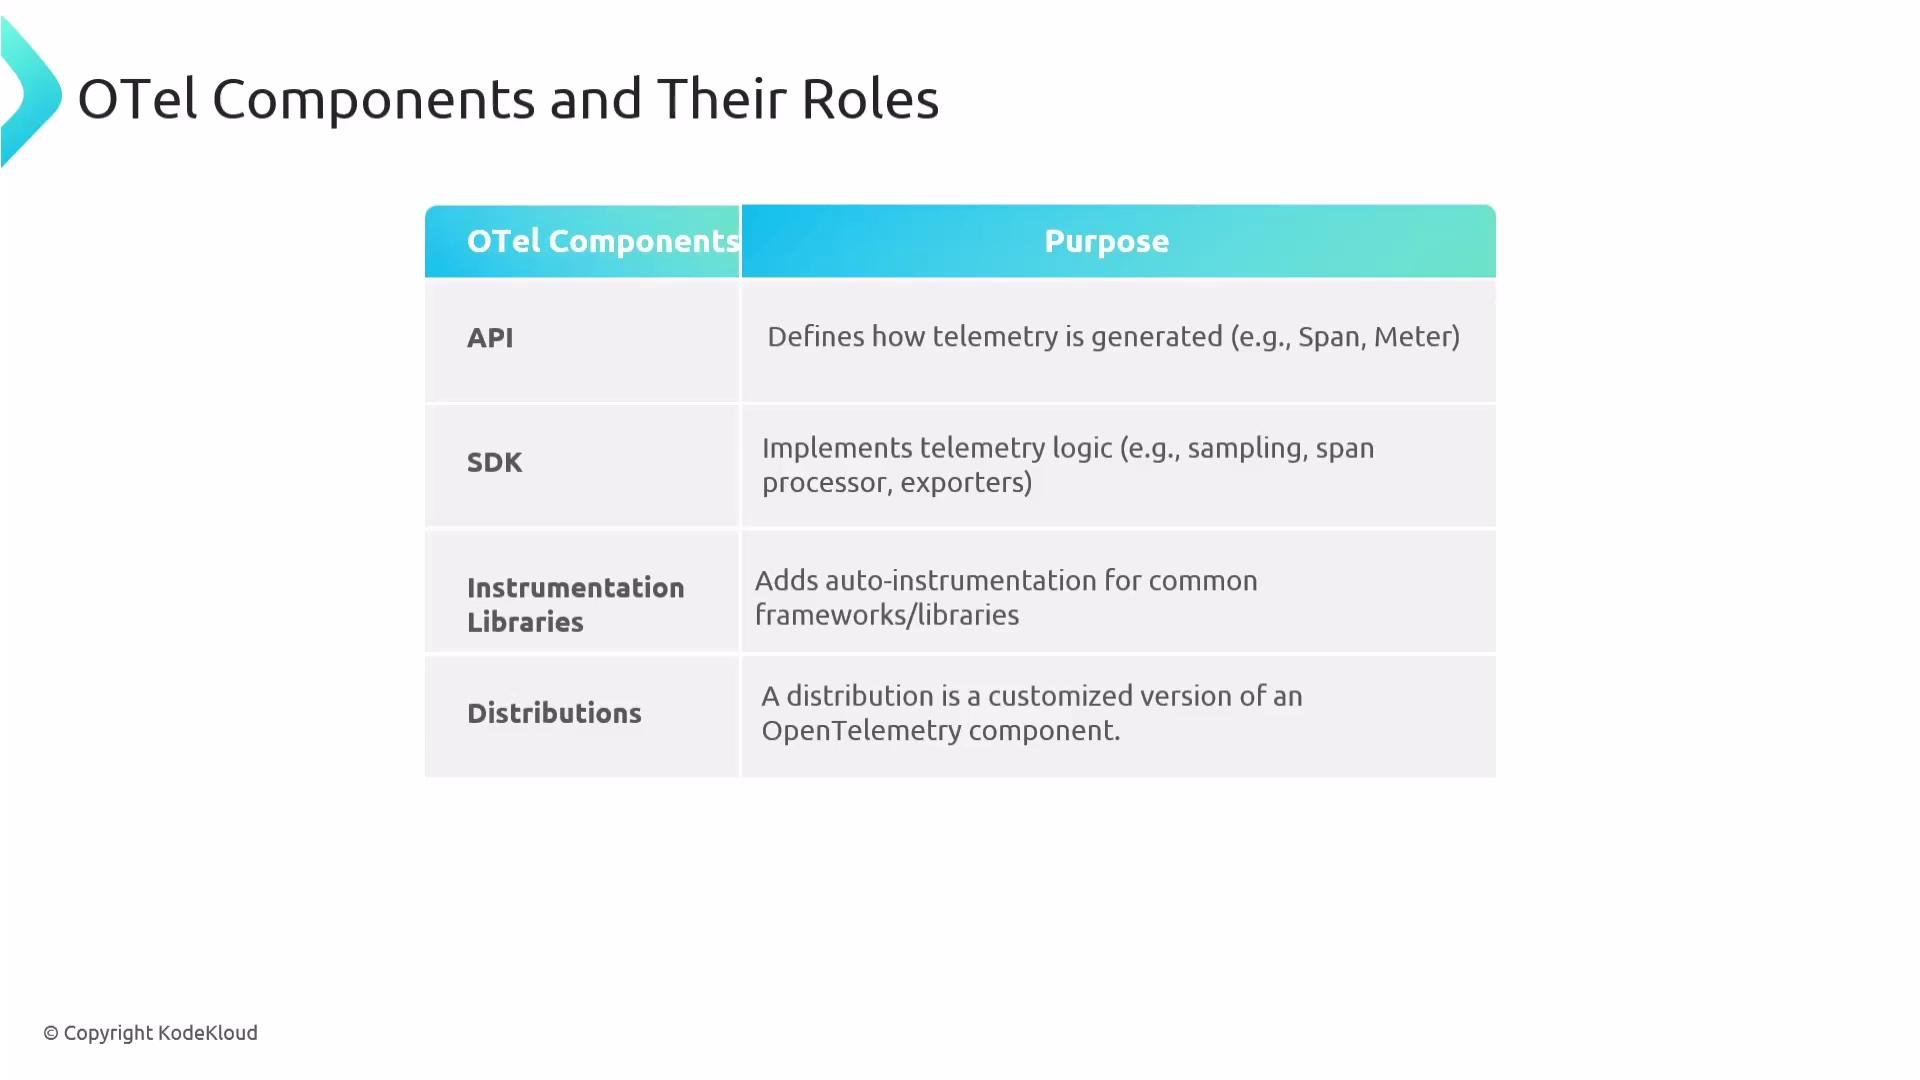
The image is a table outlining OpenTelemetry components and their roles, such as API, SDK, Instrumentation Libraries, and Distributions, with corresponding purposes.
Note: distributions are not forks. A distribution packages upstream OTel components with vendor- or community-specific defaults, integrations, or configuration.
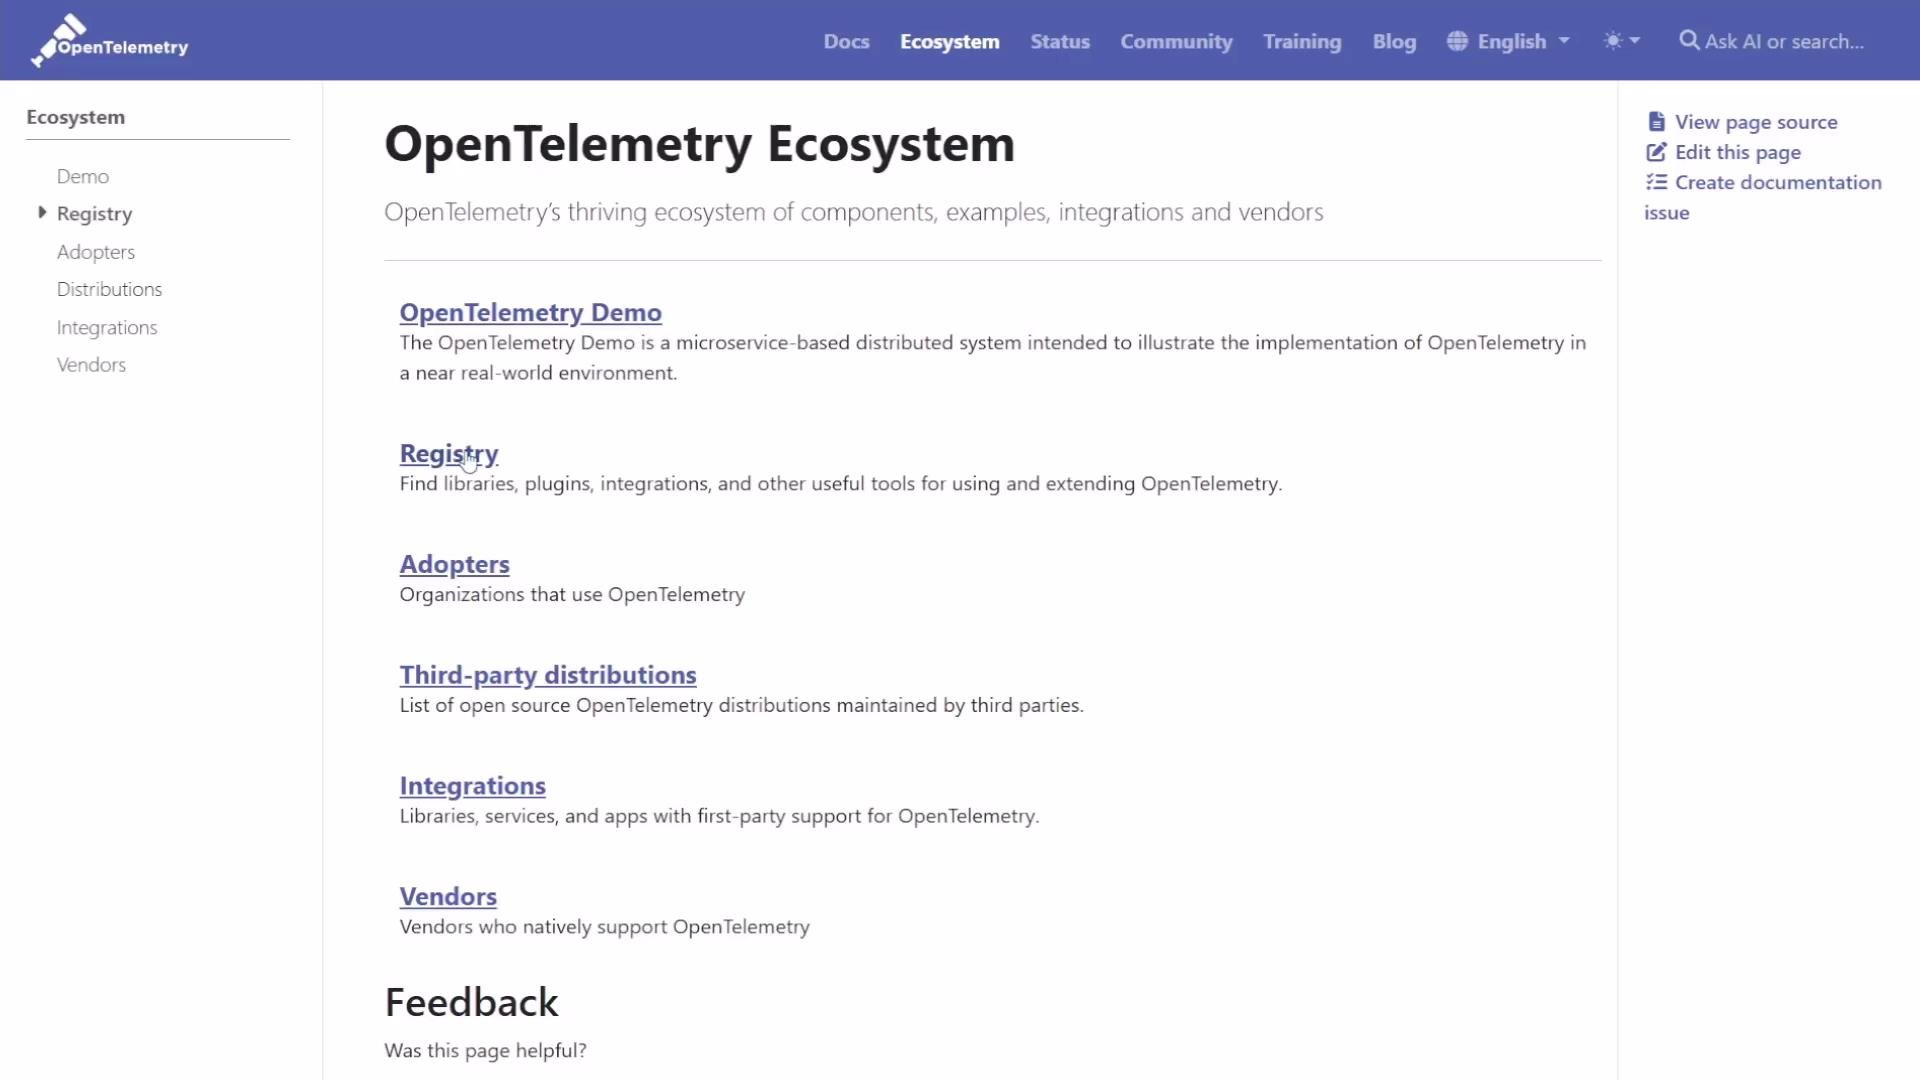
The image shows the OpenTelemetry Ecosystem page with a list of sections like "Demo," "Registry," "Adopters," and "Vendors," detailing components and integrations.
Other components worth knowing:
  • Exporters — adapters that connect telemetry to a backend.
  • Collector — a centralized component to receive, transform, and export telemetry from multiple sources.
  • Operator — a Kubernetes-native controller to manage Collector deployments.
These design decisions and terminology appear throughout the official OpenTelemetry documentation and are commonly tested in certification exams and interviews: see the OpenTelemetry docs for detailed guidance and references.

Registry, contrib, and distributions

The OpenTelemetry registry lists instrumentation libraries and contrib packages (for example, Flask instrumentation points to the opentelemetry-python-contrib repo and Flask tracing integration).
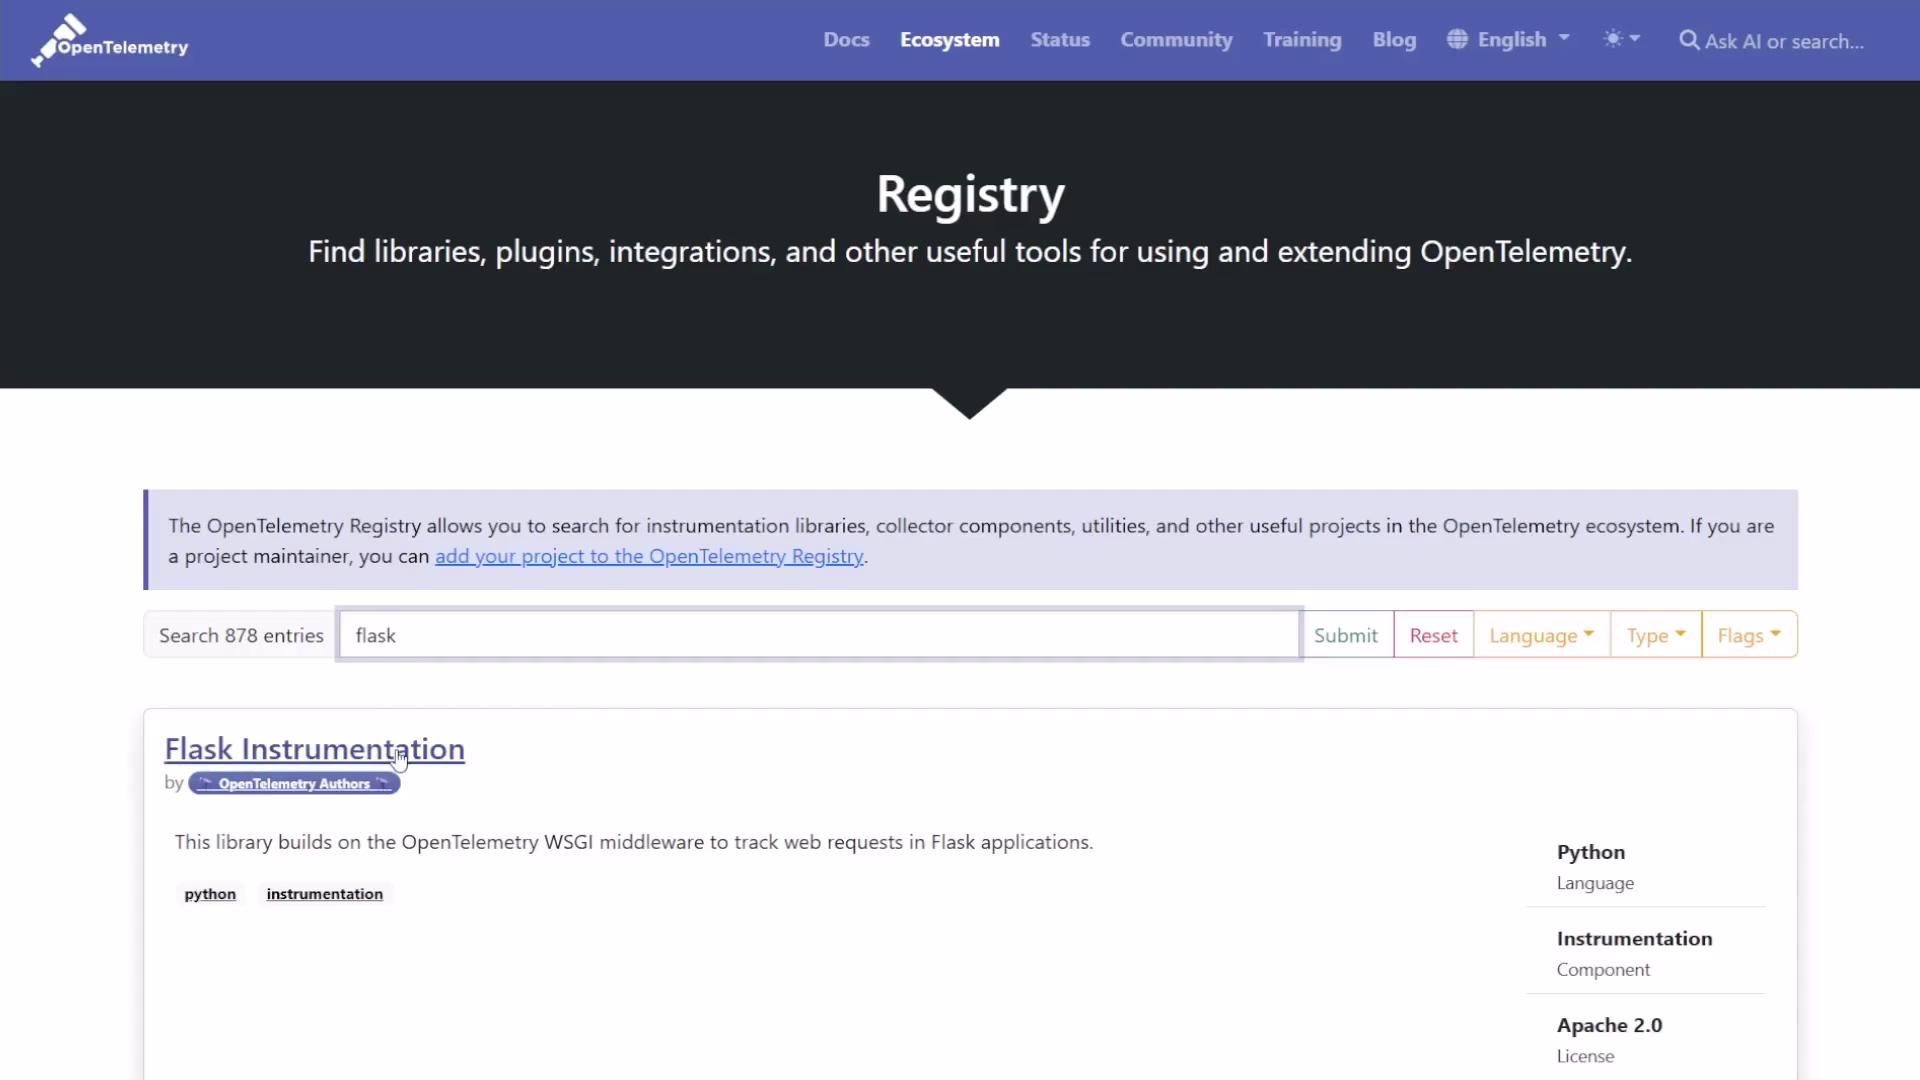
The image shows the OpenTelemetry Registry web page allowing users to search for libraries and tools, with a search result for "Flask Instrumentation" highlighted, which is related to tracking web requests in Flask applications.
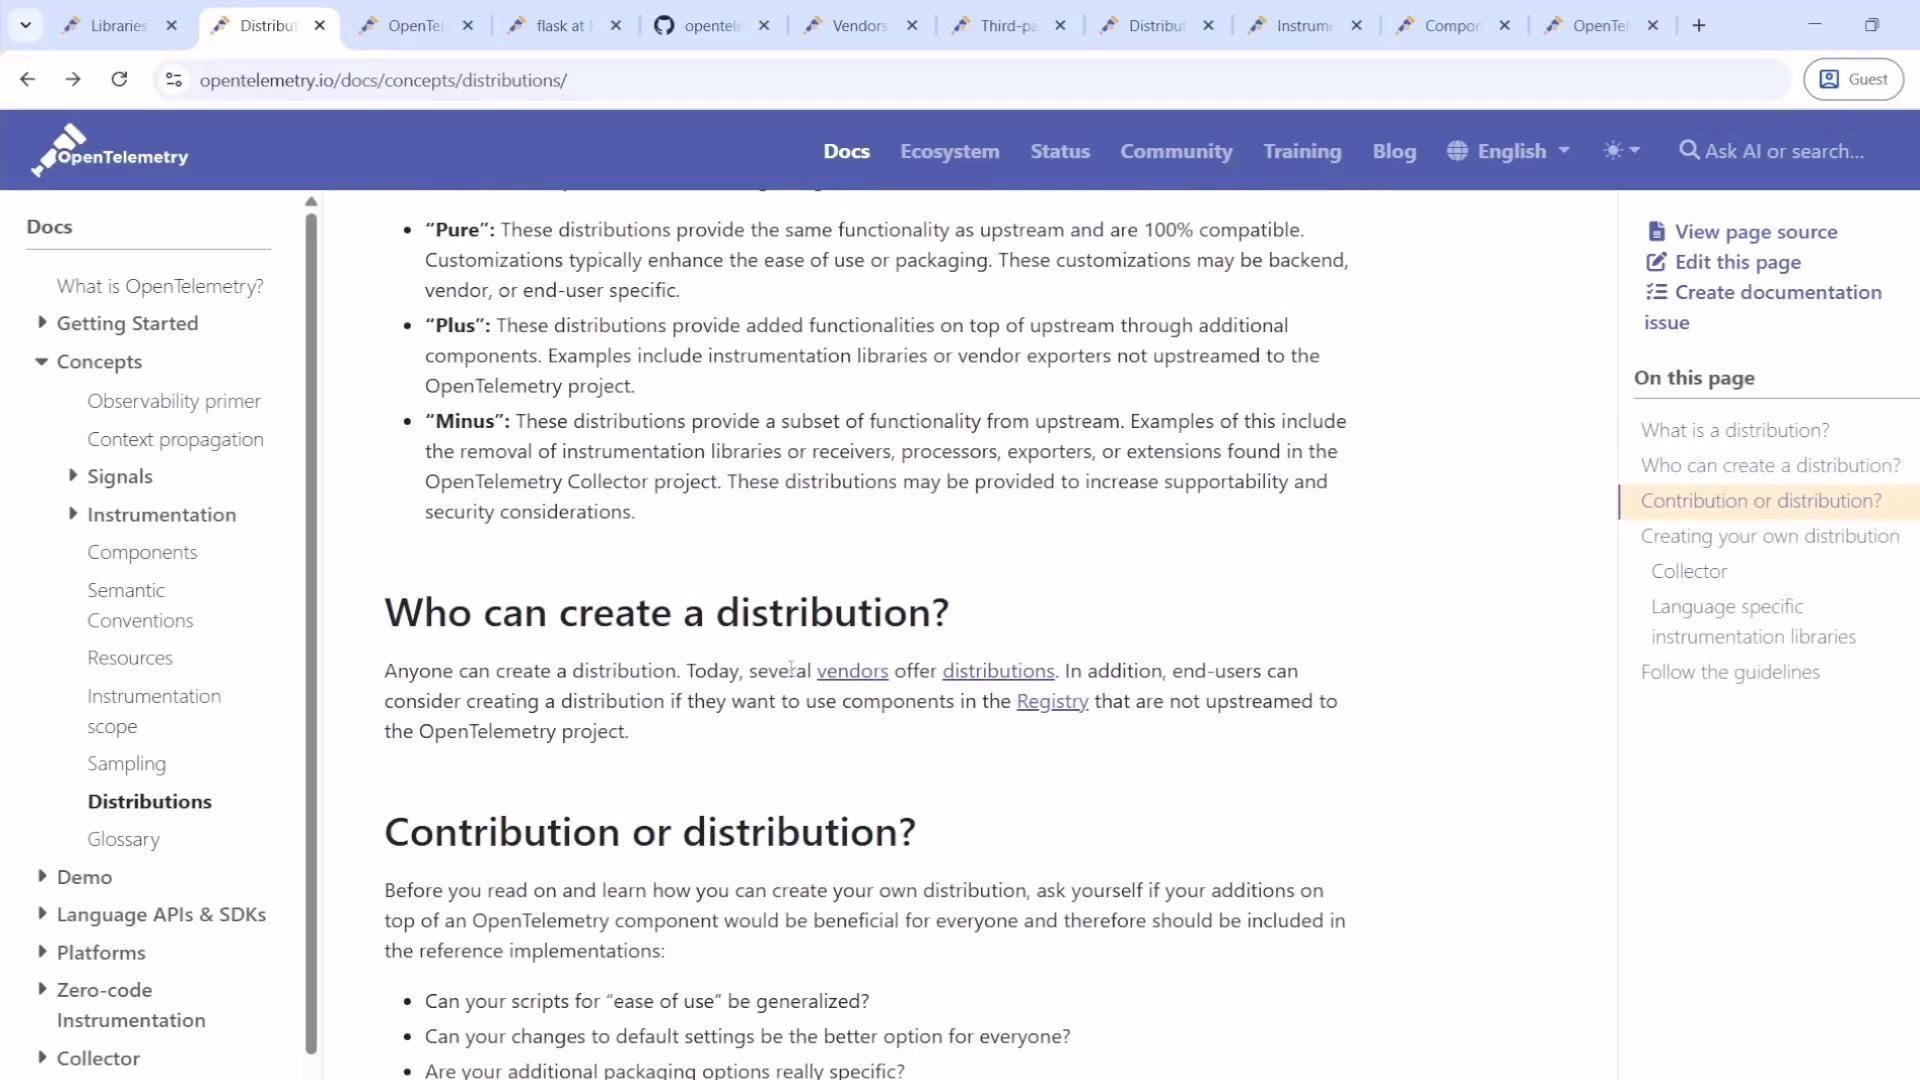
Distributions (vendor or community curated) are documented along with guidance on types and how to create one. Examples include AWS Distro for OpenTelemetry, Azure Distro, and other vendor-maintained packages.
The image shows a webpage from the OpenTelemetry documentation discussing distributions, including types like "Pure," "Plus," and "Minus," along with guidance on creating a distribution.
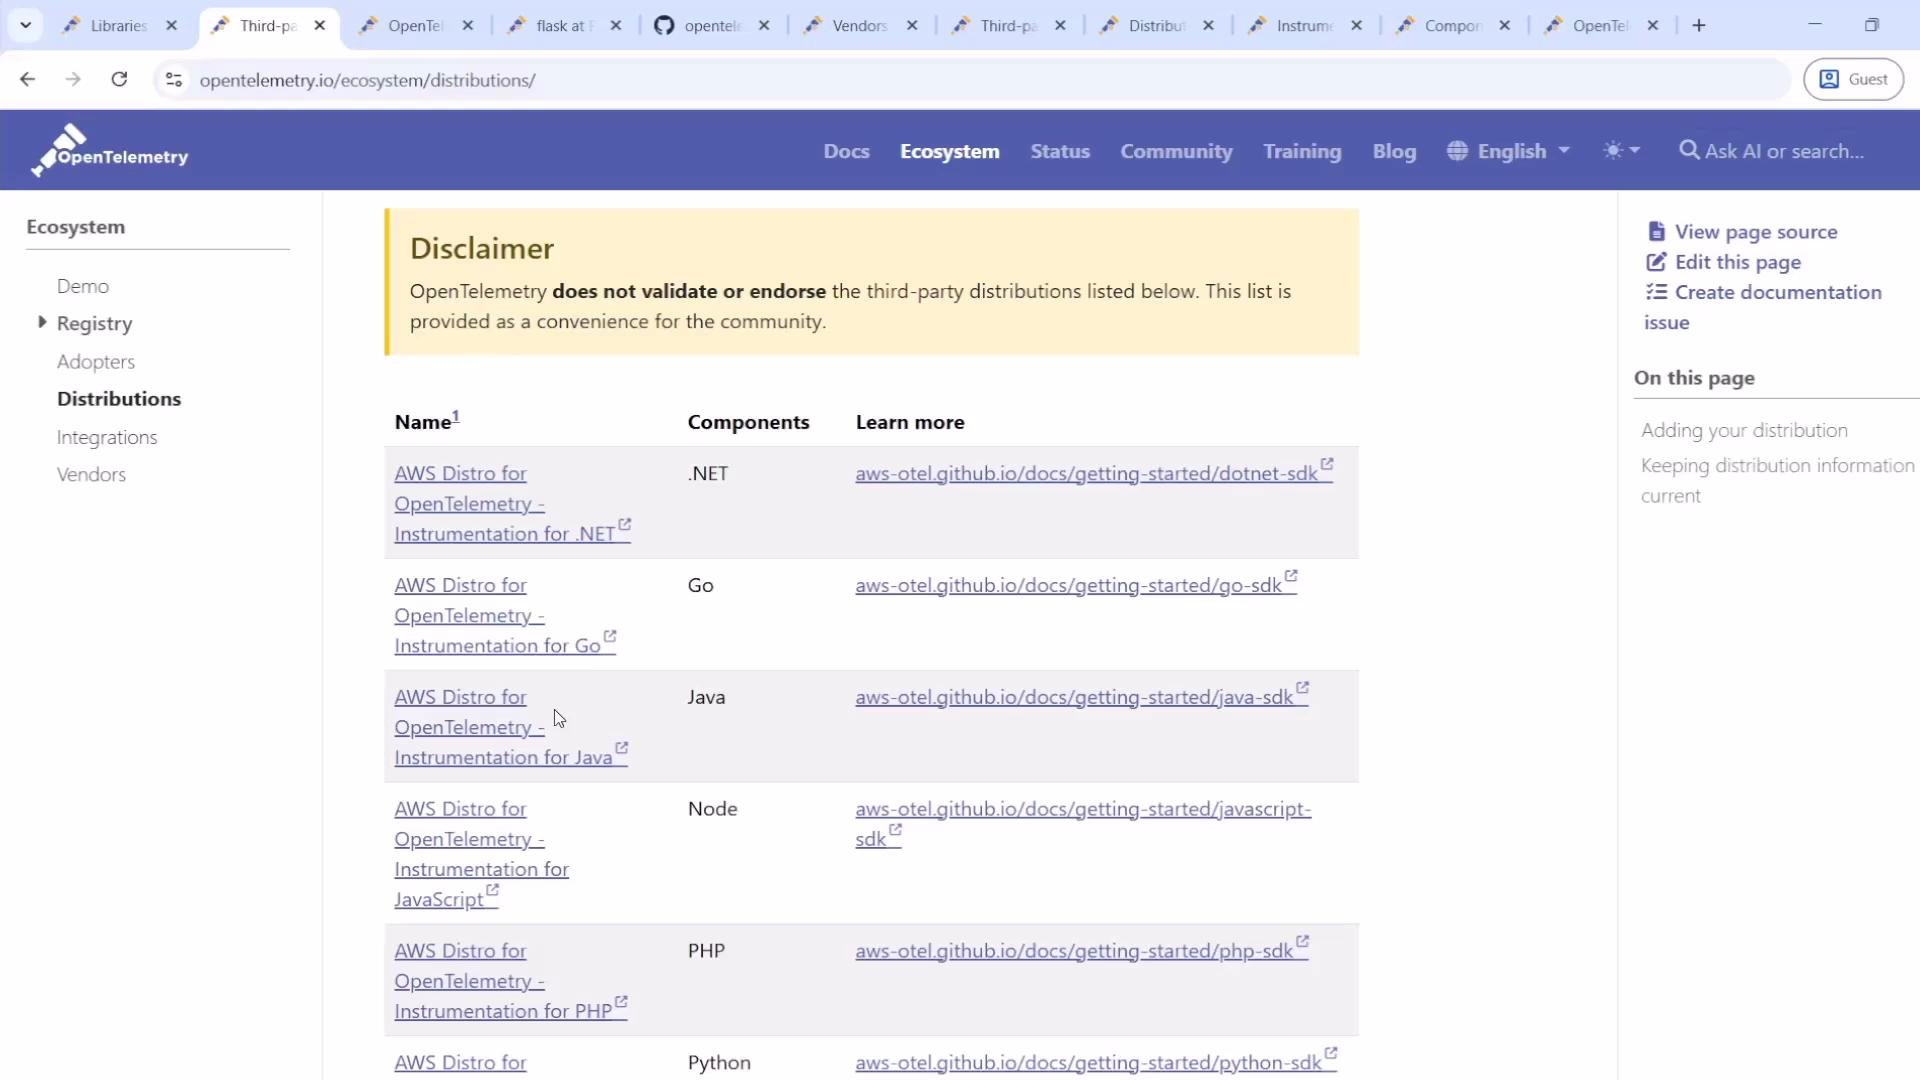
The OpenTelemetry site maintains a list of third-party distributions and clearly states it does not endorse any specific distribution; the page documents who maintains each distribution.
The image displays a webpage from the OpenTelemetry site, listing third-party distributions with links for various programming languages like .NET, Go, Java, and more. There's a disclaimer at the top indicating that OpenTelemetry does not endorse these distributions.
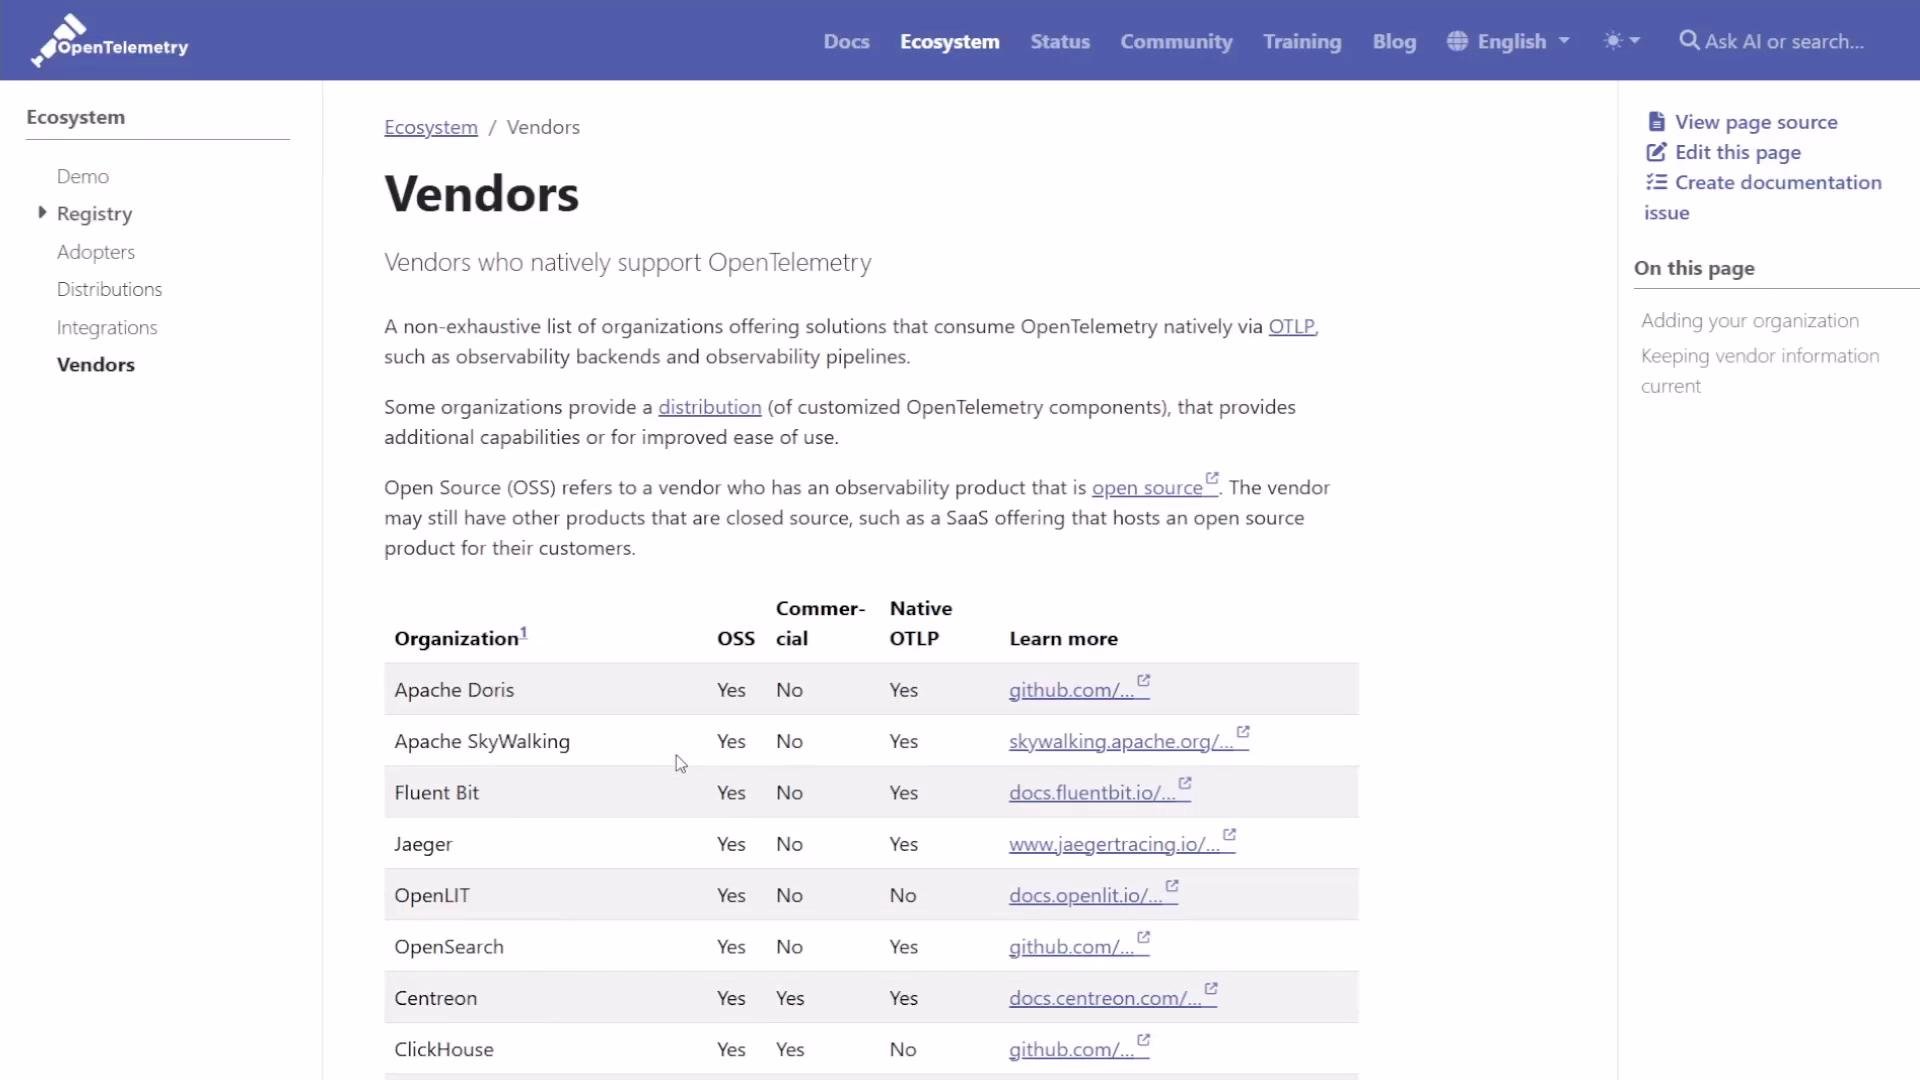
The ecosystem page also lists many observability backends and vendors that natively support OpenTelemetry and the OTLP protocol; this is a non-exhaustive catalog of organizations offering and consuming OTel data.
The image shows a webpage listing vendors that support OpenTelemetry, including a table with organizations and information about their open-source status and support for native OTLP.

References and further reading

That concludes this lesson on OpenTelemetry client design principles. Use the API for instrumentation, select the SDK or distribution that fits your deployment needs, and prefer the Collector when you need central processing, transformation, or cross-service telemetry routing.

Watch Video