

- ConsoleSpanExporter: good for quick debugging and tests.
- OTLP exporter: sends traces to real backends for storage, visualization, and correlation across services.
Current tracer configuration (ConsoleSpanExporter)
Example: a minimal tracer setup that prints spans to the console:Exporting to Jaeger via OTLP
Rather than printing spans locally, we’ll send them to Jaeger. Jaeger accepts traces via the OpenTelemetry Protocol (OTLP), so we can use the OTLP HTTP exporter provided by OpenTelemetry instead of a Jaeger‑specific exporter. This keeps your instrumentation portable to any OTLP-compatible backend.Jaeger supports OTLP (HTTP and gRPC). Using the OTLP exporter keeps your instrumentation portable to any backend that accepts OTLP, not just Jaeger.
Update tracer configuration to use OTLPSpanExporter
When sending to a local Jaeger instance, the OTLP HTTP endpoint is typicallyhttp://localhost:4318/v1/traces. Update your tracer configuration to use the OTLP HTTP exporter:
- Use
BatchSpanProcessorin production; it buffers spans and sends them efficiently.SimpleSpanProcessorsends synchronously and can hurt performance. - OTLP over HTTP commonly uses port
4318and the/v1/tracespath. If using OTLP/gRPC or a hosted service, verify the endpoint and protocol in the backend docs.
Make sure the endpoint, protocol (HTTP vs gRPC), and any required authentication match your Jaeger or hosted OTLP service. Sending to the wrong endpoint or protocol will result in dropped traces.
Quick comparison
Run your instrumented application
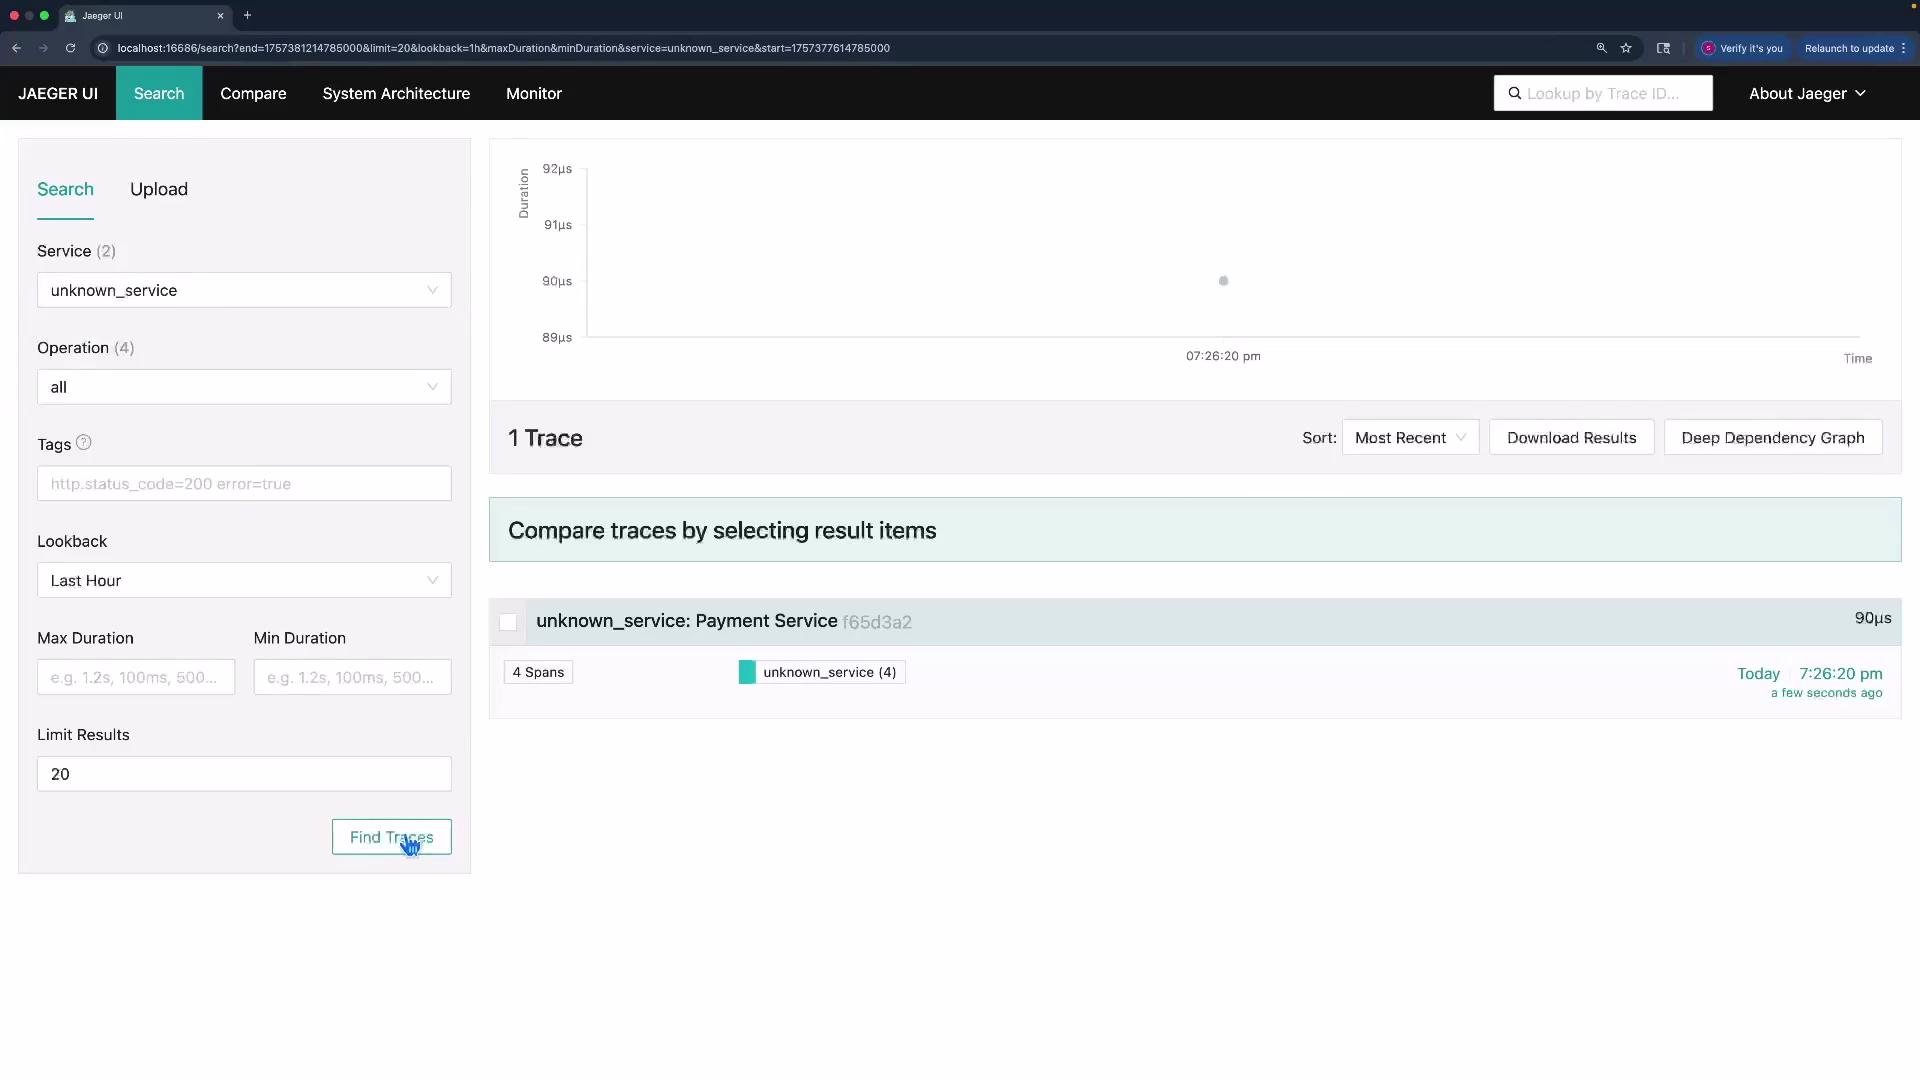
Save the updated configuration and run your application. The application’s runtime output (print statements) will remain the same, but span data will be exported to Jaeger:http://localhost:16686) and search for traces. In this example the traces appear, but the service is shown as unknown_service — we’ll fix the service/resource name in the next step.
References
- Jaeger: https://www.jaegertracing.io/
- OpenTelemetry OTLP spec: https://opentelemetry.io/docs/reference/specification/protocol/otlp/