

- A connector acts as an exporter on a source pipeline and as a receiver on a target pipeline.
- This lets the Collector derive new telemetry (for example, metrics from traces) or route/fan out data without changing application or SDK code.
- Connectors are useful for SRE metrics (RED/SLIs), topology graphs, routing, aggregation, and error extraction.
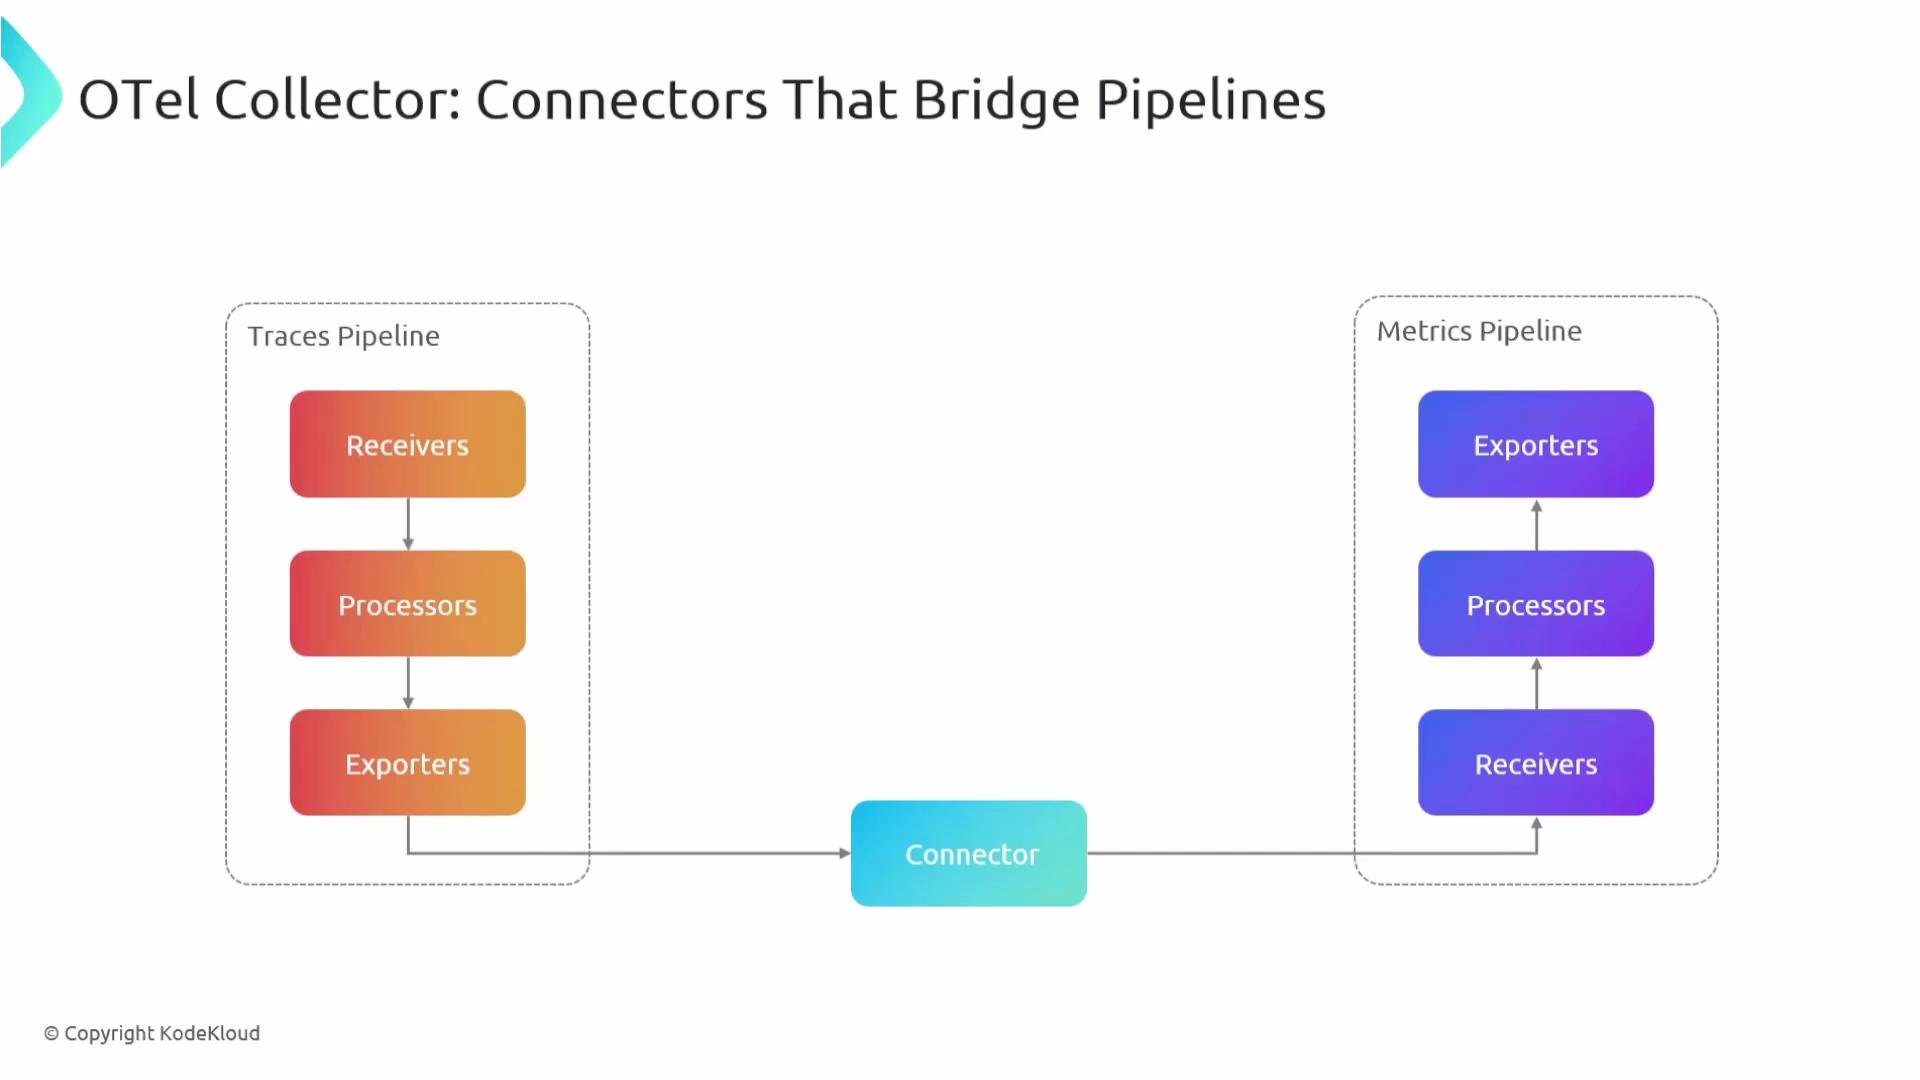
Connectors bridge pipelines by appearing as an exporter on the source pipeline and as a receiver on the target pipeline. This allows the Collector to derive new telemetry (for example, metrics from spans) without changing application or SDK code.
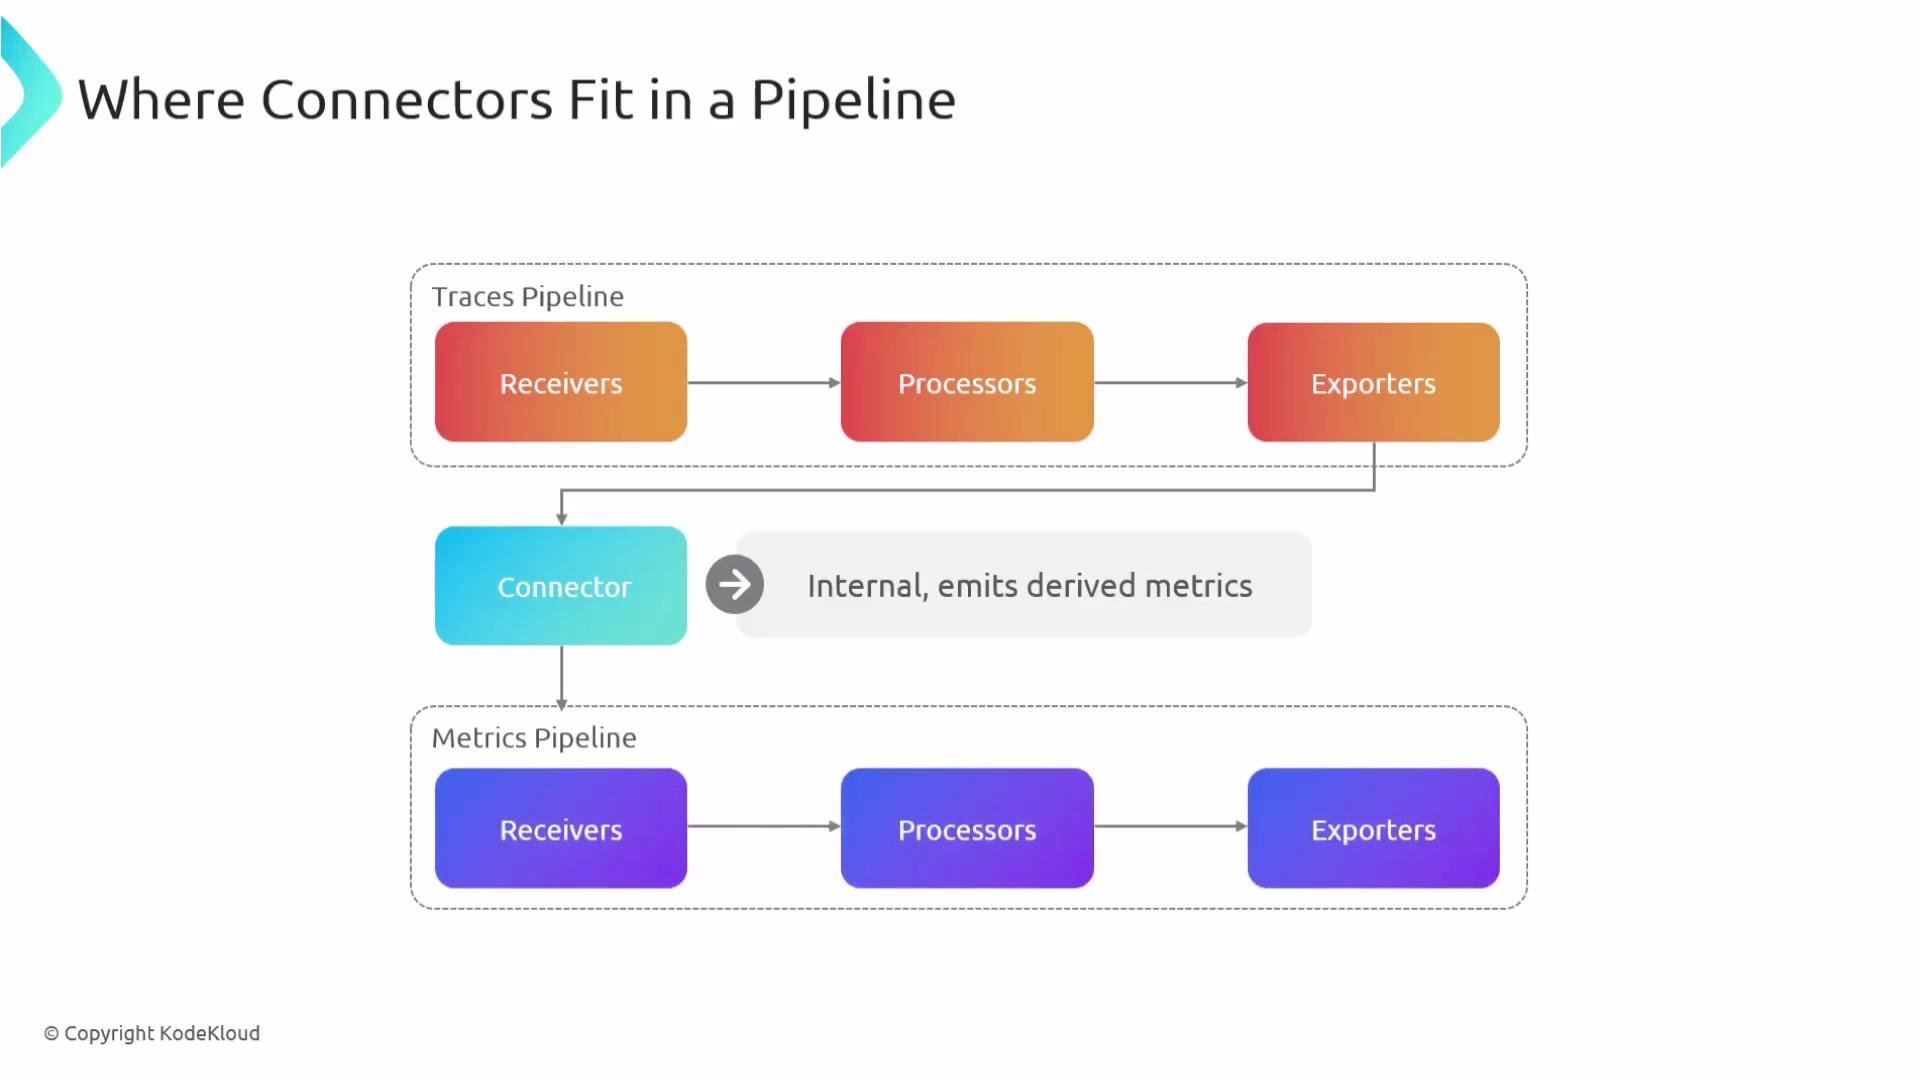
- A connector receives telemetry already processed by a pipeline, optionally performs computation (derive metrics, count, sum, build graphs), and emits data into another pipeline for further processing/export.
- Typical flow: receiver → processors → connector (acts as exporter) → metrics/other pipeline (connector acts as receiver) → exporters.
- Fan-out / reuse telemetry across multiple pipelines.
- Derive metrics from traces (RED metrics, SLIs, latency histograms).
- Build service dependency graphs and detect unexpected edges.
- Conditionally route telemetry based on attributes.
- Aggregate counts or sums into time-series for KPIs.
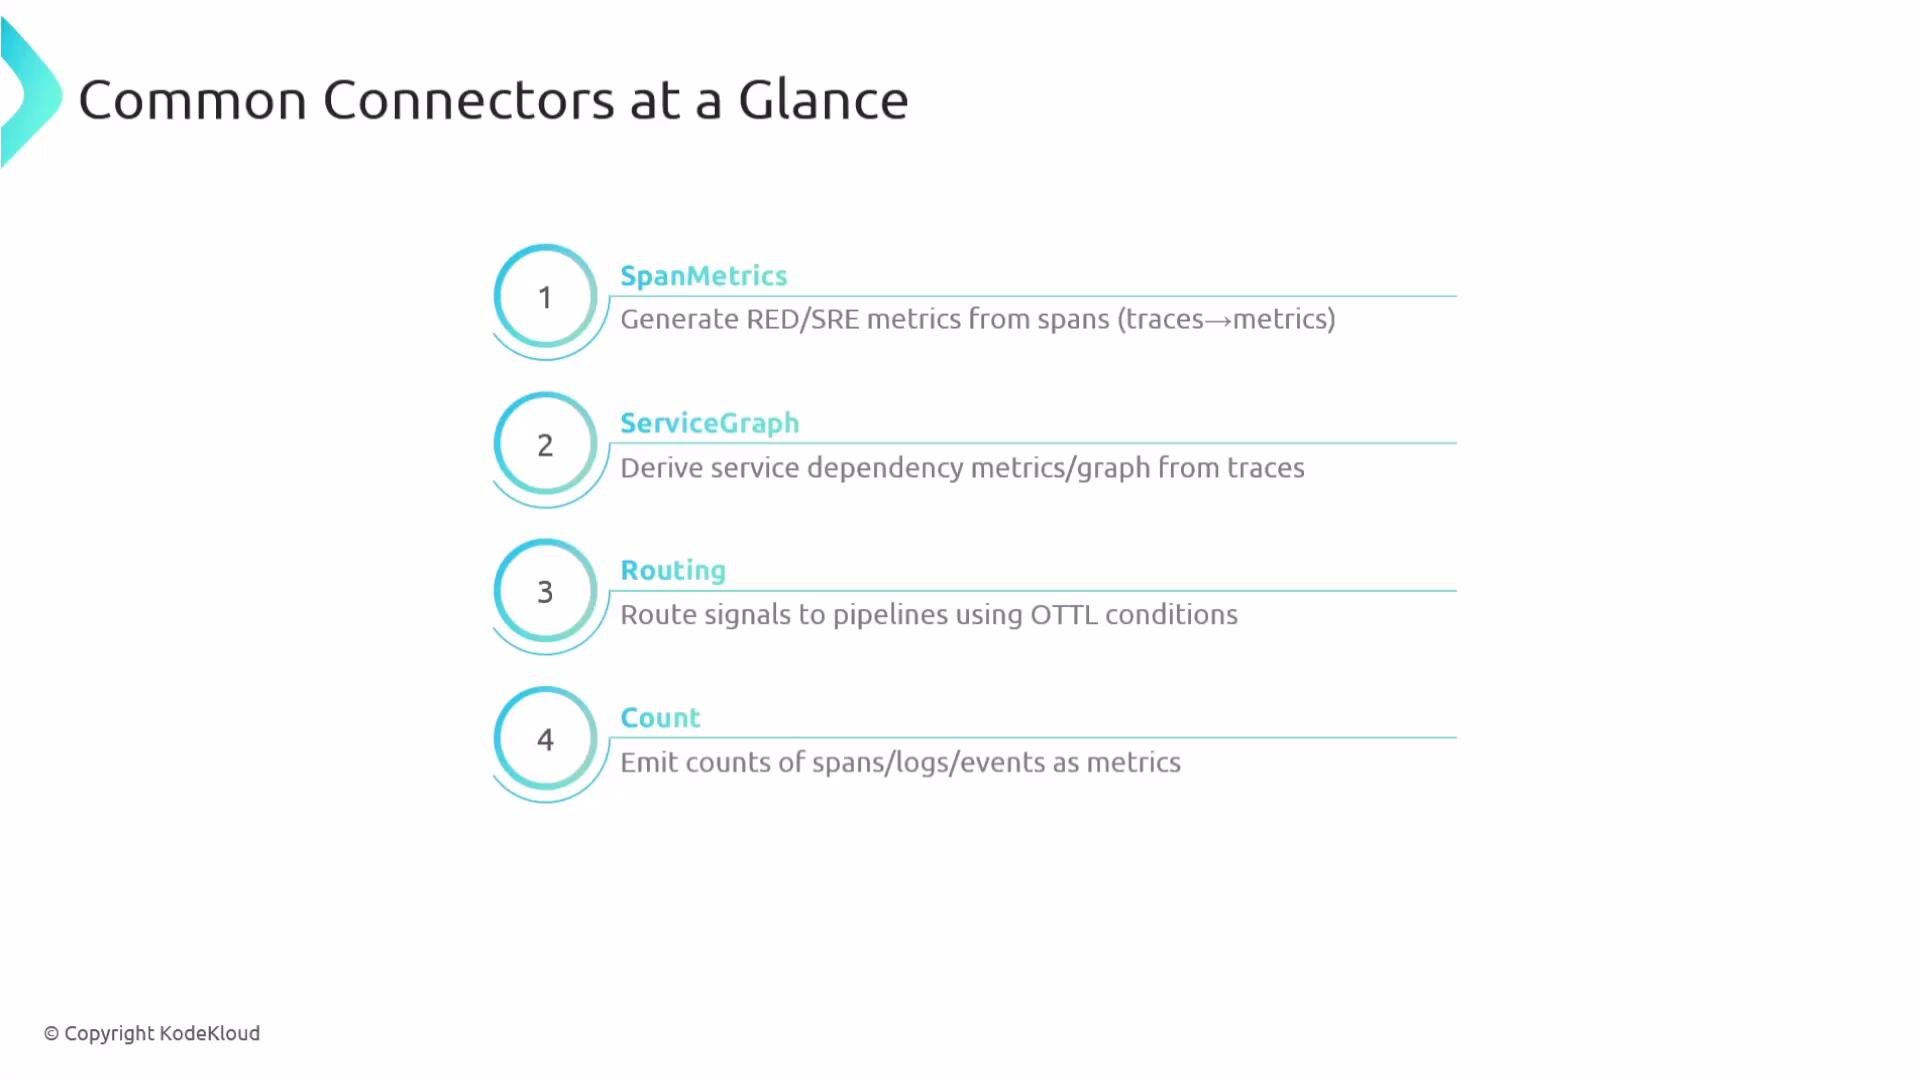
- spanmetrics — derive latency, error, and rate metrics from spans.
- servicegraph — build service dependency/topology metrics.
- routing — OTTL rules to route telemetry to pipelines.
- count — convert span events/logs into simple counts.
- sum — aggregate numeric attributes into time-series.
- forward — merge/split pipelines without transforming telemetry.
- exceptions — extract exception data for logging/alerting.
Count connector (example)
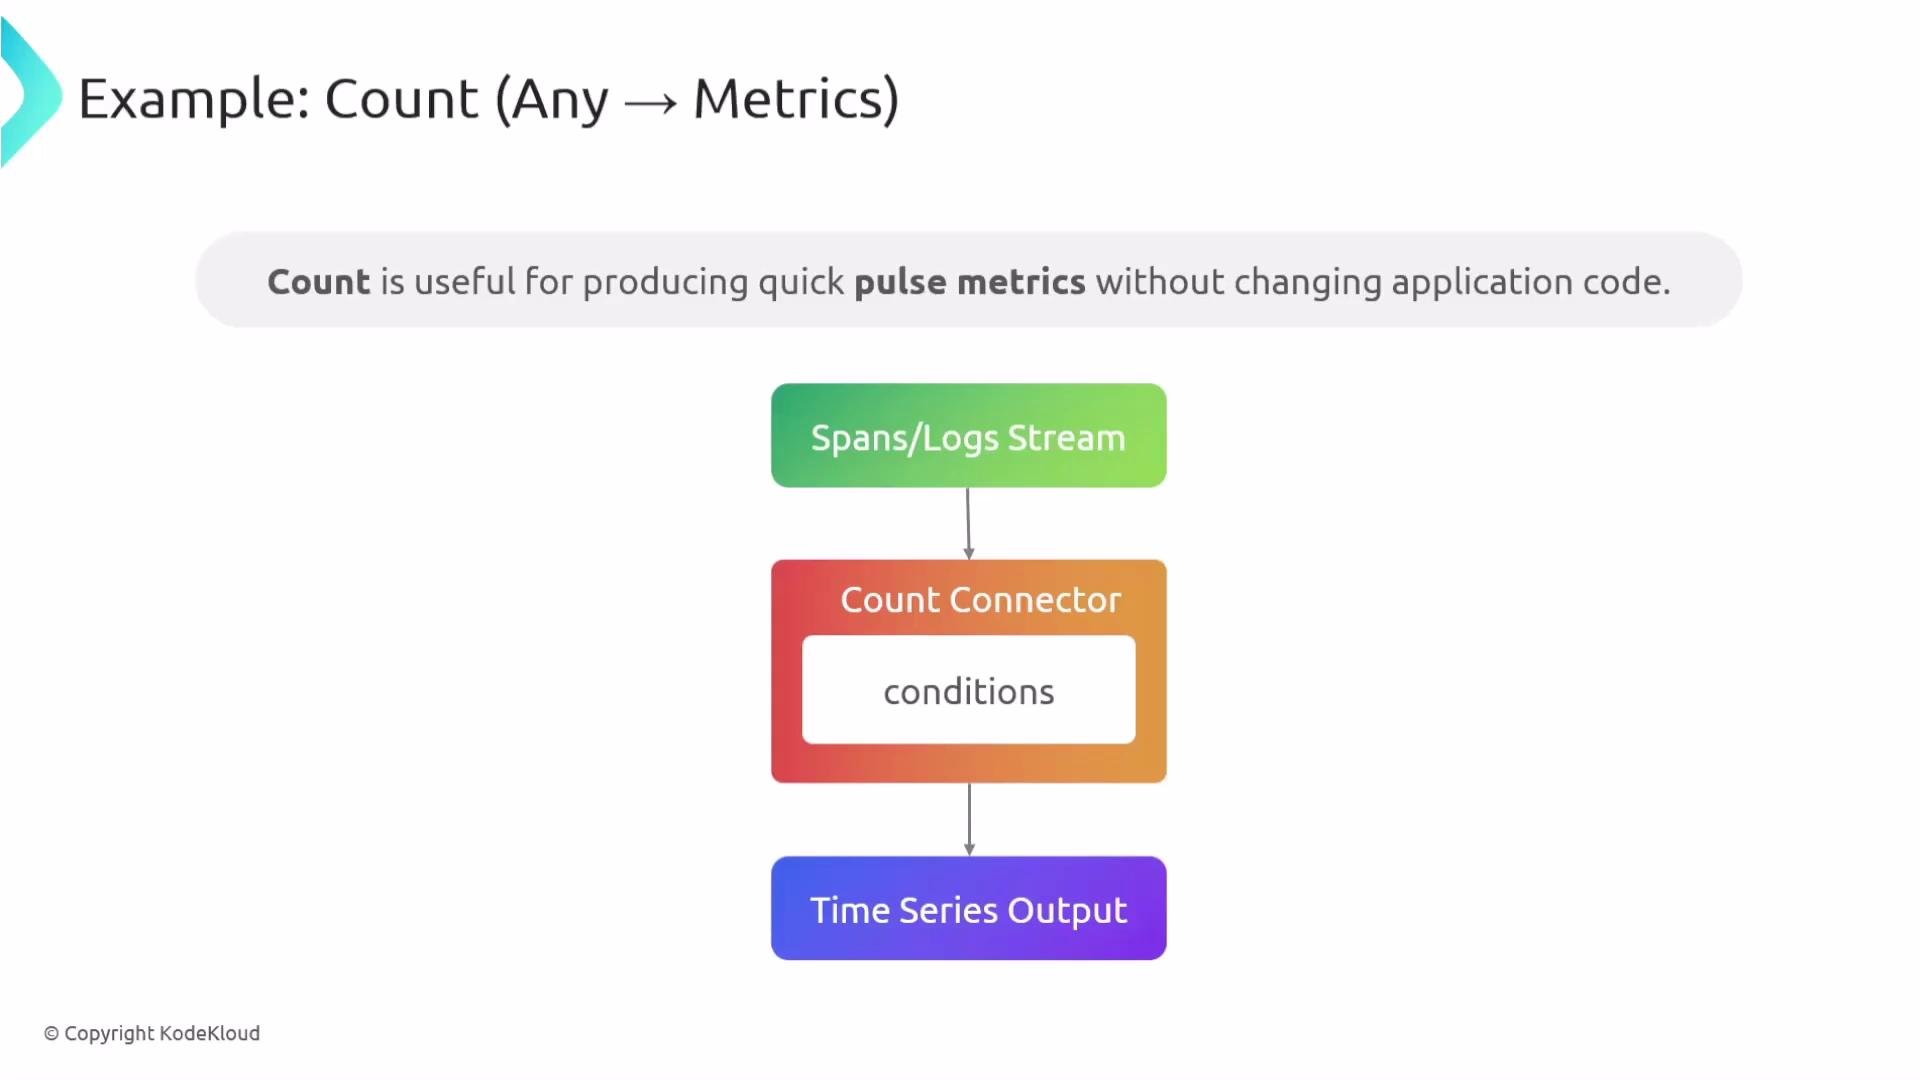
The Count connector converts span events or logs into simple time-series counts based on matching conditions. It operates as an exporter on the traces/logs pipeline and as a receiver on the metrics pipeline. Example: count span events named “prodevent” coming from environment “prod” and emit metrics to the metrics pipeline, which exports todebug:
- Traces arrive via OTLP → processed → exported to
count. - The connector checks each span event against the
conditions. - Matches generate a metric
my.prod.event.countemitted into the metrics pipeline and exported bydebug.
SpanMetrics connector
SpanMetrics derives SRE-style metrics (rate, errors, latency histograms) and exemplars from spans. It is commonly used to produce RED metrics and latency histograms for Prometheus. Example: receive traces via OTLP, apply spanmetrics with explicit histogram buckets, dimensions, and exemplars, and export to Prometheus:- SLIs and RED metrics (requests, error rates, durations).
- Latency histograms with exemplars for trace-level correlation.
- Error trend analysis by dimensions (status code, method).
ServiceGraph connector
ServiceGraph computes a service dependency graph from trace spans, identifying client→service and service→service edges and generating related metrics to highlight hotspots or unexpected dependencies.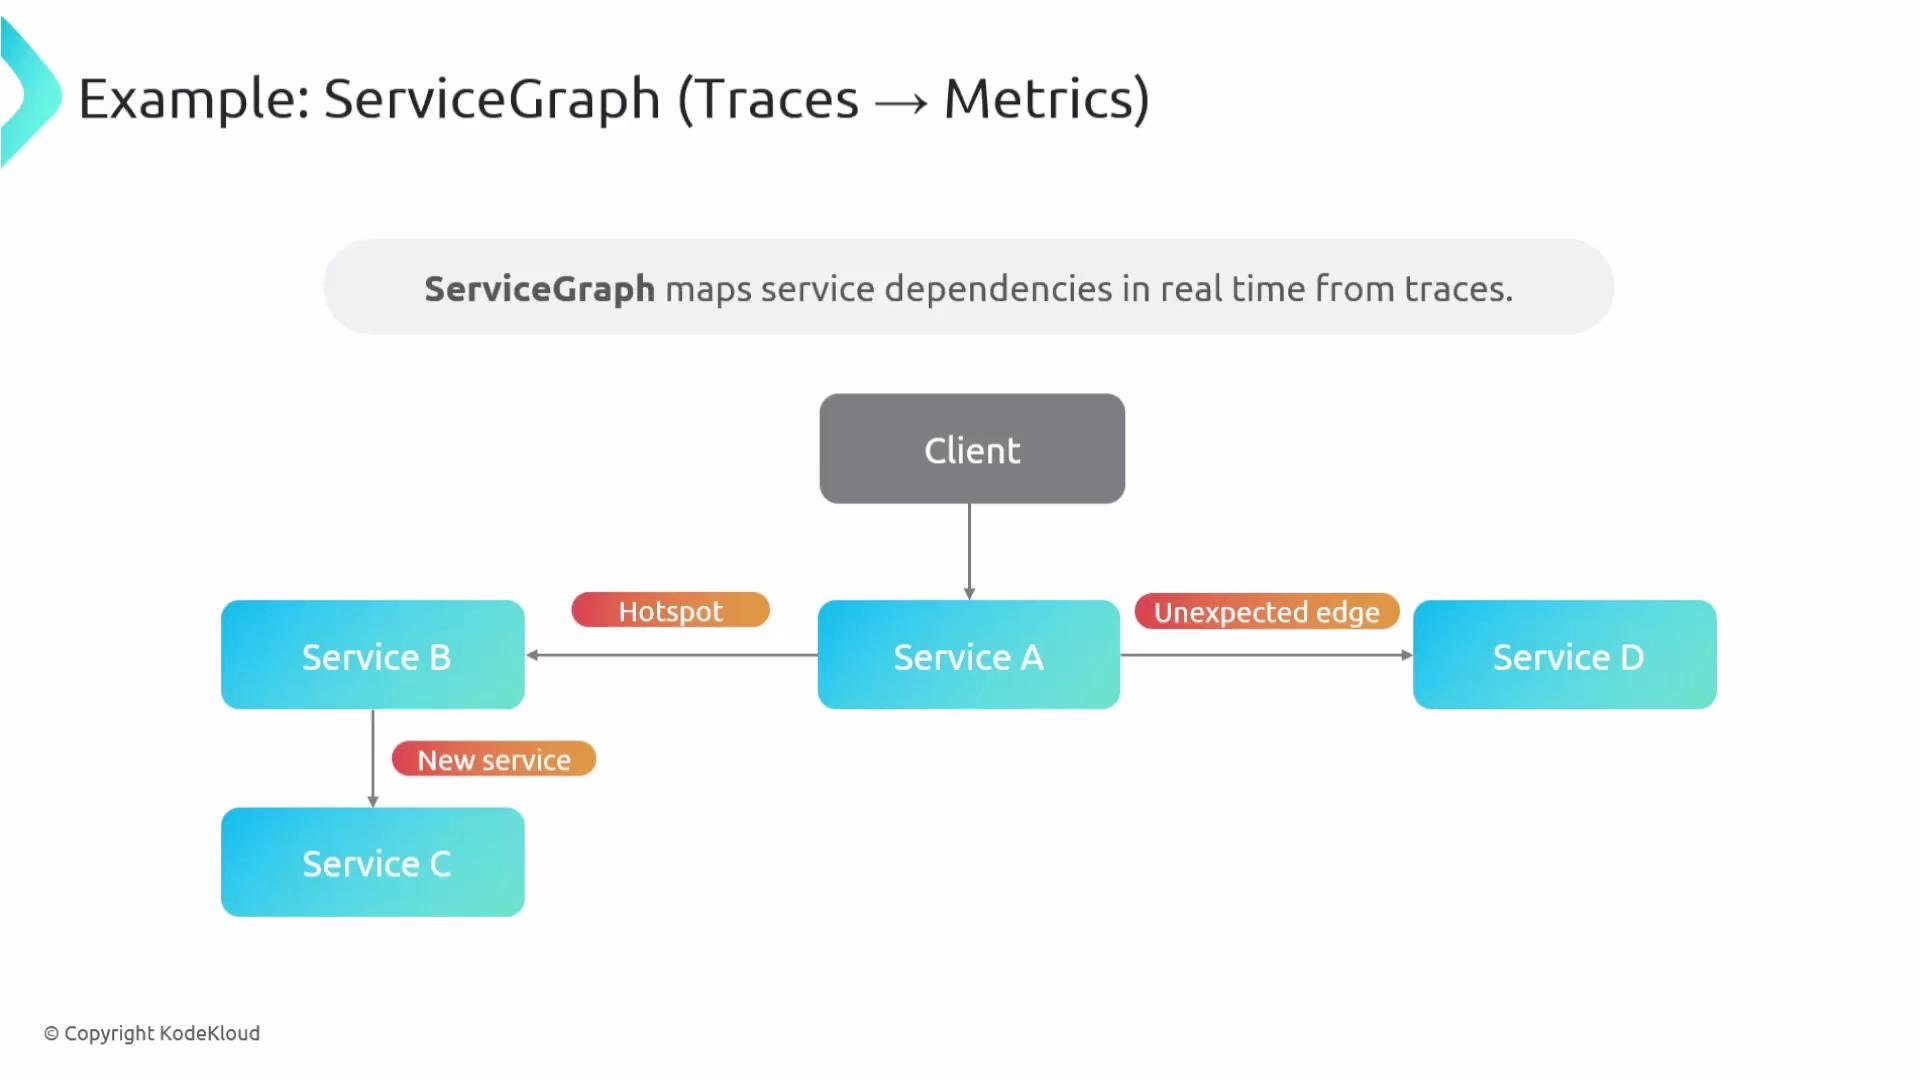
servicegraph and expose dependency metrics to Prometheus:
- Metrics showing edges and counts between services.
- Can highlight hotspots and unexpected edges for dependency analysis.
Routing connector (OTTL-based routing)
The Routing connector evaluates OTTL (OpenTelemetry Transformation Language) expressions to dispatch telemetry to different pipelines. Use cases include environment isolation, tenant routing, error pipelines, and fan-out. Key options:default_pipelines— where to send unmatched items.match_once— stop after first match (reduce duplication).error_mode— how to handle OTTL evaluation errors.
traces/prod if resource has env=prod, route error spans (status >= 400) to traces/errors, and use a default pipeline for others:
filelog receiver that contains multiple environments:
- Use
match_onceto avoid duplicates when you only want one destination. - Use
default_pipelinesto ensure unmatched telemetry still gets processed. - Test rules with a small dataset to avoid misrouting production telemetry.
Forward connector
The Forward connector is a lightweight bridge that forwards telemetry between pipelines without transformation. It’s useful for merging sources, splitting for multiple downstream destinations, or creating parallel processing branches. Example: merge logs from two receivers into a single merged logs pipeline, and branch traces into sampled vs all:- When you need to combine multiple inputs into one pipeline.
- When you need to create parallel downstream processing (fan-out).
Sum connector
The Sum connector aggregates numeric attributes from spans into time-series sums, optionally grouping by attributes (labels). Useful for business KPIs like revenue, order totals, or counters derived from attributes. Example: sum order totals and discounts from span attributes, grouped bypromo.code:
- Time-series
purchase.order.totalandpurchase.discount.totalcontaining sums of numeric attributes. - Labels from
promo.codelet you split KPIs by campaign or promotion.
Exceptions connector
The Exceptions connector extracts exception information found in spans and converts that data into logs or log-like telemetry including trace/span IDs for correlation. This is valuable for building error-focused pipelines and alerting. Example: send traces throughexceptions to produce logs consumed by a logs pipeline:
- The connector emits structured logs for exceptions that include trace and span IDs.
- Use these logs for alerting, storage in a log backend, or further enrichment.
Wrap-up Connectors let you transform, route, and enrich telemetry inside the Collector without touching application code. They help you:
- Produce SRE metrics and SLIs from traces (spanmetrics, count, sum).
- Build dependency/topology metrics (servicegraph).
- Route and isolate telemetry (routing, forward).
- Extract errors and exceptions for dedicated pipelines (exceptions).
Be careful with fan-out and overlapping rules. Multiple connectors or routing rules can cause duplicated metrics/logs if match conditions overlap. Test configurations and use
match_once when appropriate.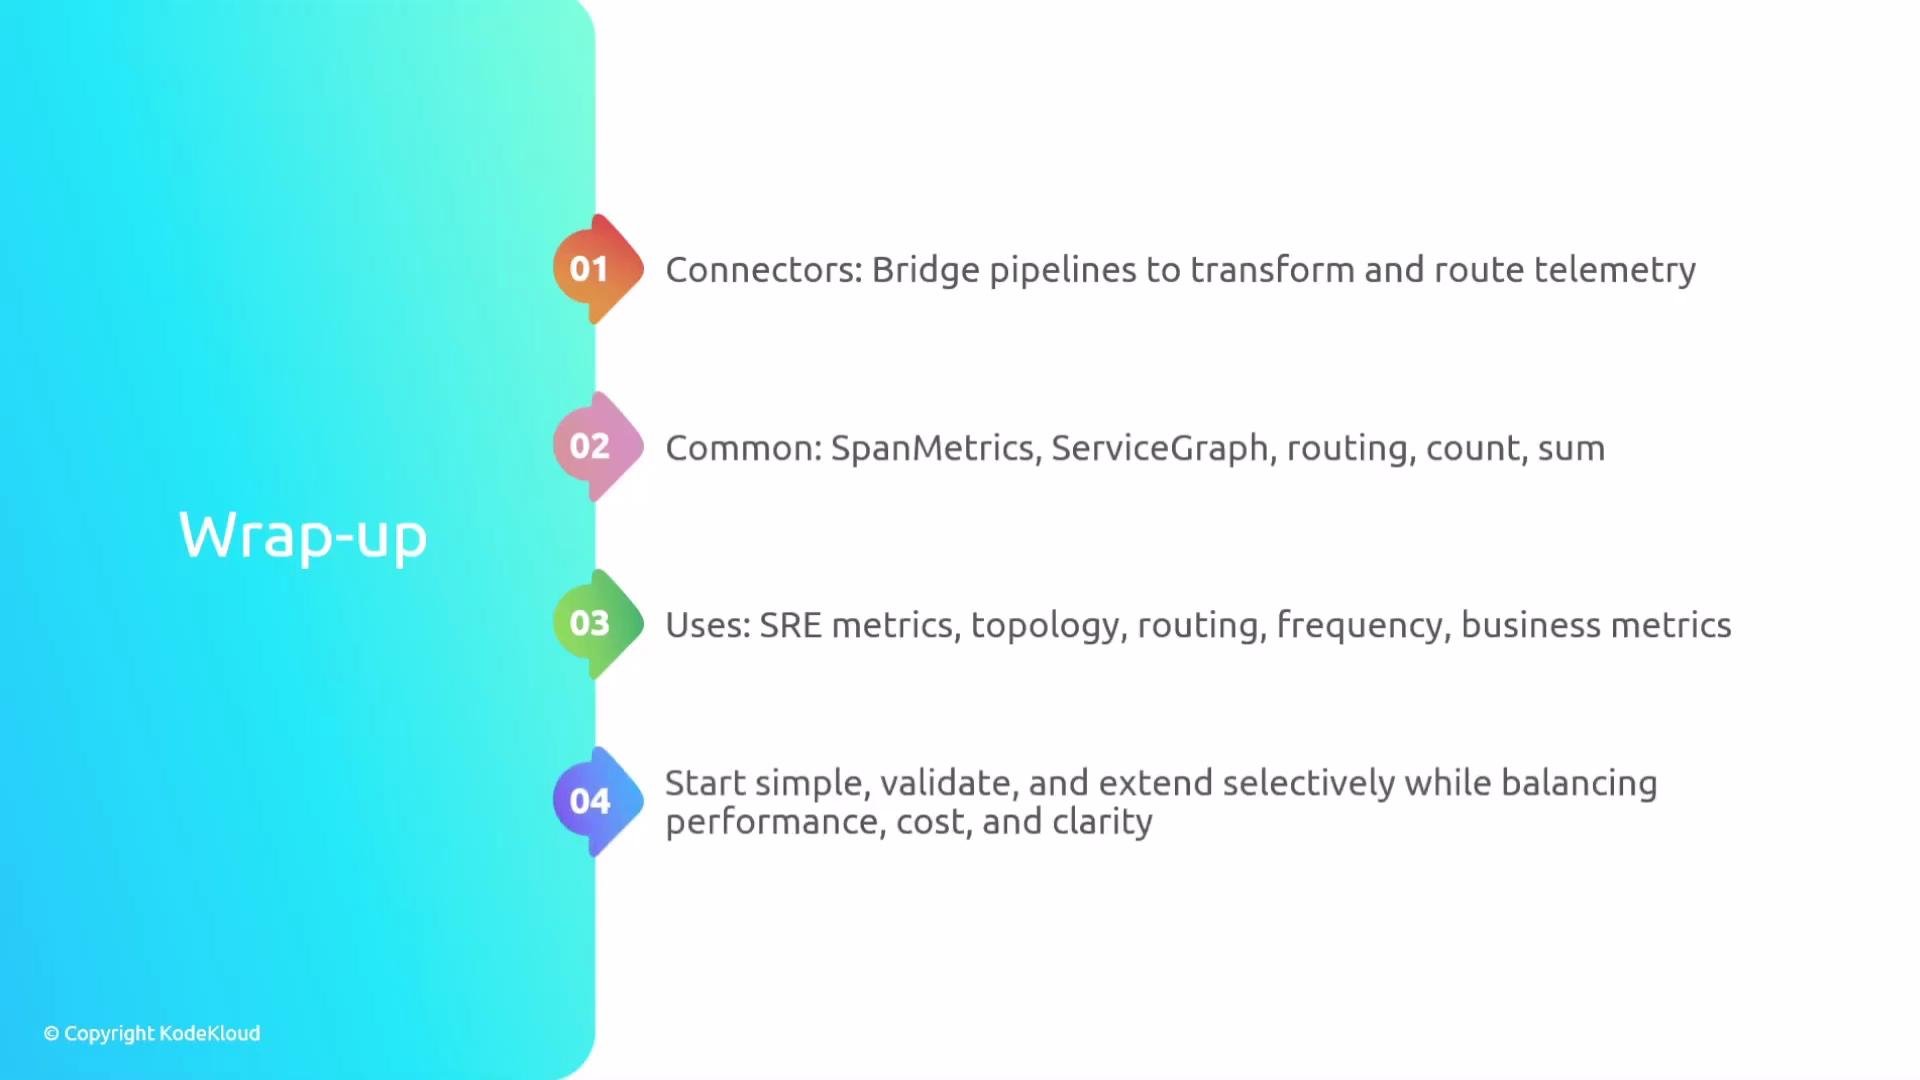
- OpenTelemetry Collector: https://opentelemetry.io/docs/collector/
- OTTL (OpenTelemetry Transformation Language): https://opentelemetry.io/docs/collector/transformations/ (refer to your Collector distribution docs for exact syntax)
- Collector Connectors (see your Collector distribution / contrib docs for supported connector names and options)